

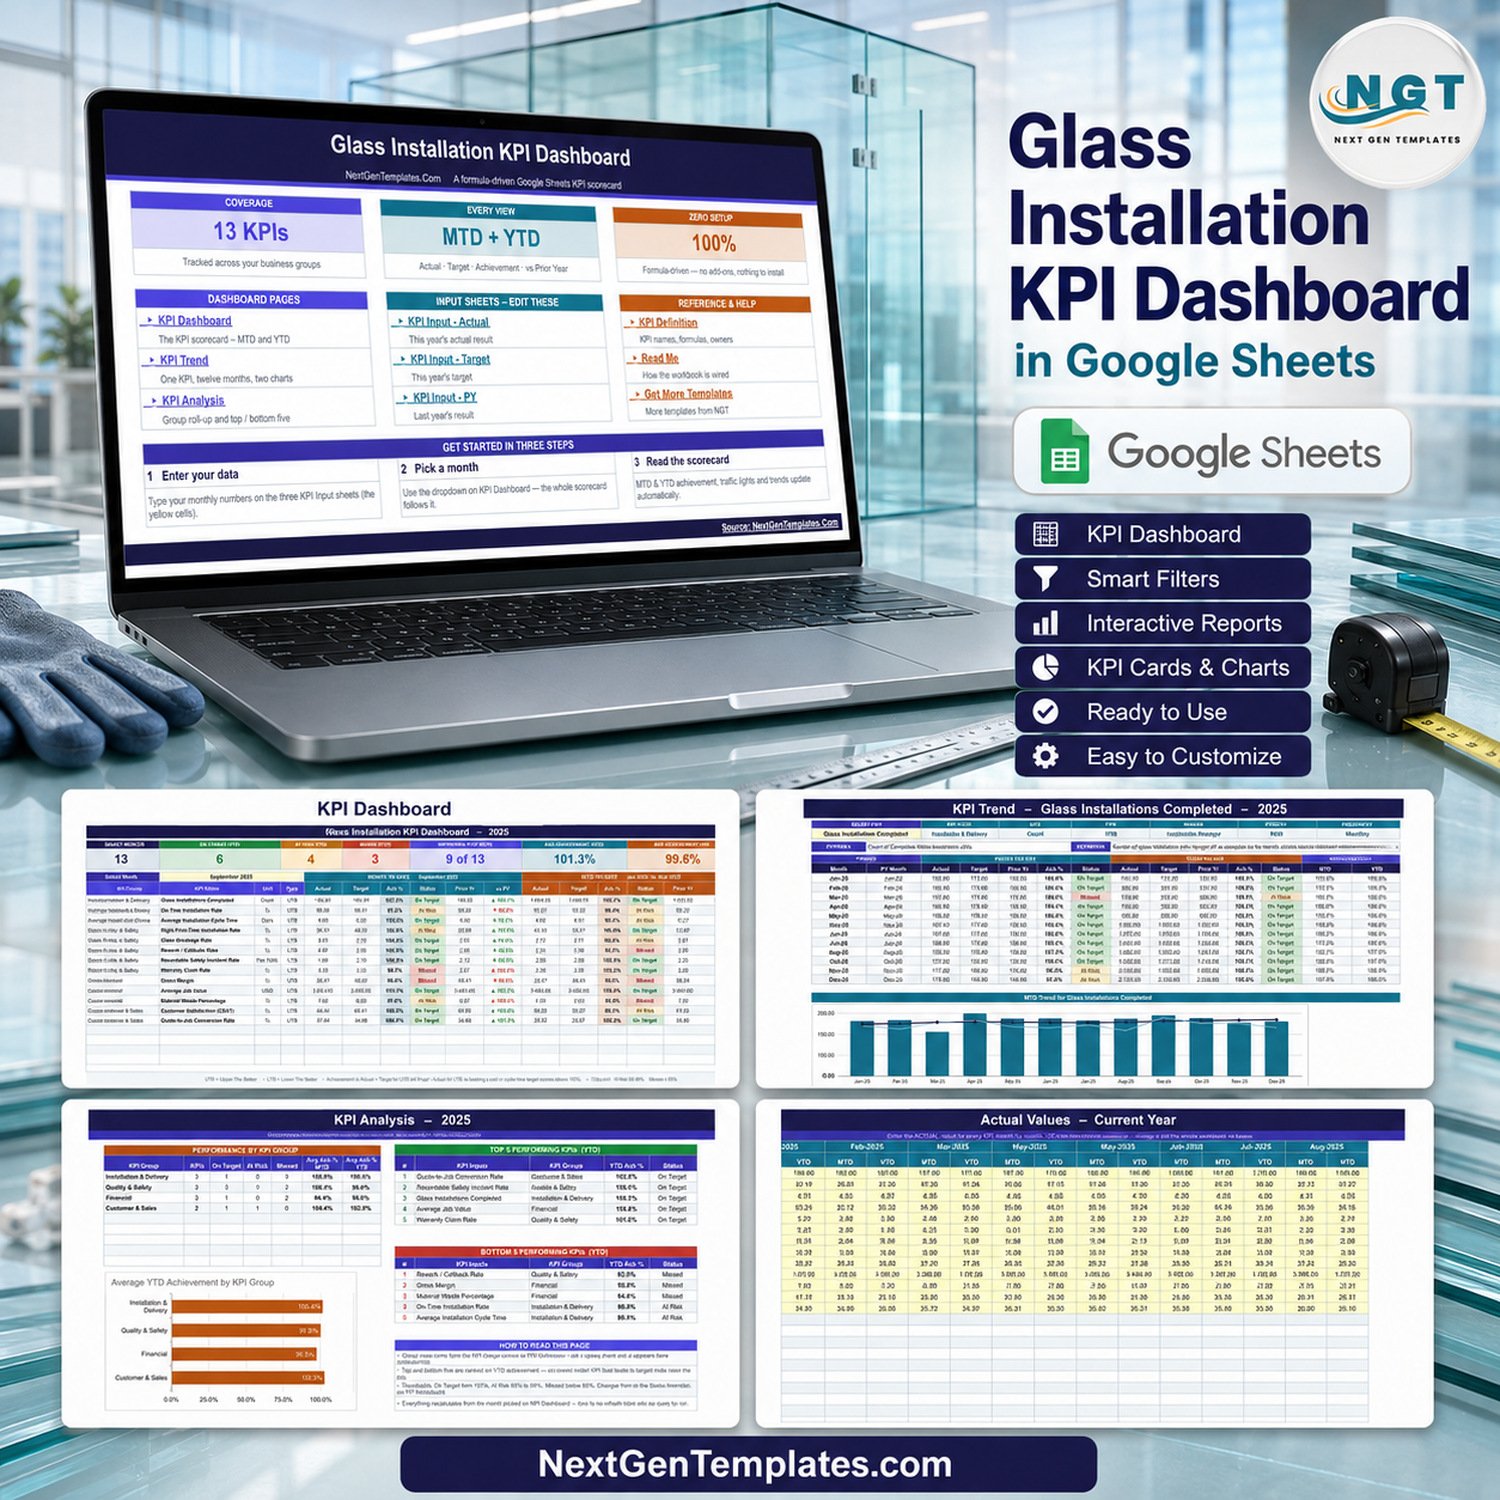

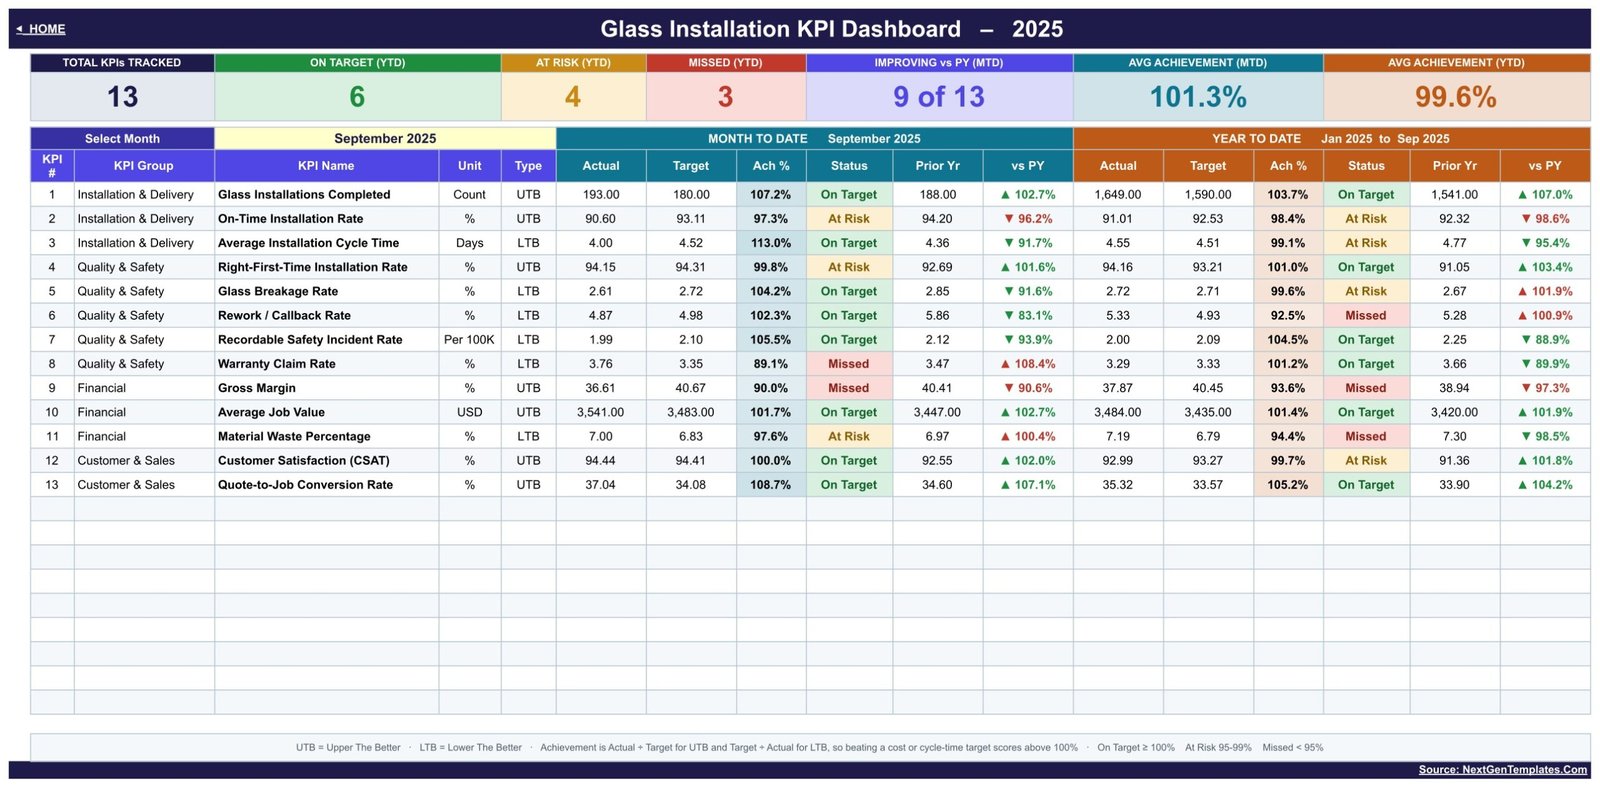
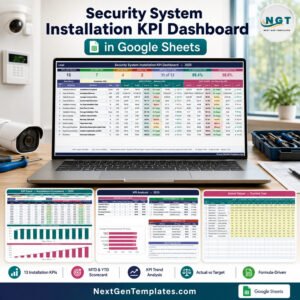
A glazing contractor who misses a promised install date does not just lose a morning – the crew, the crane hire and the re-cut all get paid for anyway. This Glass Installation KPI Dashboard in Google Sheets puts 13 monthly measures of that risk on one page: 193 installations completed against a target of 180, on-time delivery at 90.6% when the target was 93.11, breakage at 2.61% and gross margin at 36.61% against a 40.67 target. Every figure is a live formula, there is nothing to install, and you pay once – 8.99 instead of 13.99, with lifetime access to the copy you keep in your own Google Drive.
Key Features of the Glass Installation KPI Dashboard in Google Sheets
- 13 glazing KPIs in four groups – Installation & Delivery (3), Quality & Safety (5), Financial (3) and Customer & Sales (2).
- Direction-aware scoring – 7 upper-the-better and 6 lower-the-better metrics. Achievement is Actual / Target for a UTB measure and Target / Actual for an LTB one, so beating a breakage or cycle-time target scores above 100% instead of reading like a failure.
- One month picker drives everything – choose September 2025 on the KPI Dashboard sheet and the trend page, the analysis page and all seven header cards re-read from it.
- MTD and YTD side by side – Actual, Target, Achievement %, Status, Prior Yr and vs PY, twice over, in every KPI row.
- Traffic lights you can move – On Target from 100%, At Risk 95% to 99%, Missed below 95%, all set in the Status formulas rather than in a hidden add-on.
- Twelve months of sample data – a full 2025 year is already typed in, so the scorecard works before you enter a single number of your own.
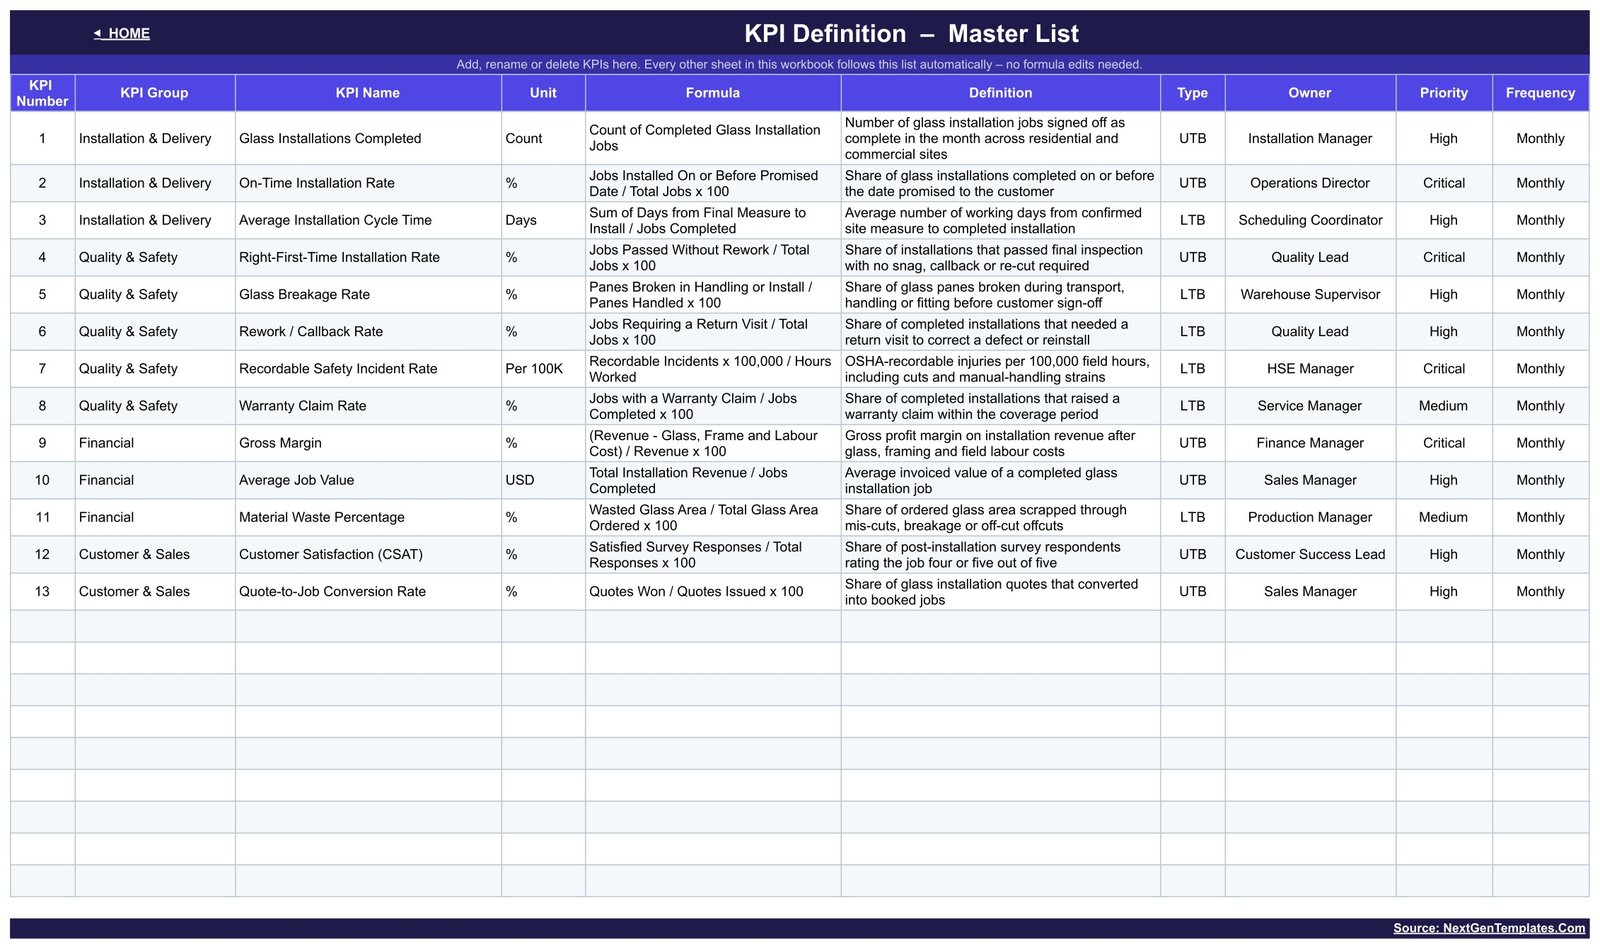
- An editable KPI register – name, unit, formula, definition, UTB/LTB type, owner, priority and frequency for all 13 measures, in plain cells.
- No add-ons, no macros, no scripts – it is spreadsheet formulas, so it opens in any browser and shares with a link.
What Is Inside the Glass Installation KPI Scorecard
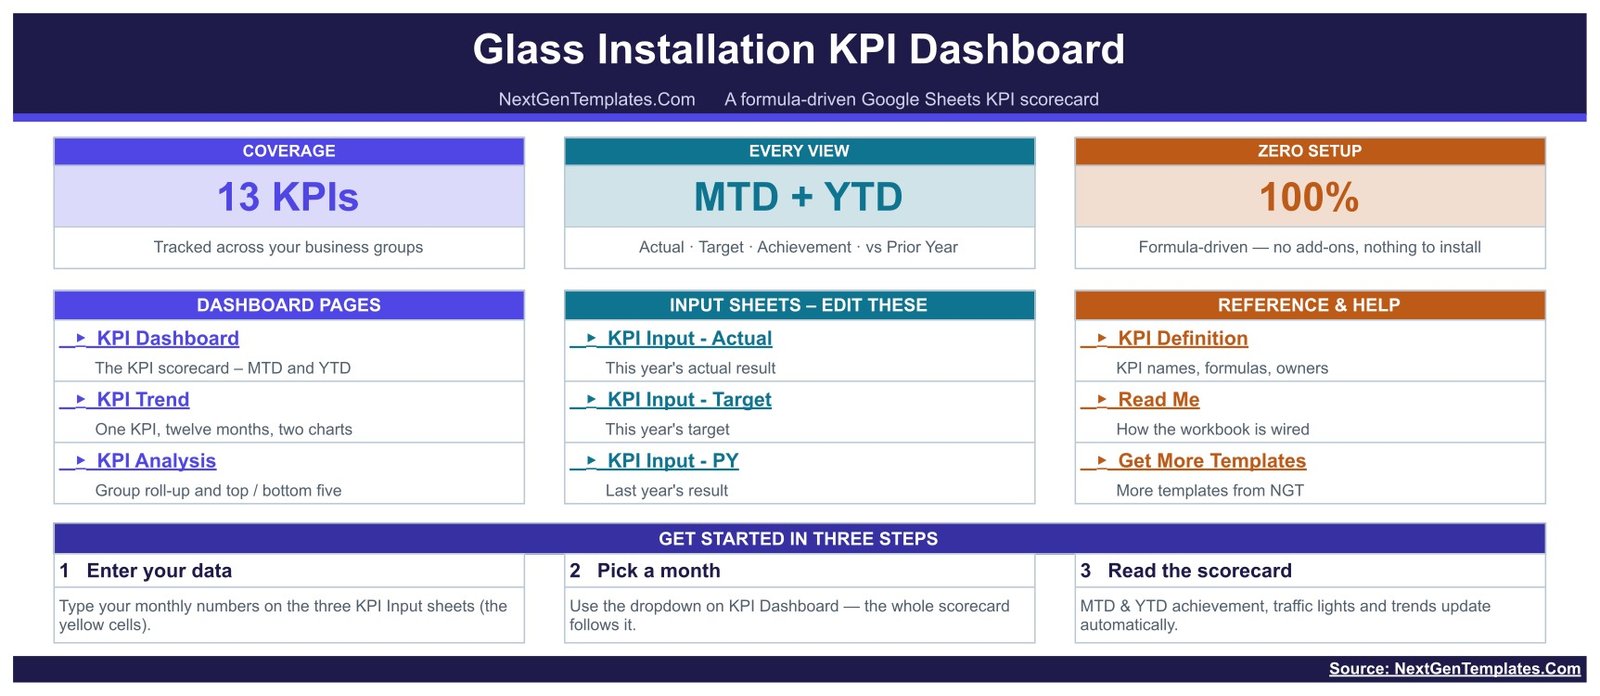
Nine sheets, in three sets.
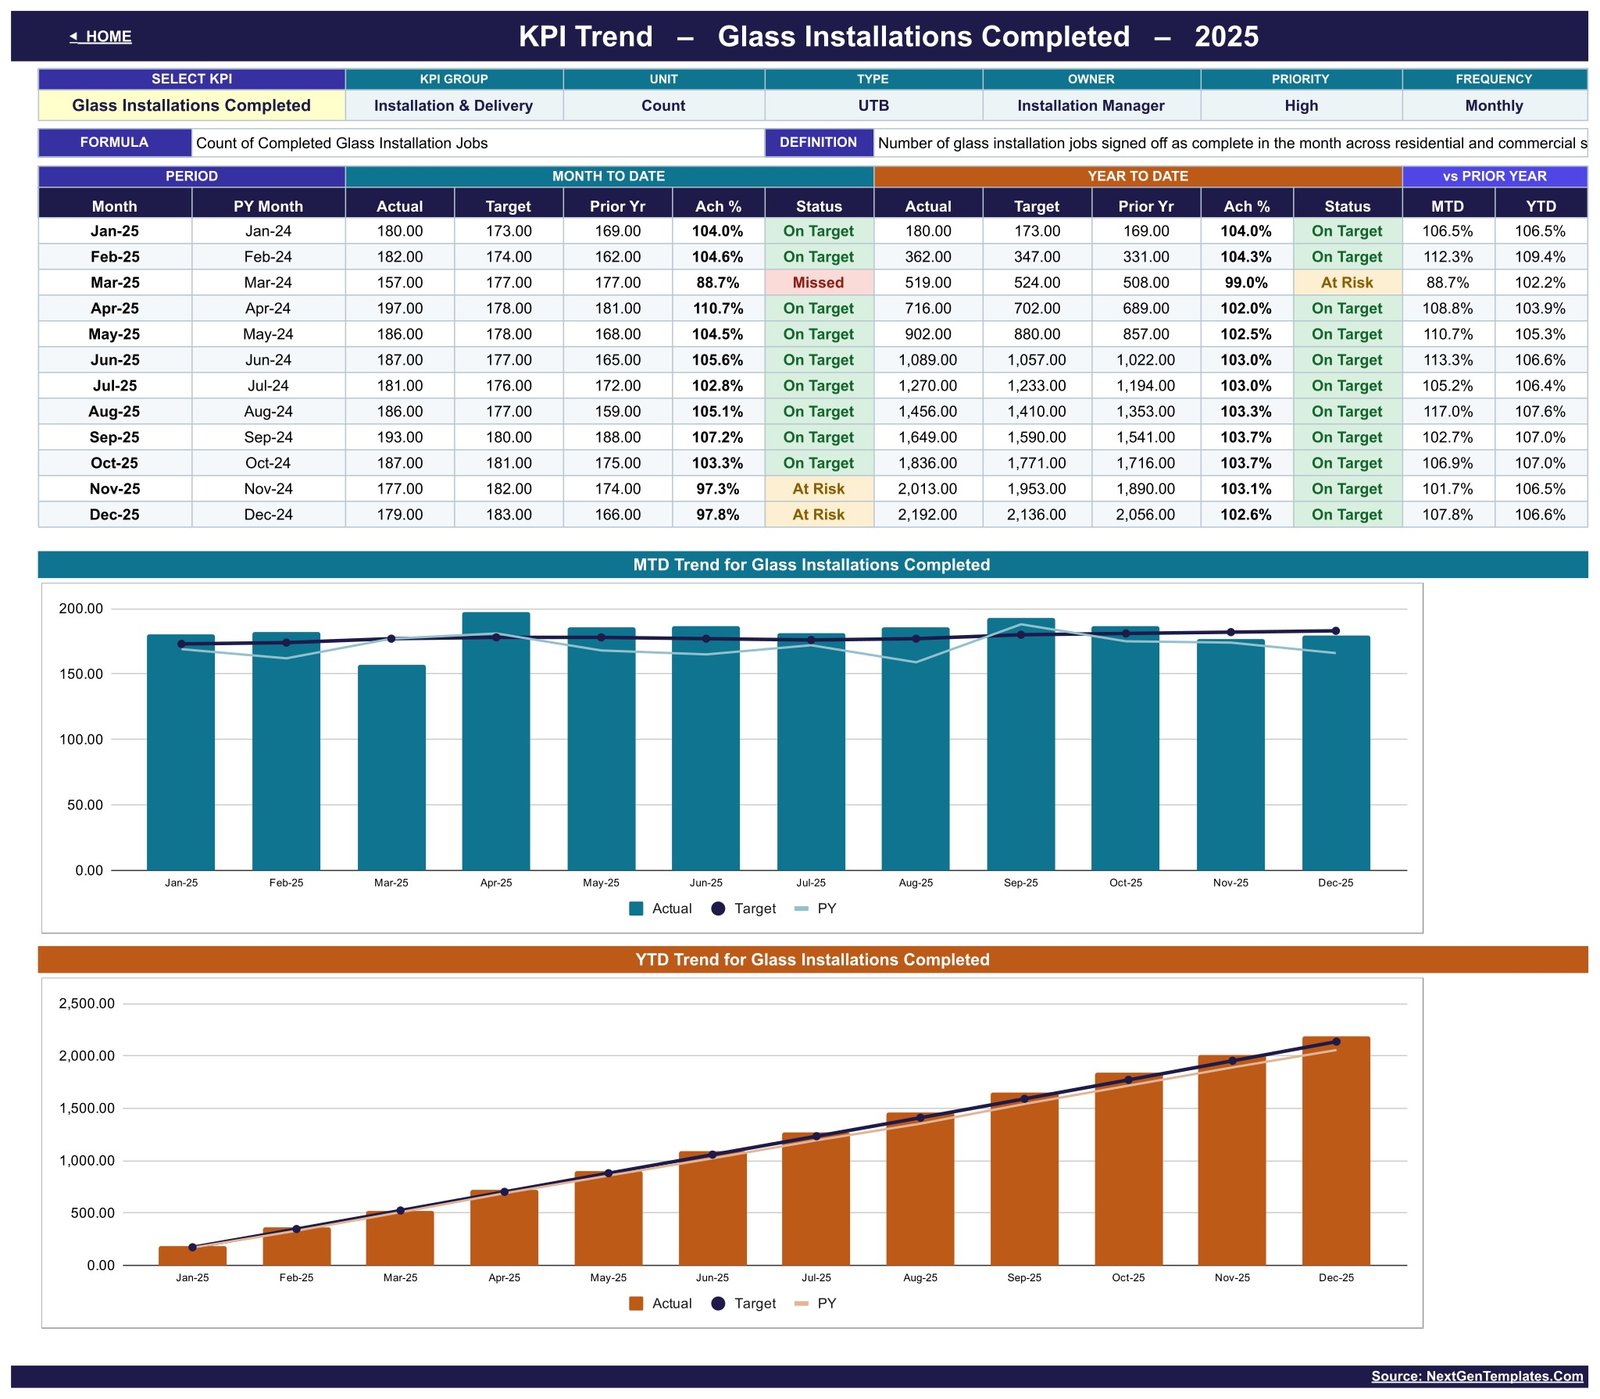
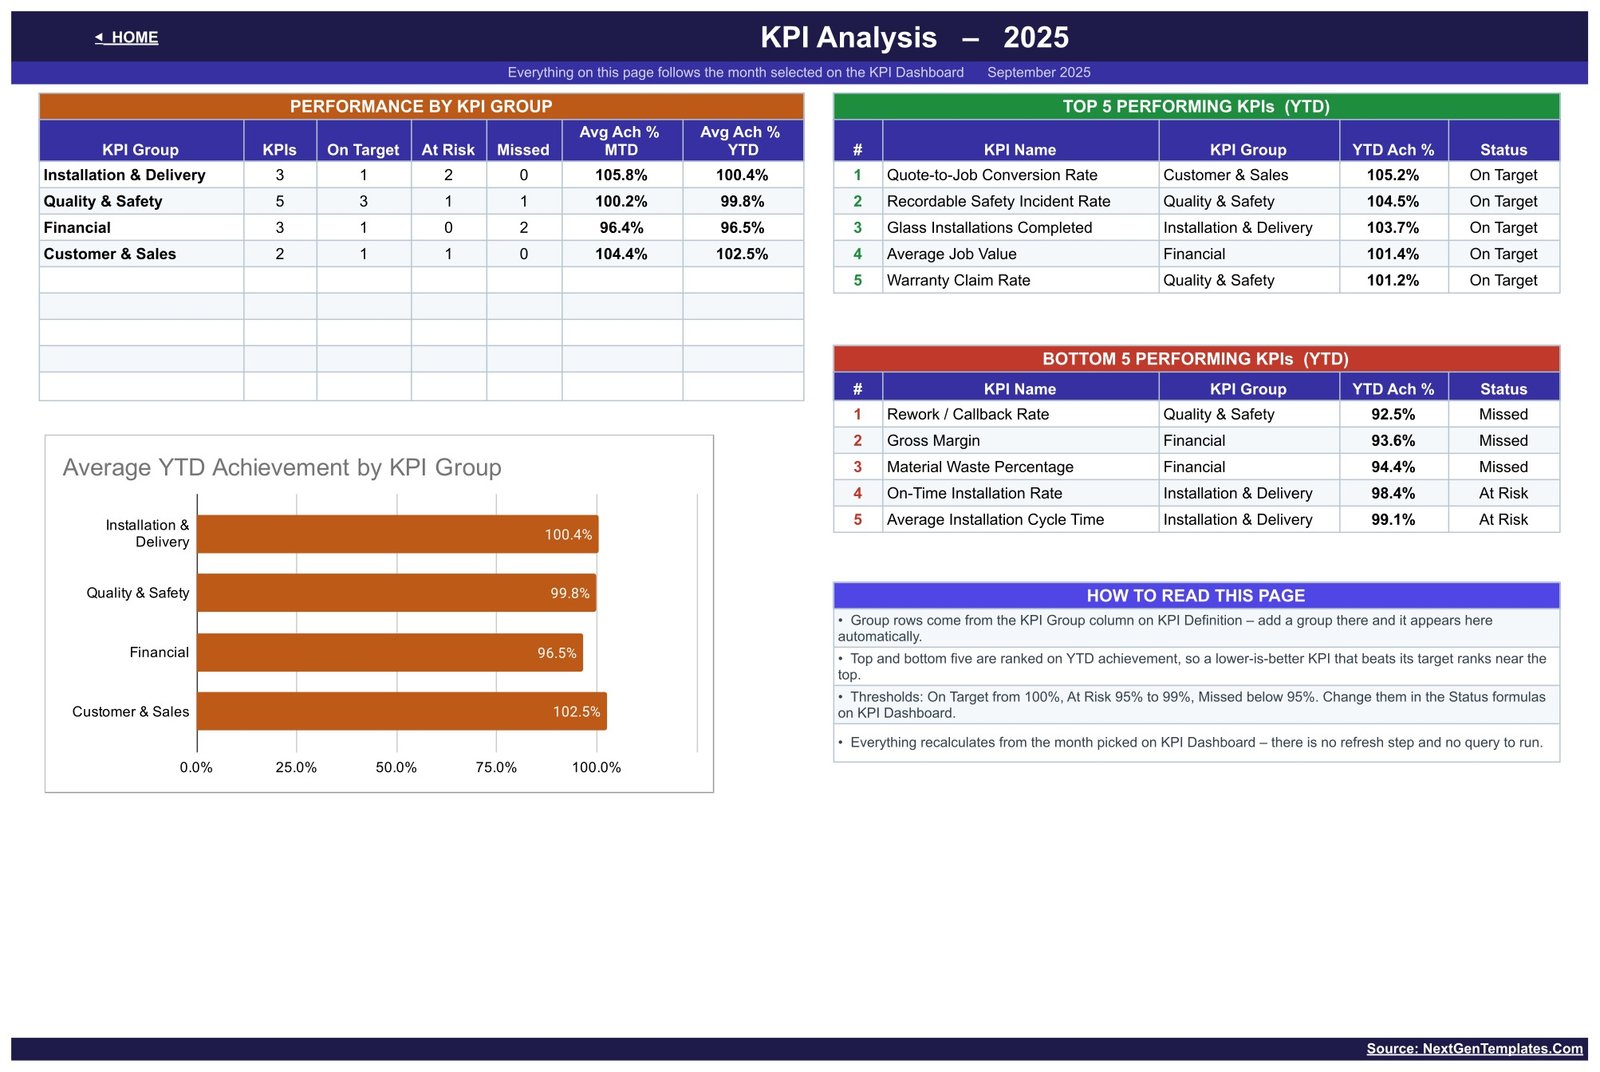
Three dashboard pages. KPI Dashboard is the scorecard itself: seven header cards (13 tracked, 6 On Target, 4 At Risk, 3 Missed on YTD, 9 of 13 improving vs prior year, 101.3% average MTD achievement, 99.6% YTD) above a 13-row table. KPI Trend takes one KPI at a time and shows twelve months of MTD and YTD actuals, targets and prior-year figures with a chart for each. KPI Analysis rolls the same numbers up by group and ranks the top and bottom five by YTD achievement – in the sample year Quote-to-Job Conversion leads at 105.2% and Rework / Callback Rate trails at 92.5%.
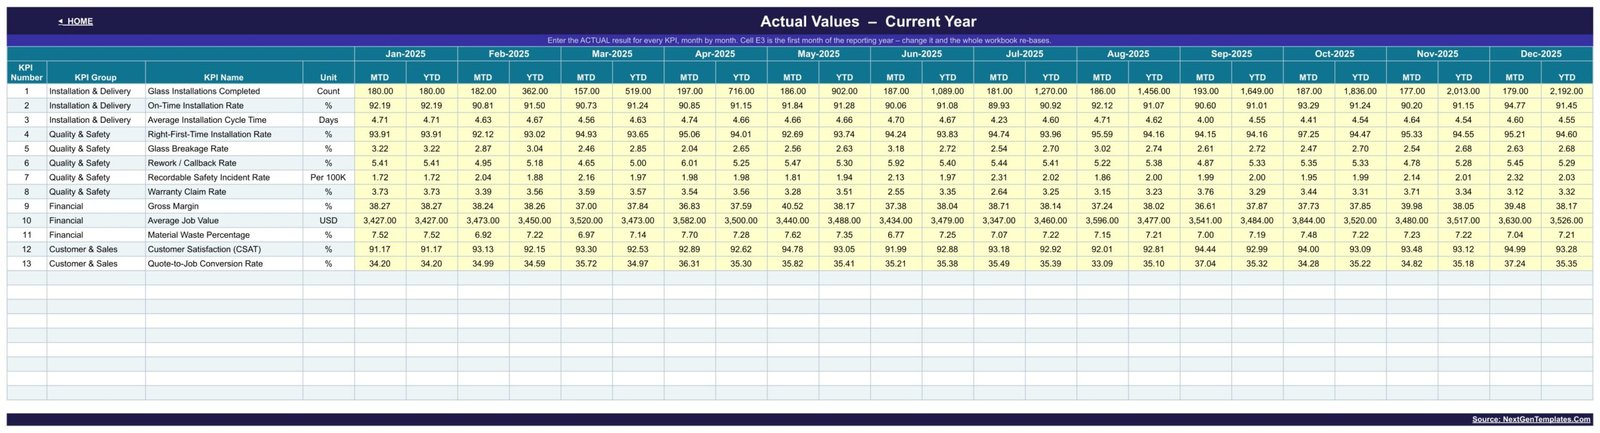
Three input sheets. KPI Input – Actual, KPI Input – Target and KPI Input – PY. Each is a 13-row by 12-month grid of yellow cells with an MTD and a YTD column per month. Cell E3 on the Actual sheet sets the first month of your reporting year, so an April-to-March year re-bases the whole workbook.
Three reference sheets. KPI Definition holds the master list every other sheet reads – change a KPI name there and it changes everywhere. Read Me explains the wiring. Get More Templates links back to the catalogue.
Google Sheets vs. Excel vs. Paid Field-Service Software – Where This Fits
| This scorecard | An Excel KPI workbook | ServiceTitan / Jobber tier | |
|---|---|---|---|
| Cost | 8.99 once | 12.99 once | 99-300+ per user per month |
| Platform | Google Sheets, any browser | Desktop Excel | Web and mobile app |
| Setup time | Copy the file, type your numbers | Download, open, type | Weeks of onboarding |
| Real-time collaboration | Yes, native | Only via OneDrive | Yes |
| Mobile access | Sheets app | Excel mobile | Yes |
| Customisable KPIs | Edit the KPI Definition sheet | Edit the sheet | Fixed report library |
| Share with a link | Yes | No | Seat-based |
| Year-1 cost, 5 users | 8.99 | 12.99 | 6,000-18,000 |
| Job scheduling and dispatch | No | No | Yes |
| Where the data lives | Your Drive | Your disk | Vendor cloud |
Who This Template Is For – and Who It Is Not For
It fits a residential and commercial glazing firm running roughly 150-250 installs a month, an operations manager who reports to an owner once a month, a franchise reviewing several branches on one format, and anyone whose job-management system reports jobs but not KPIs.
It does not fit if you need live dispatch, quoting or surveying – this is a monthly management scorecard, not job-management software. It is not a CRM, it does not integrate with anything, and every number is typed or pasted in monthly. It will not satisfy a safety regulator either: the Recordable Safety Incident Rate row is a management metric, not an OSHA log, and nothing here records safety-glazing conformity to standards such as ANSI Z97.1 or 16 CFR 1201. It also will not help if you want daily granularity – the whole workbook is monthly.
How to Use It
- Buy, open the PDF in your download and click the copy link to put your own copy in your Google Drive.
- Open KPI Definition and rename, re-group or re-own any of the 13 KPIs. Set Type to UTB or LTB per measure.
- Set cell E3 on KPI Input – Actual to your first reporting month, then replace the sample year with your figures across the three input sheets.
- Go to KPI Dashboard and pick a month. Read the seven header cards, then the rows.
- Open KPI Trend, choose any KPI, and check whether a red month is a blip or a slide.
- Use KPI Analysis in your monthly review – it names the bottom five, which is usually the agenda.
Real-World Use Cases
Marcus, operations director at a 40-fitter glazing contractor. On-time installation reads 97.3% MTD and 98.4% YTD – both amber. He opens KPI Trend on that measure, sees the slide began in July, and traces it to the surveyor backlog rather than to the fitters.
Priya, owner of a shopfront and curtain-wall firm. Gross margin has missed for three months at 93.6% YTD while average job value is fine at 101.4%. The problem is cost, not pricing – Material Waste Percentage is red too at 94.4%, so she starts at the cutting table.
Dan, quality lead. Right-First-Time is 94.15% against a 94.31 target – amber by a fraction – but Rework / Callback Rate is the worst measure in the workbook at 92.5% YTD. He puts both on the monthly review with the trend charts attached.
Frequently Asked Questions
Do I need a Google Workspace account?
No. A free personal Google account is enough. Click the link in the PDF and Sheets makes your own copy.
Can I change the 13 KPIs to my own?
Yes. The KPI Definition sheet is the master list – rename or re-group a KPI there and the dashboard, trend and analysis pages follow. Adding rows beyond 13 means extending the three input grids as well.
Does it handle a non-calendar financial year?
Yes. Cell E3 on KPI Input – Actual sets the first month of the reporting year and the whole workbook re-bases.
Are the numbers in the screenshots real?
No. The 2025 figures are sample data so you can see the formulas working. Replace them with yours.
Can I edit the traffic-light thresholds?
Yes. On Target from 100%, At Risk 95-99% and Missed below 95% live in the Status formulas on the KPI Dashboard sheet.
Is there an Excel or Power BI version?
Yes for Power BI – the Glass Installation KPI Dashboard in Power BI is the same 13-KPI scorecard rebuilt as a Power BI report. An Excel edition is in preparation. This page is the Google Sheets edition.
How is this different from your Glass Installation KPI Scorecard?
They are different products. The Glass Installation KPI Scorecard is a 10-KPI card layout; this is the 13-KPI dashboard line, with a group roll-up and a top and bottom five analysis page the scorecard does not have.
About the Author
Built by PK – Microsoft Certified Professional with 15+ years of Excel, Google Sheets, and Power BI experience. Founder of NextGenTemplates, reaching 300K+ subscribers across YouTube channels. Every template is hand-built and tested before release.
Explore Related Templates
- Glass Installation KPI Scorecard in Google Sheets – the 10-KPI card format for the same trade.
- Window and Door Installation KPI Dashboard in Google Sheets – 15 KPIs, same engine, adjacent trade.
- Garage Door Service KPI Dashboard in Google Sheets
- Locksmith Business KPI Dashboard in Google Sheets
- Browse the full Google Sheets KPI Dashboard range, or every Google Sheets template.
Get it for 8.99 instead of 13.99. One payment, your own copy in your Drive, and a full walkthrough on the NeoTechNavigators blog.
Watch the step-by-step video Demo:
Last updated: September 2026.
Compatibility and Requirements
- Works in Google Sheets. You need a free Google account and a web browser.
- You pick the reporting month on the KPI Dashboard sheet and open any KPI on the KPI Trend sheet. Google explains how to build charts like these in Add and edit a chart or graph.





























Reviews
There are no reviews yet.