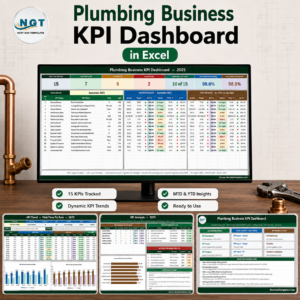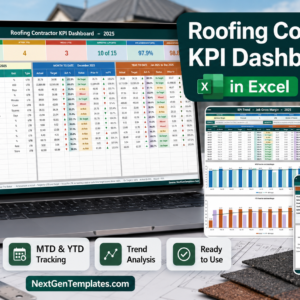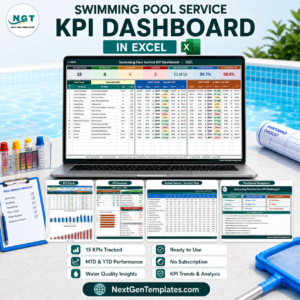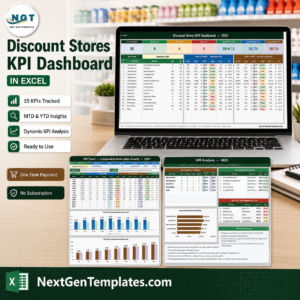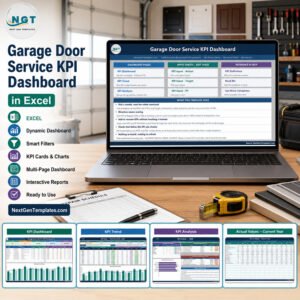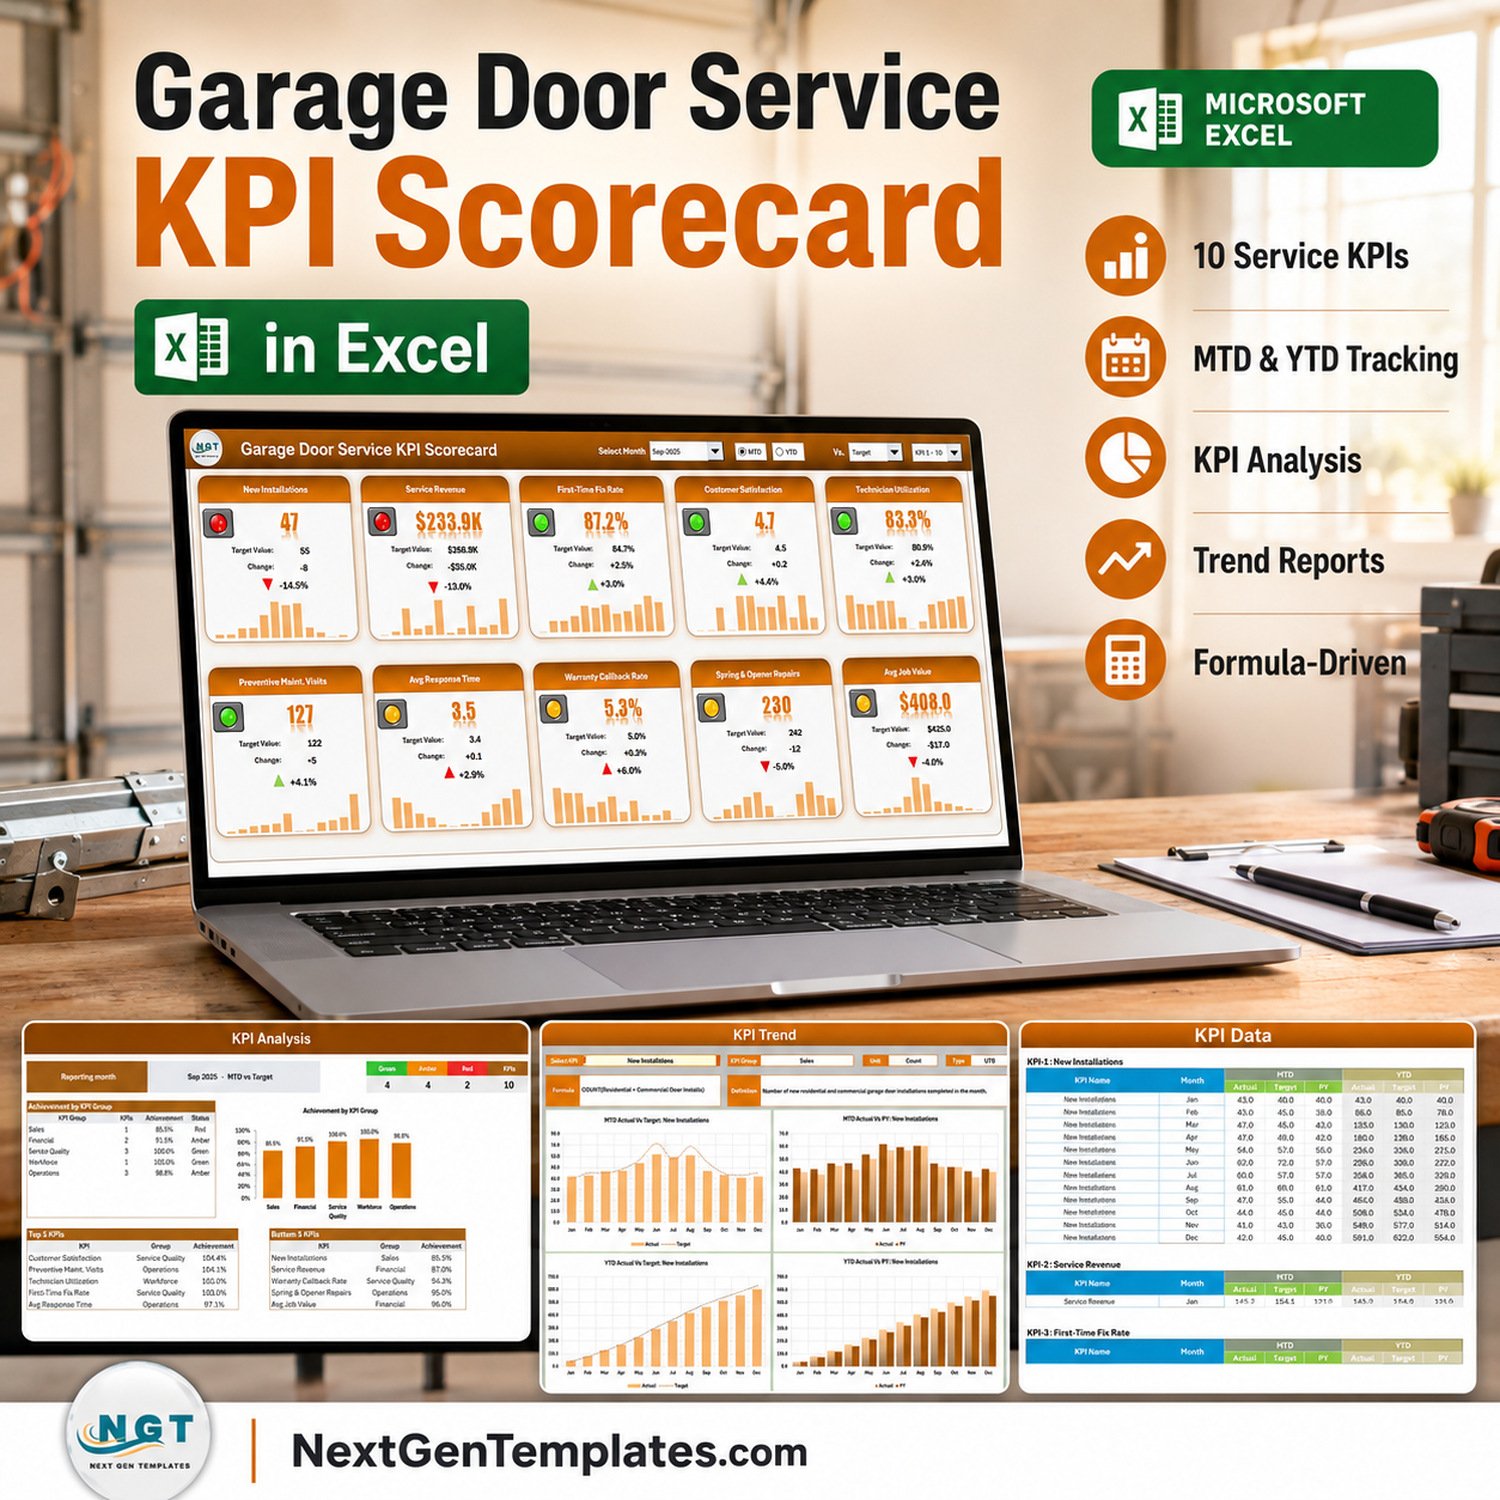

The Garage Door Service KPI Scorecard in Excel is a monthly, formula-driven scorecard for garage door installation and repair companies. It ships with 10 pre-built service KPIs across 5 groups, 12 months of MTD and YTD figures, a traffic-light tile wall, and room to grow to 20 KPIs without touching a single formula. There are no macros – 11 worksheets of formulas, conditional formatting, camera pictures and sparklines that open on any Excel from 2016 onward. Download once, own it forever, and use it on unlimited company files. If it will not open in your copy of Excel, email us and we will make it right.
This is the KPI Scorecard line – a month-picker report card that answers “how did we do in September against target?” It is a different product from our analytical KPI Dashboards, which are slicer-driven exploration tools. If you want the same ten-KPI report card but online and shareable, the Garage Door Service KPI Scorecard in Google Sheets is the identical concept built for Google Sheets.
Key Features of the Garage Door Service KPI Scorecard in Excel
- 10 garage door service KPIs, already written – New Installations, Service Revenue, First-Time Fix Rate, Customer Satisfaction, Technician Utilization, Preventive Maint. Visits, Avg Response Time, Warranty Callback Rate, Spring & Opener Repairs and Avg Job Value.
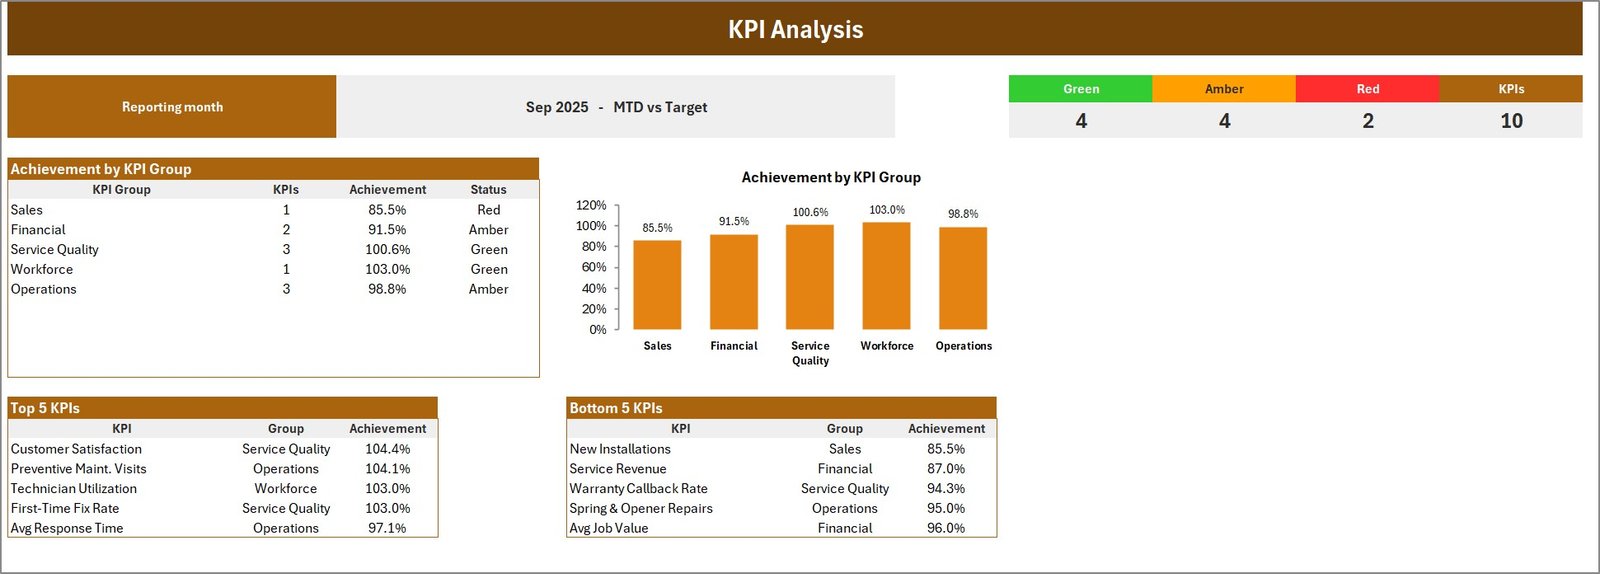
- Five KPI groups – Sales, Financial, Service Quality (3 KPIs), Workforce and Operations (3 KPIs) – each rolled up to a single achievement percentage.
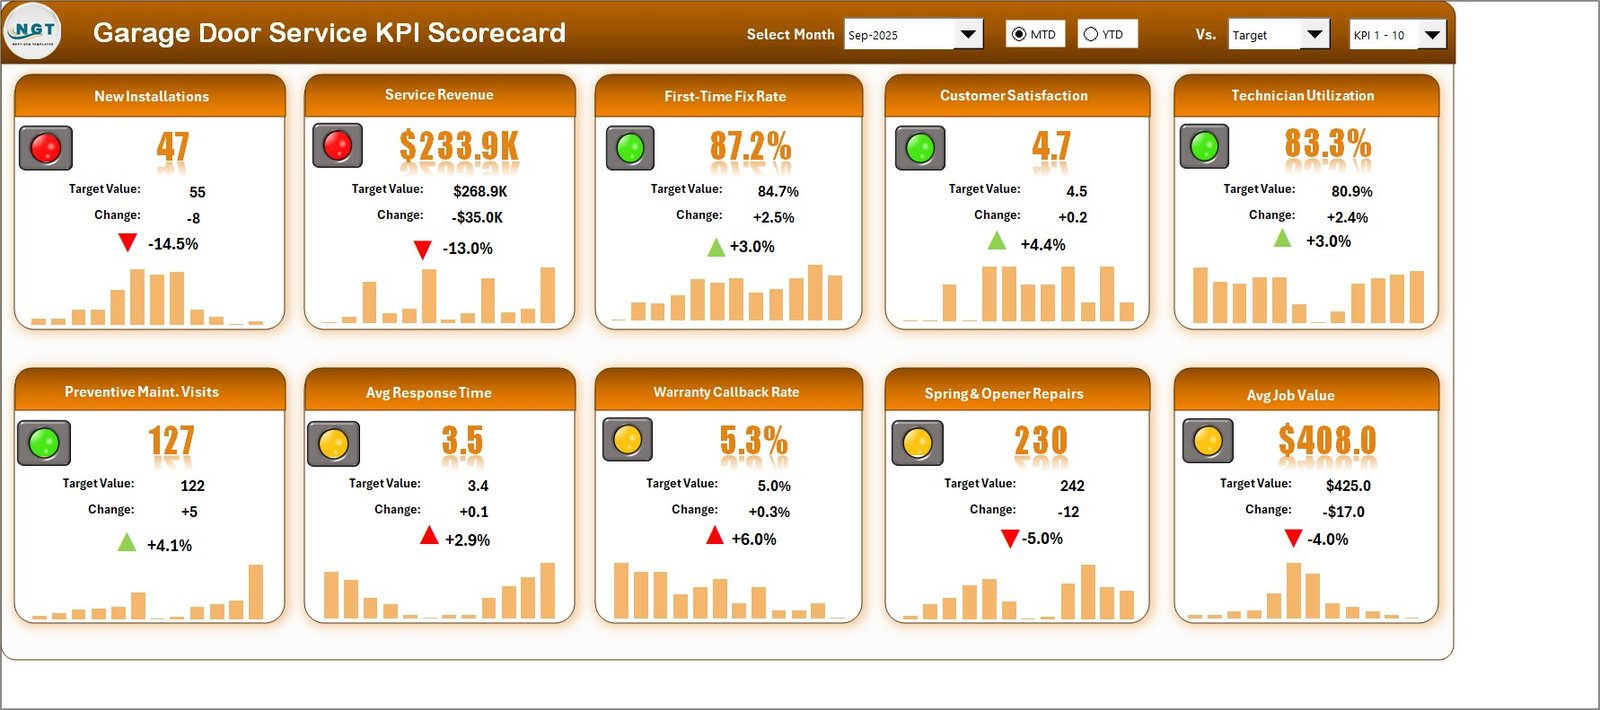
- Month picker with MTD / YTD toggle – pick Sep-2025 from the header drop-down, switch between month-to-date and year-to-date, and compare against Target, PY or Prior Month.
- Traffic lights that respect direction – each KPI is typed UTB (upper the better) or LTB (lower the better), so a rising Warranty Callback Rate scores red while a falling Avg Response Time scores green.
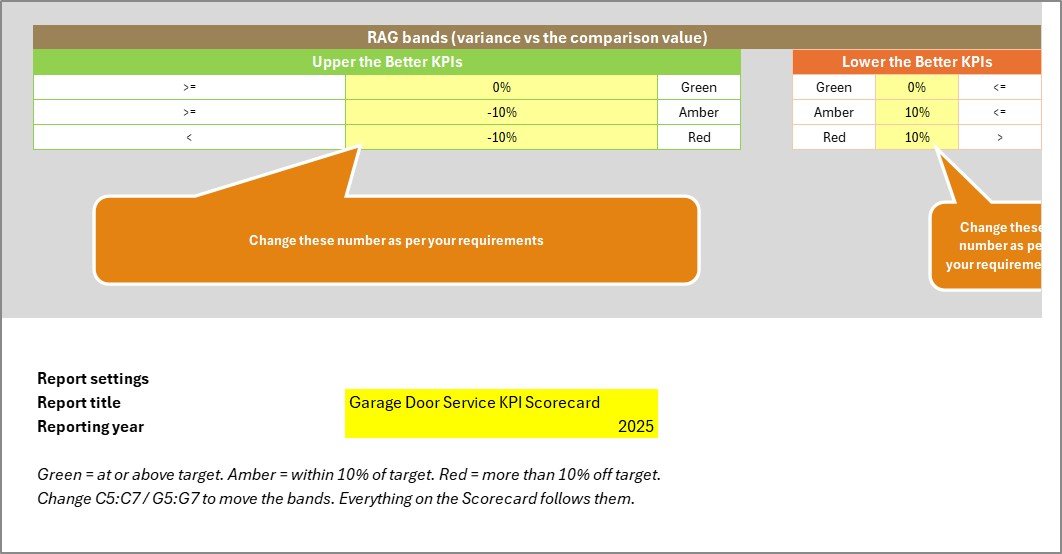
- Editable RAG bands – green at or above target, amber within 10%, red beyond. Change two small tables on Color Settings and every page follows.
- 12-month sparkline in every tile – the shape of the year sits under each number.
- KPI Analysis page – achievement by KPI group with a bar chart, plus Top 5 and Bottom 5 KPIs ranked automatically.
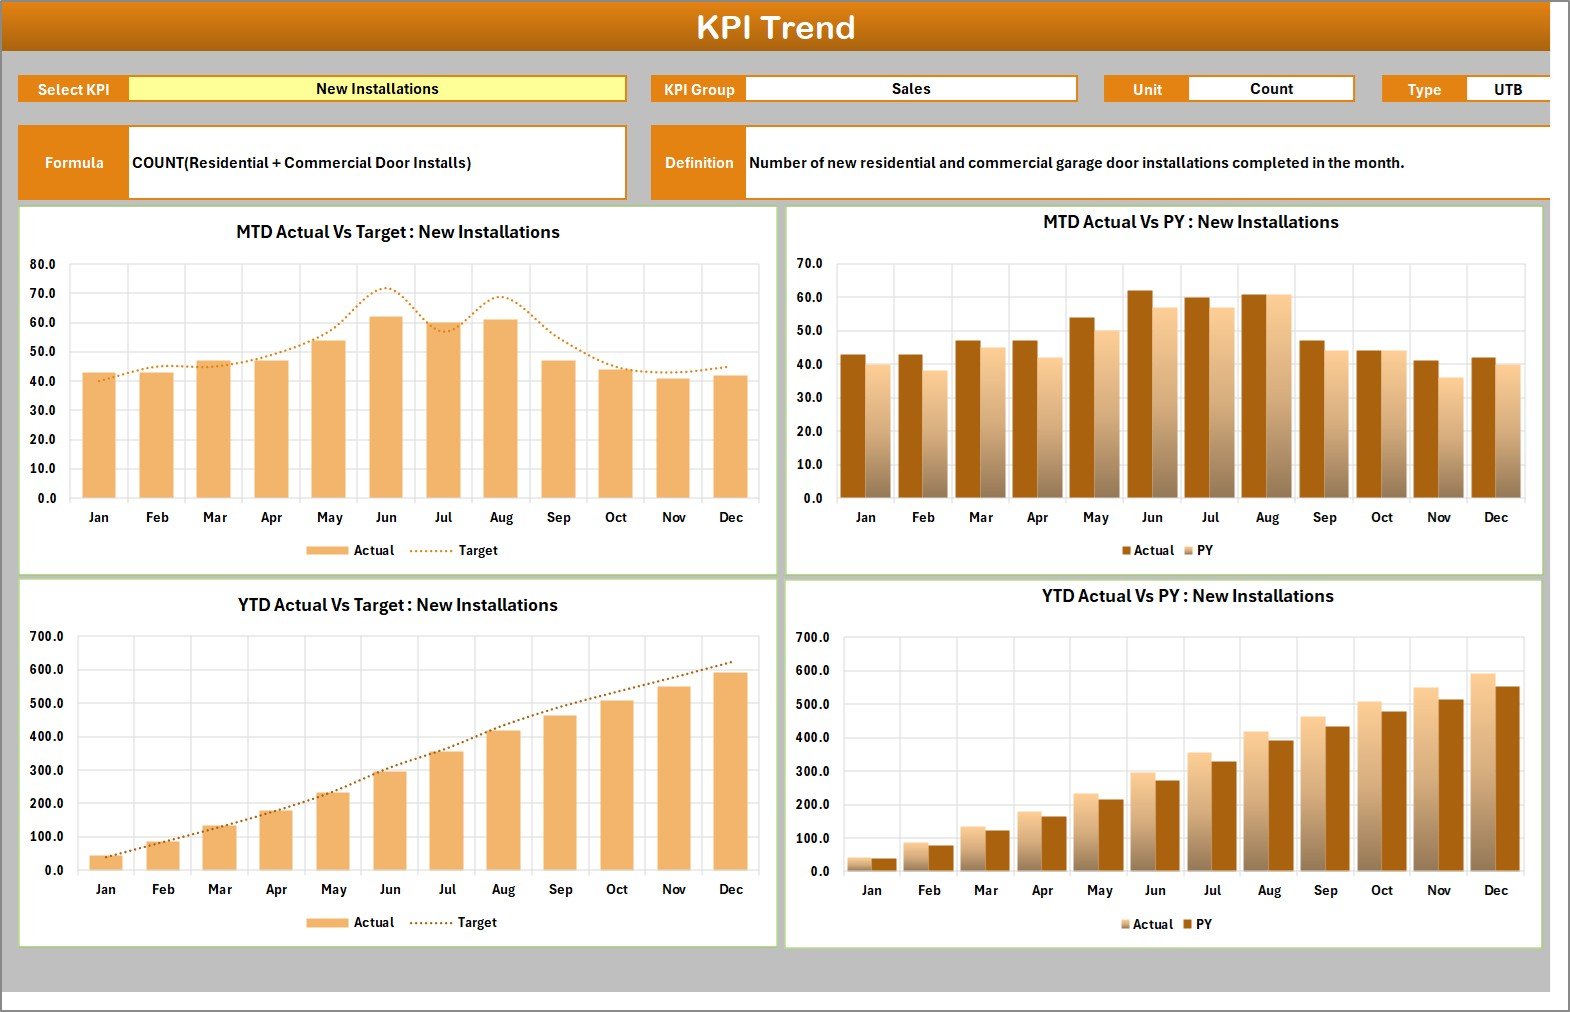
- KPI Trend page – one KPI at a time across four charts: MTD vs Target, MTD vs PY, YTD vs Target and YTD vs PY.
- Room for 20 KPIs – the Input Data sheet runs to row 319 with 20 numbered blocks, and the header has a KPI 1-10 / 11-20 set picker.
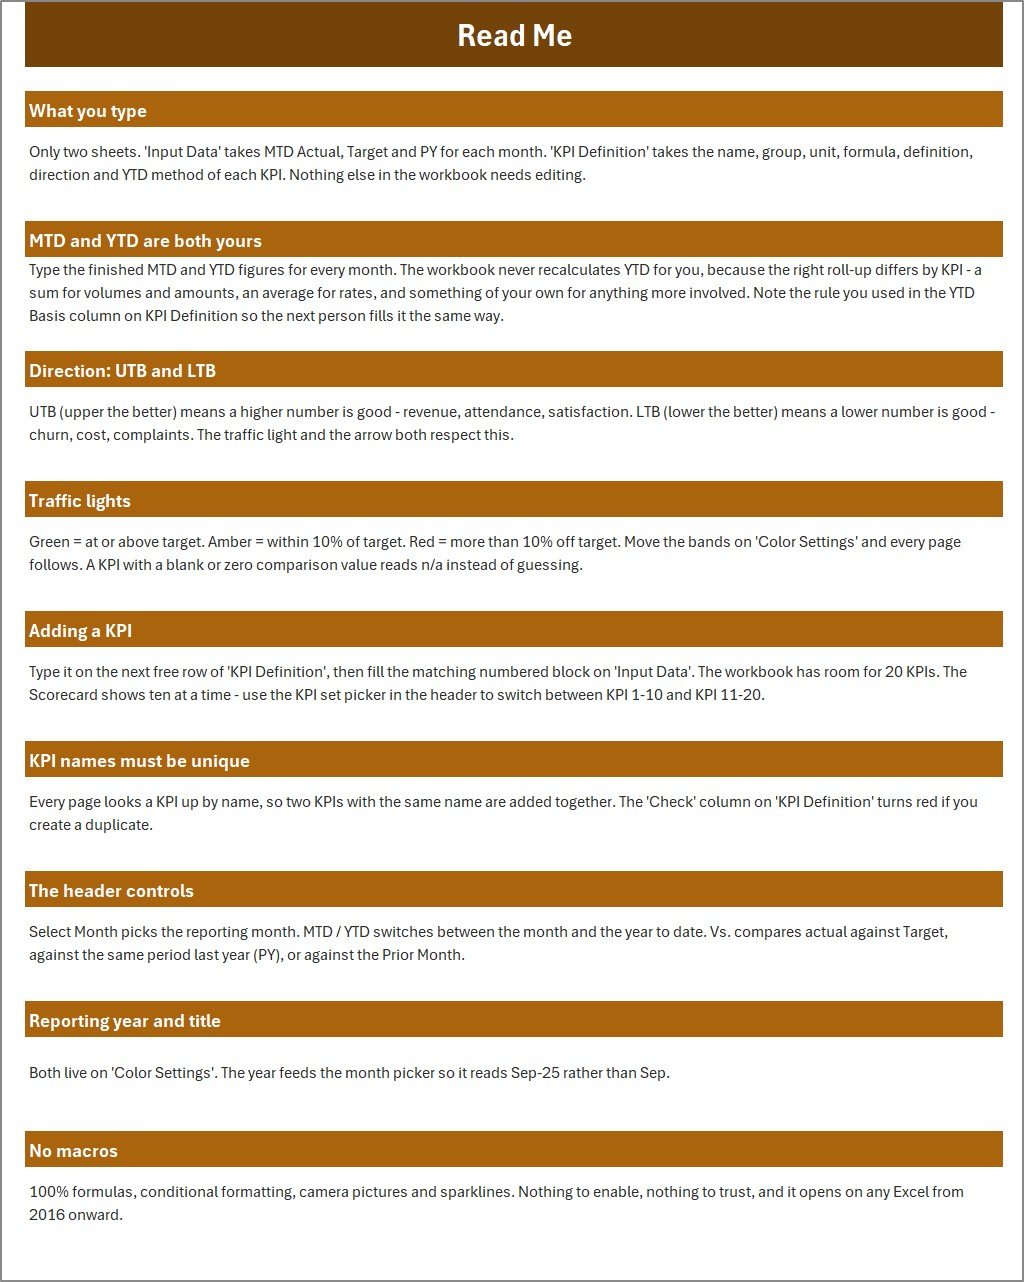
- No macros, no Power Query, no add-ins – nothing to enable and nothing to trust.
What’s Inside the Garage Door Service KPI Scorecard in Excel
One .xlsx workbook with 11 sheets (2 hidden calculation sheets), plus the Excel KPI Scorecard user manual as a PDF, delivered in a single ZIP.
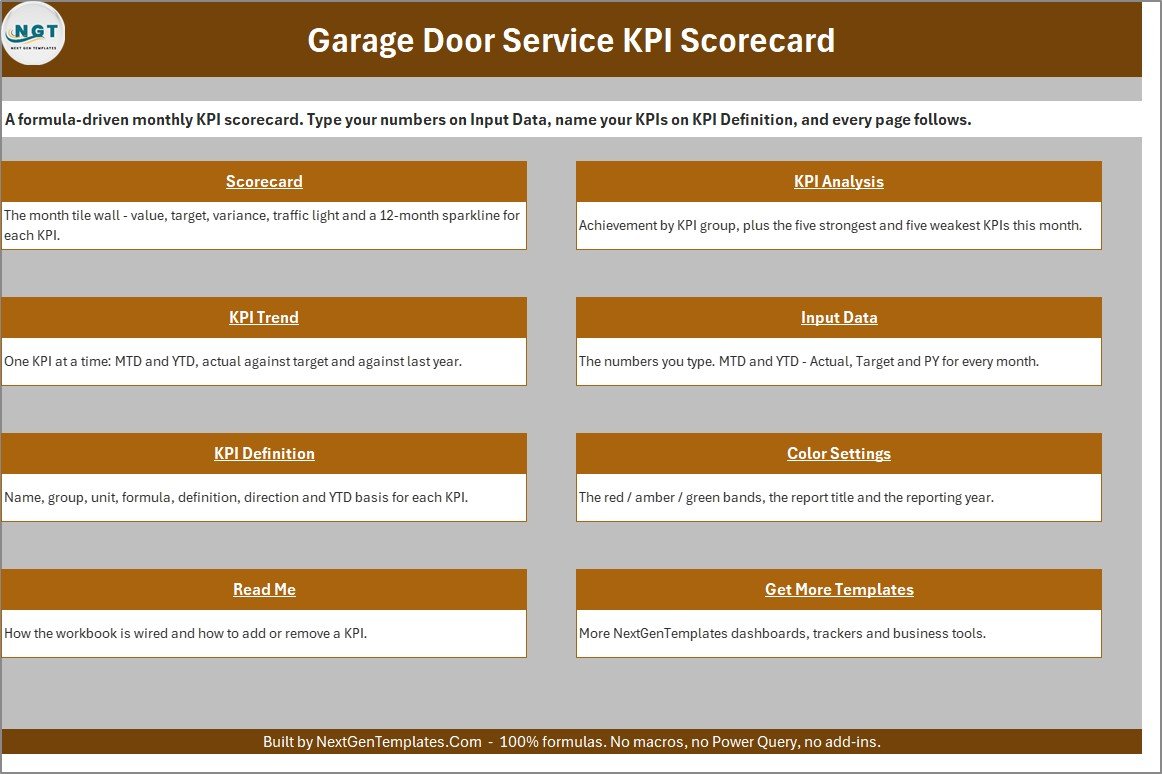
- Home – a navigation page linking all eight working sheets.
- Scorecard – the tile wall. Value, target, change, variance percentage, traffic light and sparkline for ten KPIs at a time.
- KPI Analysis – RAG counts, achievement by group, Top 5 and Bottom 5.
- KPI Trend – single-KPI drill-down with the KPI’s unit, direction, formula and definition shown above the charts.
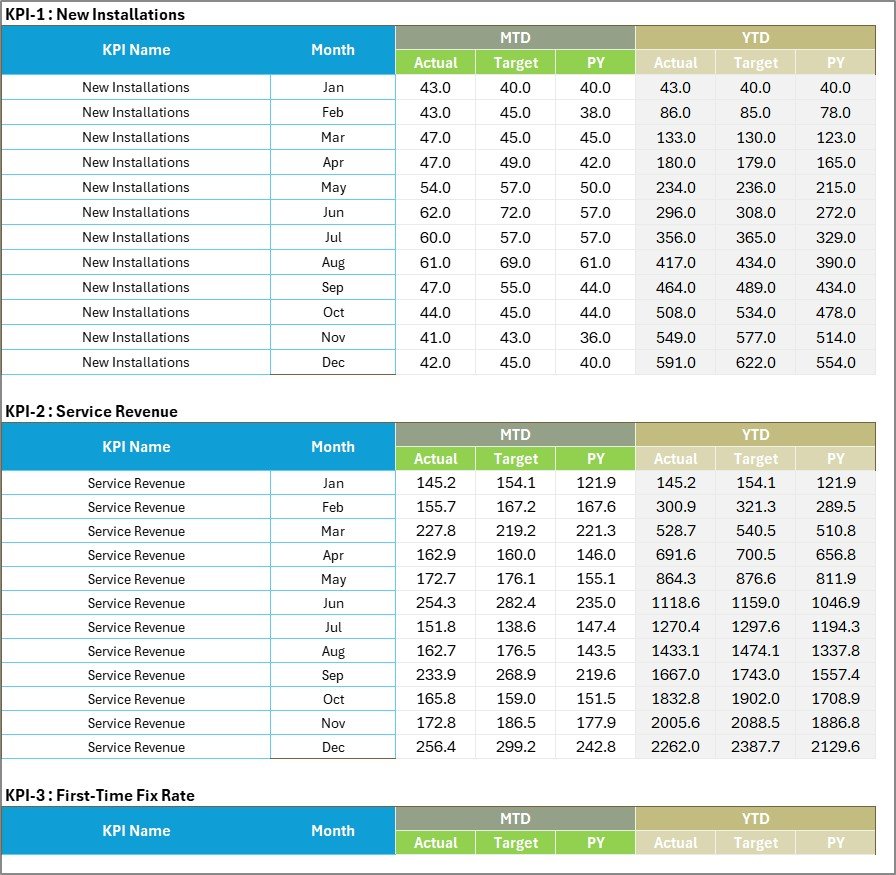
- Input Data – the only sheet of numbers you type: MTD Actual, Target and PY, plus YTD Actual, Target and PY, for all twelve months.
- KPI Definition – name, group, unit, formula, definition, direction and YTD basis, with a duplicate-name checker.
- Color Settings – the RAG bands, the report title and the reporting year.
- Read Me – nine short sections on how the workbook is wired and how to add or remove a KPI.
- Get More Templates – where to find the rest of the catalogue.
Excel Scorecard vs. Google Sheets vs. Paid Field Service Software – Where This Fits
| This Excel Scorecard | Google Sheets Edition | ServiceTitan / Jobber-class software | |
|---|---|---|---|
| Cost | $9.99 once | $8.99 once | $99-$400+ per user / month |
| Platform | Excel 2016 or later, desktop | Browser, any device | Cloud SaaS |
| Setup time | 15-20 minutes | 10 minutes | 2-8 weeks onboarding |
| Real-time team collaboration | Via OneDrive / SharePoint | Yes, native | Yes |
| Mobile access | Excel mobile, read-friendly | Yes | Yes, with a field app |
| Customizable KPIs | Yes – all 20 slots are yours | Yes | Only what the vendor exposes |
| Share with a link | File or OneDrive link | Yes | Yes |
| Year-1 cost at 5 users | $9.99 | $8.99 | $6,000-$24,000 |
| Dispatching and invoicing | No – reporting only | No | Yes |
| Owns your data | You do, offline | You do, in Drive | Vendor-hosted |
Who This Template Is For – and Who It’s Not For
It fits owner-operated and multi-crew garage door companies running 3-30 technicians, service managers who already pull monthly numbers out of a job-management system and want one page to review them on, and franchise or multi-branch operators who need every location reporting the same ten KPIs the same way.
It is not for you if you want live dispatching, invoicing or a technician mobile app – this is a reporting workbook, not an operations platform. It also does not connect to your job system: you type or paste the monthly totals in, and the workbook never recalculates YTD for you, because the correct roll-up differs by KPI. And if you need ten people editing the same file at the same moment, use the Google Sheets edition instead.
How to Use the Garage Door Service KPI Scorecard in Excel
- Unzip the download and open the
.xlsxfile in Excel. Nothing to enable. - Open Color Settings and set your report title and reporting year. The year feeds the month picker.
- On KPI Definition, rename any of the ten KPIs to match your own language, or add new ones on the free rows. Set each one’s unit, direction (UTB / LTB) and YTD basis.
- On Input Data, replace the sample figures in each numbered block with your own MTD and YTD Actual, Target and PY for every month.
- Go to Scorecard, pick your month, and read the wall. Switch MTD / YTD and change the comparison to Target, PY or Prior Month.
- Use KPI Analysis for the group roll-up in your monthly review, and KPI Trend when one KPI needs explaining.
Real-World Use Cases
Marcus, owner of a 9-technician residential garage door company. He reviews the tile wall on the first Monday of the month. In September, New Installations came in at 47 against a target of 55 and Service Revenue at $233.9K against $268.9K – both red – while First-Time Fix Rate, Customer Satisfaction, Technician Utilization and Preventive Maint. Visits were all green. The scorecard told him the problem was demand, not delivery.
Priya, service manager at a commercial door contractor. She watches Avg Response Time and Warranty Callback Rate, both typed LTB. Response time drifting from 2.9 to 3.5 hours shows as a red up-arrow, which is exactly the behaviour she needs from a metric where a bigger number is worse.
Dan, a three-branch franchisee. He keeps one copy of the workbook per branch with the same KPI Definition sheet, then compares the KPI Analysis group percentages side by side at the quarterly meeting.
Frequently Asked Questions
Is this the same as your Garage Door Service KPI Dashboard?
No. This is the KPI Scorecard – a month-picker report card with traffic lights, group achievement and a single-KPI trend page. The KPI Dashboard line is a separate, slicer-driven analytical product with different pages and a different KPI set. Buying one does not give you the other.
Does it contain macros?
No. It is a plain .xlsx: formulas, conditional formatting, camera pictures, sparklines and form controls. Nothing to enable and no security prompt.
Can I add my own KPIs?
Yes. Type the new KPI on the next free row of KPI Definition and fill its numbered block on Input Data. The workbook holds 20 KPIs and the Scorecard shows ten at a time using the KPI 1-10 / 11-20 picker.
Will it calculate year-to-date for me?
No, and that is deliberate. You type the finished YTD figures, because the right roll-up is a sum for volumes and revenue but an average for rates like First-Time Fix Rate. Record the rule you used in the YTD Basis column.
What Excel version do I need?
Excel 2016 or later on Windows or Mac. It also opens in Excel for the web, though the form-control drop-downs behave best on the desktop app.
Can I change the red / amber / green thresholds?
Yes. The two small band tables on Color Settings drive every traffic light, arrow and status word in the workbook.
Is there a Google Sheets version?
Yes – the Garage Door Service KPI Scorecard in Google Sheets is the same report card built natively for Sheets. The two editions are sold separately.
About the Author
Built by PK – Microsoft Certified Professional with 15+ years of Excel, Google Sheets, and Power BI experience. Founder of NextGenTemplates, reaching 300K+ subscribers across YouTube channels. Every template is hand-built and tested before release.
Explore Related Templates
Same scorecard, other trades: Plumbing Business KPI Scorecard in Excel, HVAC Contractor KPI Scorecard in Excel, Electrical Contractor KPI Scorecard in Excel and Septic Tank Service KPI Scorecard in Excel.
Want the analytical, slicer-driven product instead? Look at the HVAC Contractor KPI Dashboard in Excel or the Plumbing Business KPI Dashboard in Excel. Or browse the whole KPI Dashboard category and the MS Excel category.
Add the Garage Door Service KPI Scorecard in Excel to your cart and you will be reporting on September – or any month – within twenty minutes. Instant download, lifetime access, free minor updates. Need it customised to your own KPI list? Email info@nextgentemplates.com.
Last updated: 6 September 2026.