

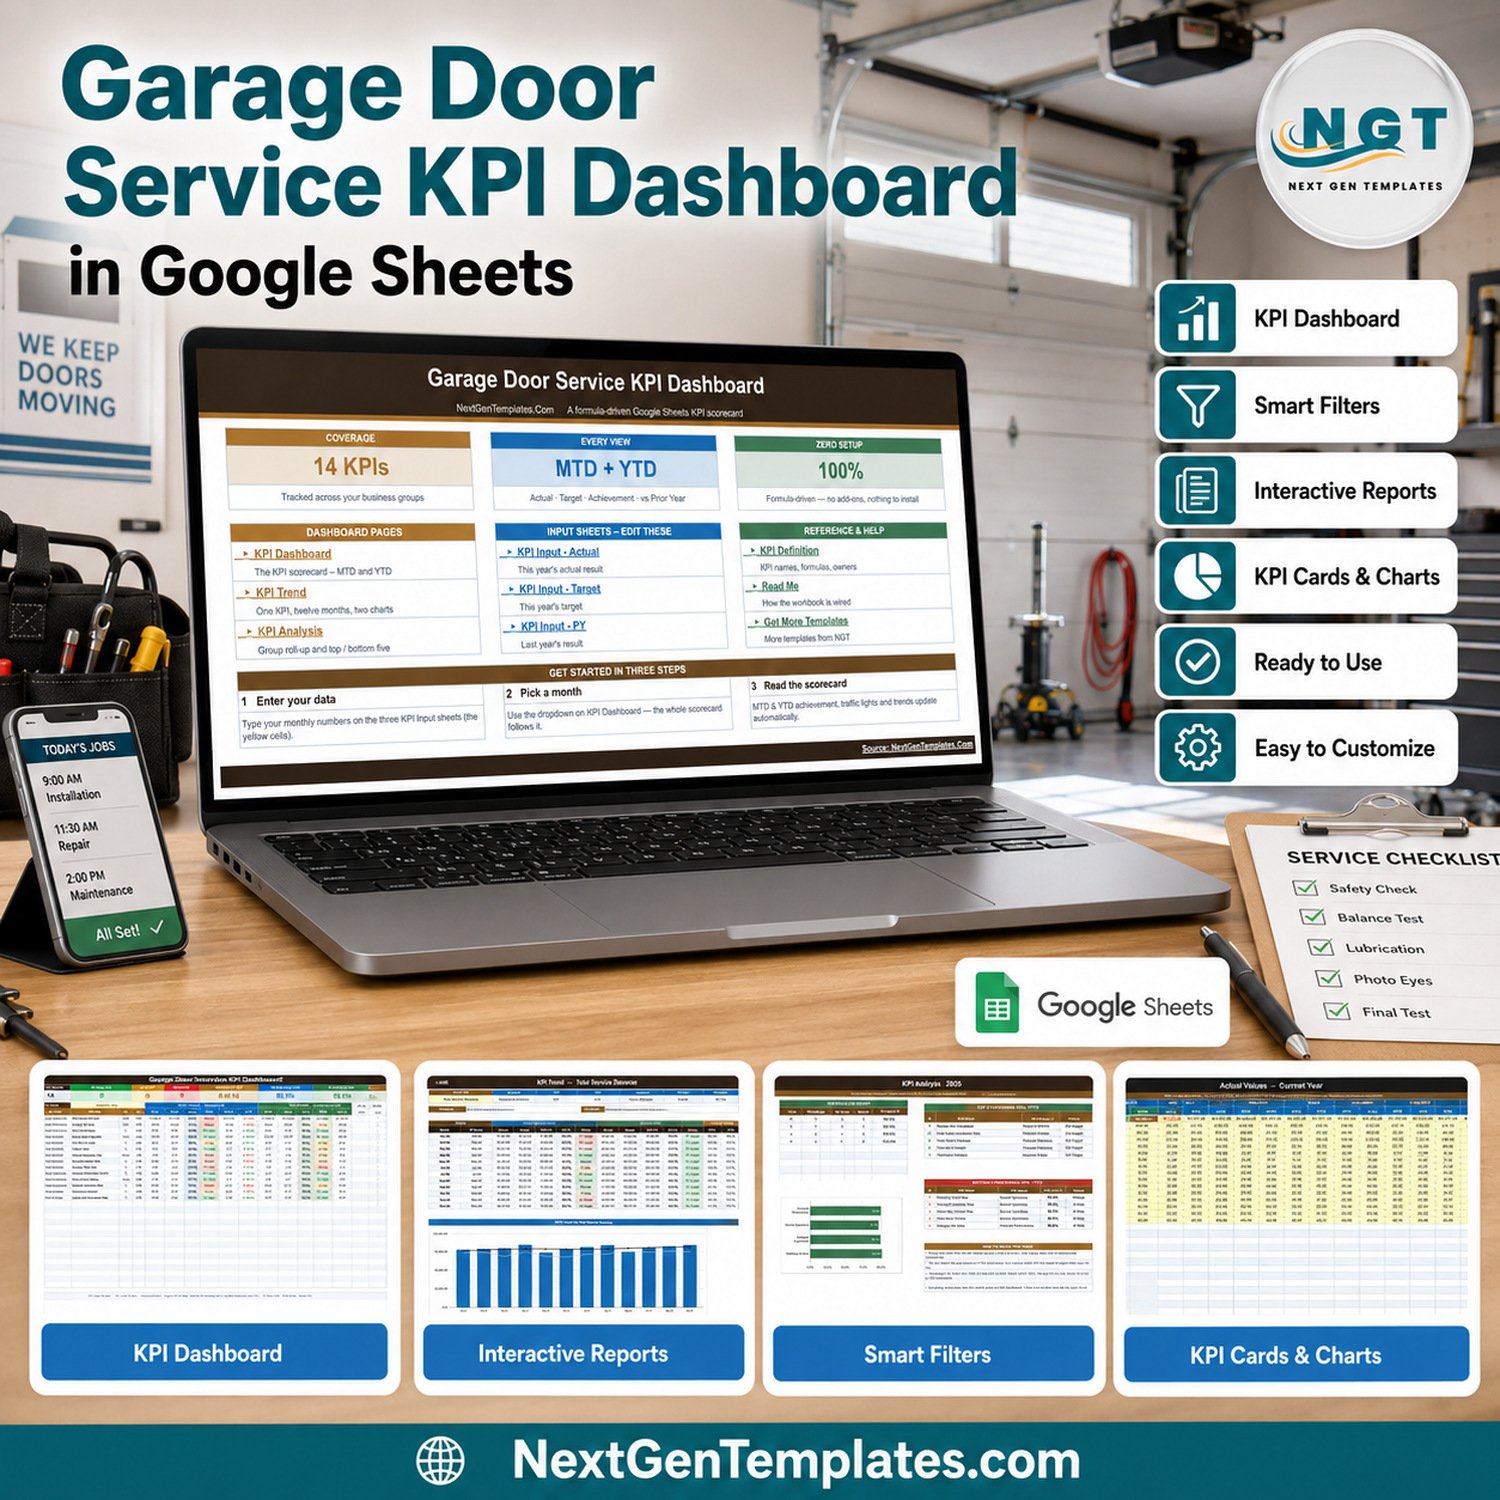

14 garage door service KPIs, 4 business groups, 12 monthly periods, and MTD plus YTD views come together in one formula-driven Google Sheets workbook. The Garage Door Service KPI Dashboard in Google Sheets compares each month’s actuals with target and prior year, ranks the top and bottom five KPIs, and shows red, amber, and green status at a glance. You pay once, receive an editable copy in your own Google Drive, and can read every formula before you rely on it. No add-on, connector, or subscription is required.
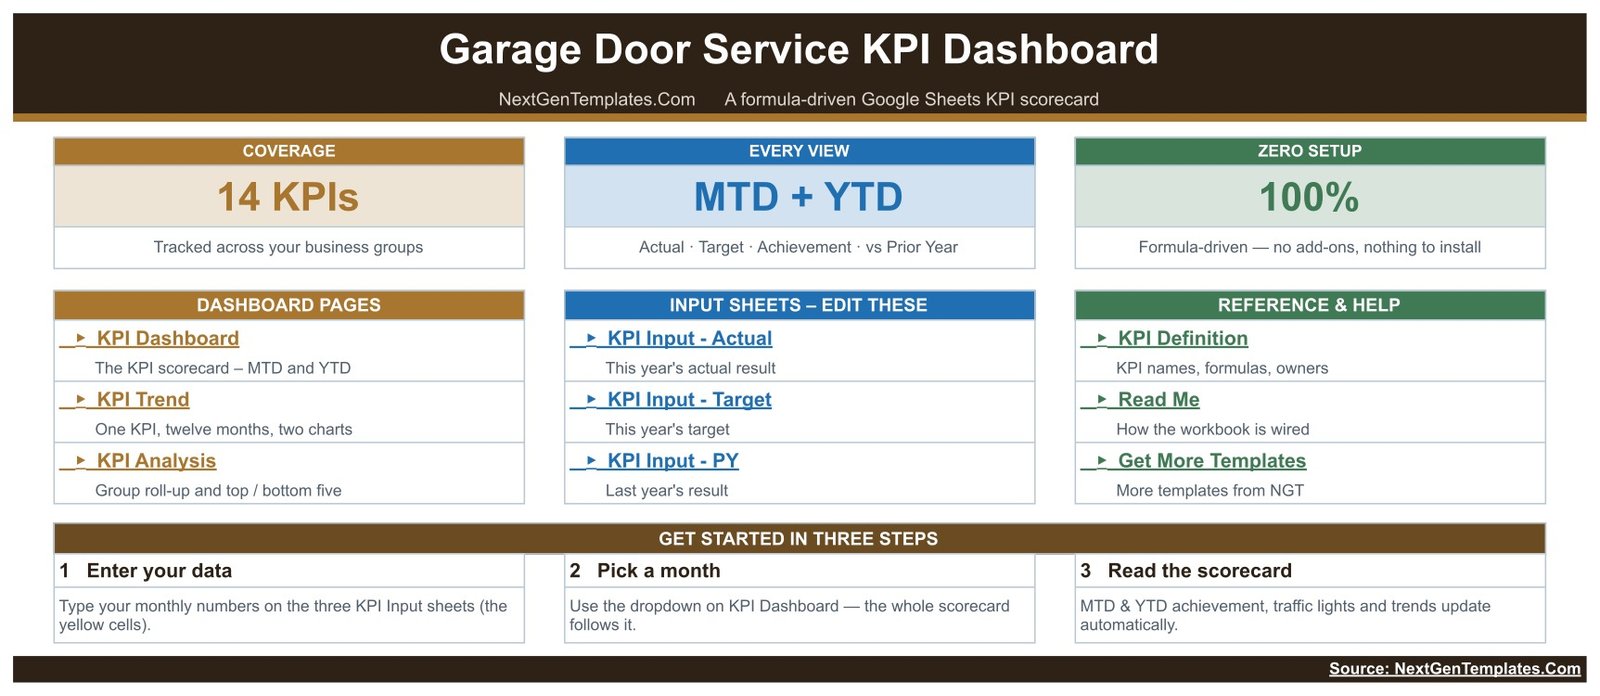
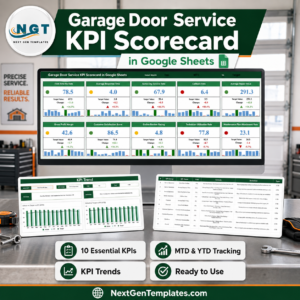
Which template is this? This is the KPI Dashboard family: a 14-row scorecard with a month picker, plus dedicated KPI Trend and KPI Analysis pages and three monthly input sheets. It is not the same product as the published Garage Door Service KPI Scorecard in Google Sheets, which is a separate 10-KPI card-based template for the same trade.
Key Features of Garage Door Service KPI Dashboard in Google Sheets
- 14 garage door service KPIs: revenue and margin, job throughput, response and fix quality, customer experience, and technician and sales productivity.
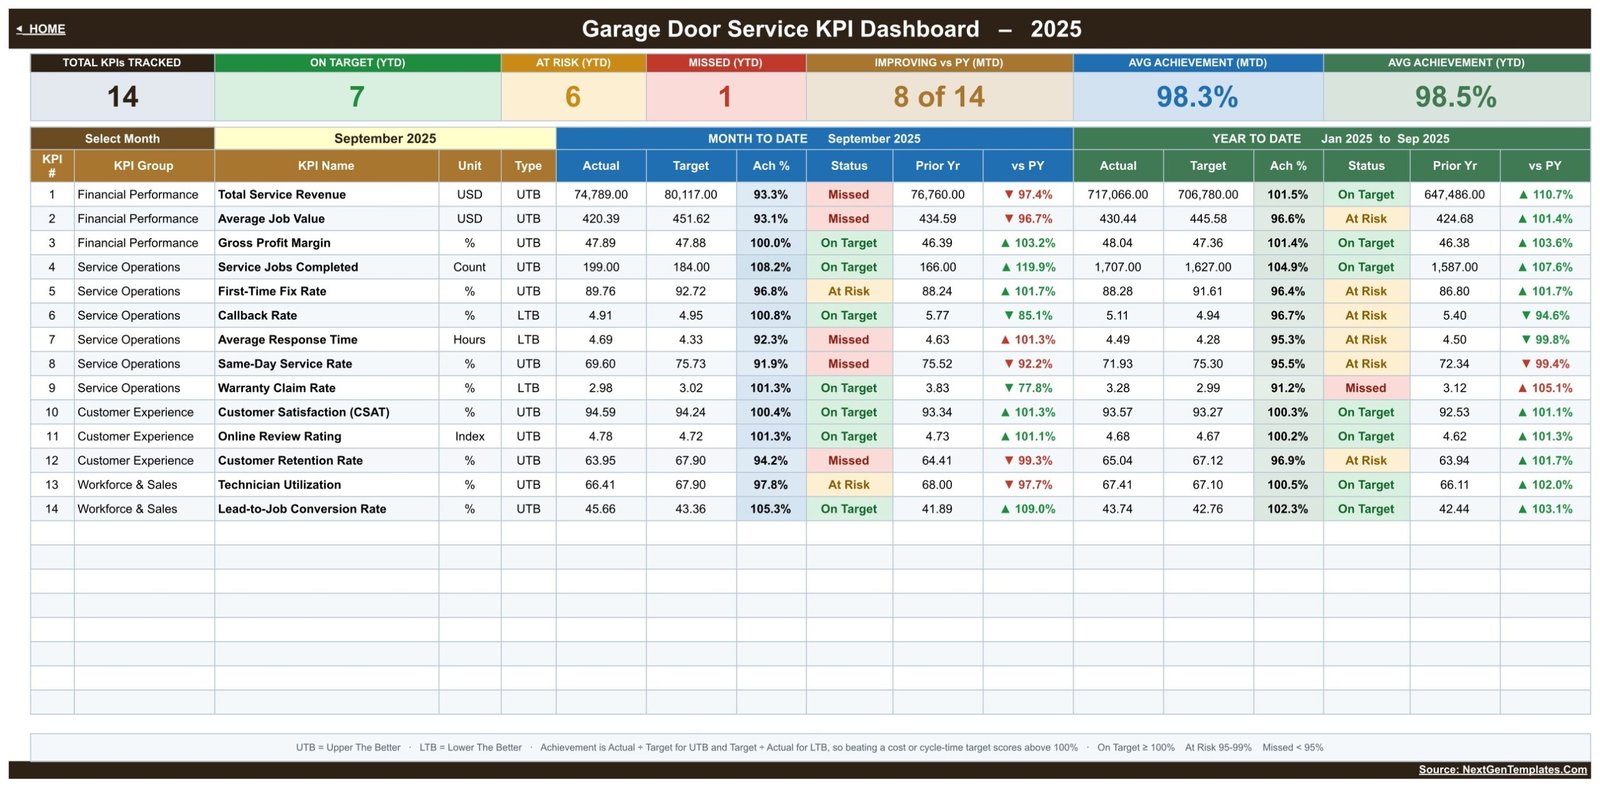
- MTD and YTD side by side: the selected month and the cumulative year appear on the same row, each with actual, target, achievement, status, prior year, and change.
- Direction-aware achievement: 11 KPIs are UTB (upper the better) and 3 are LTB (lower the better) – Callback Rate, Average Response Time, and Warranty Claim Rate. Achievement is Actual / Target for UTB and Target / Actual for LTB, so beating a callback or response-time target scores above 100% instead of reading as a failure.
- Traffic-light thresholds: On Target from 100%, At Risk 95% to 99%, Missed below 95% – and the thresholds live in editable Status formulas, not in a locked script.
- Seven summary cards: KPIs tracked, On Target, At Risk, Missed, improving vs prior year, and average achievement for MTD and YTD.
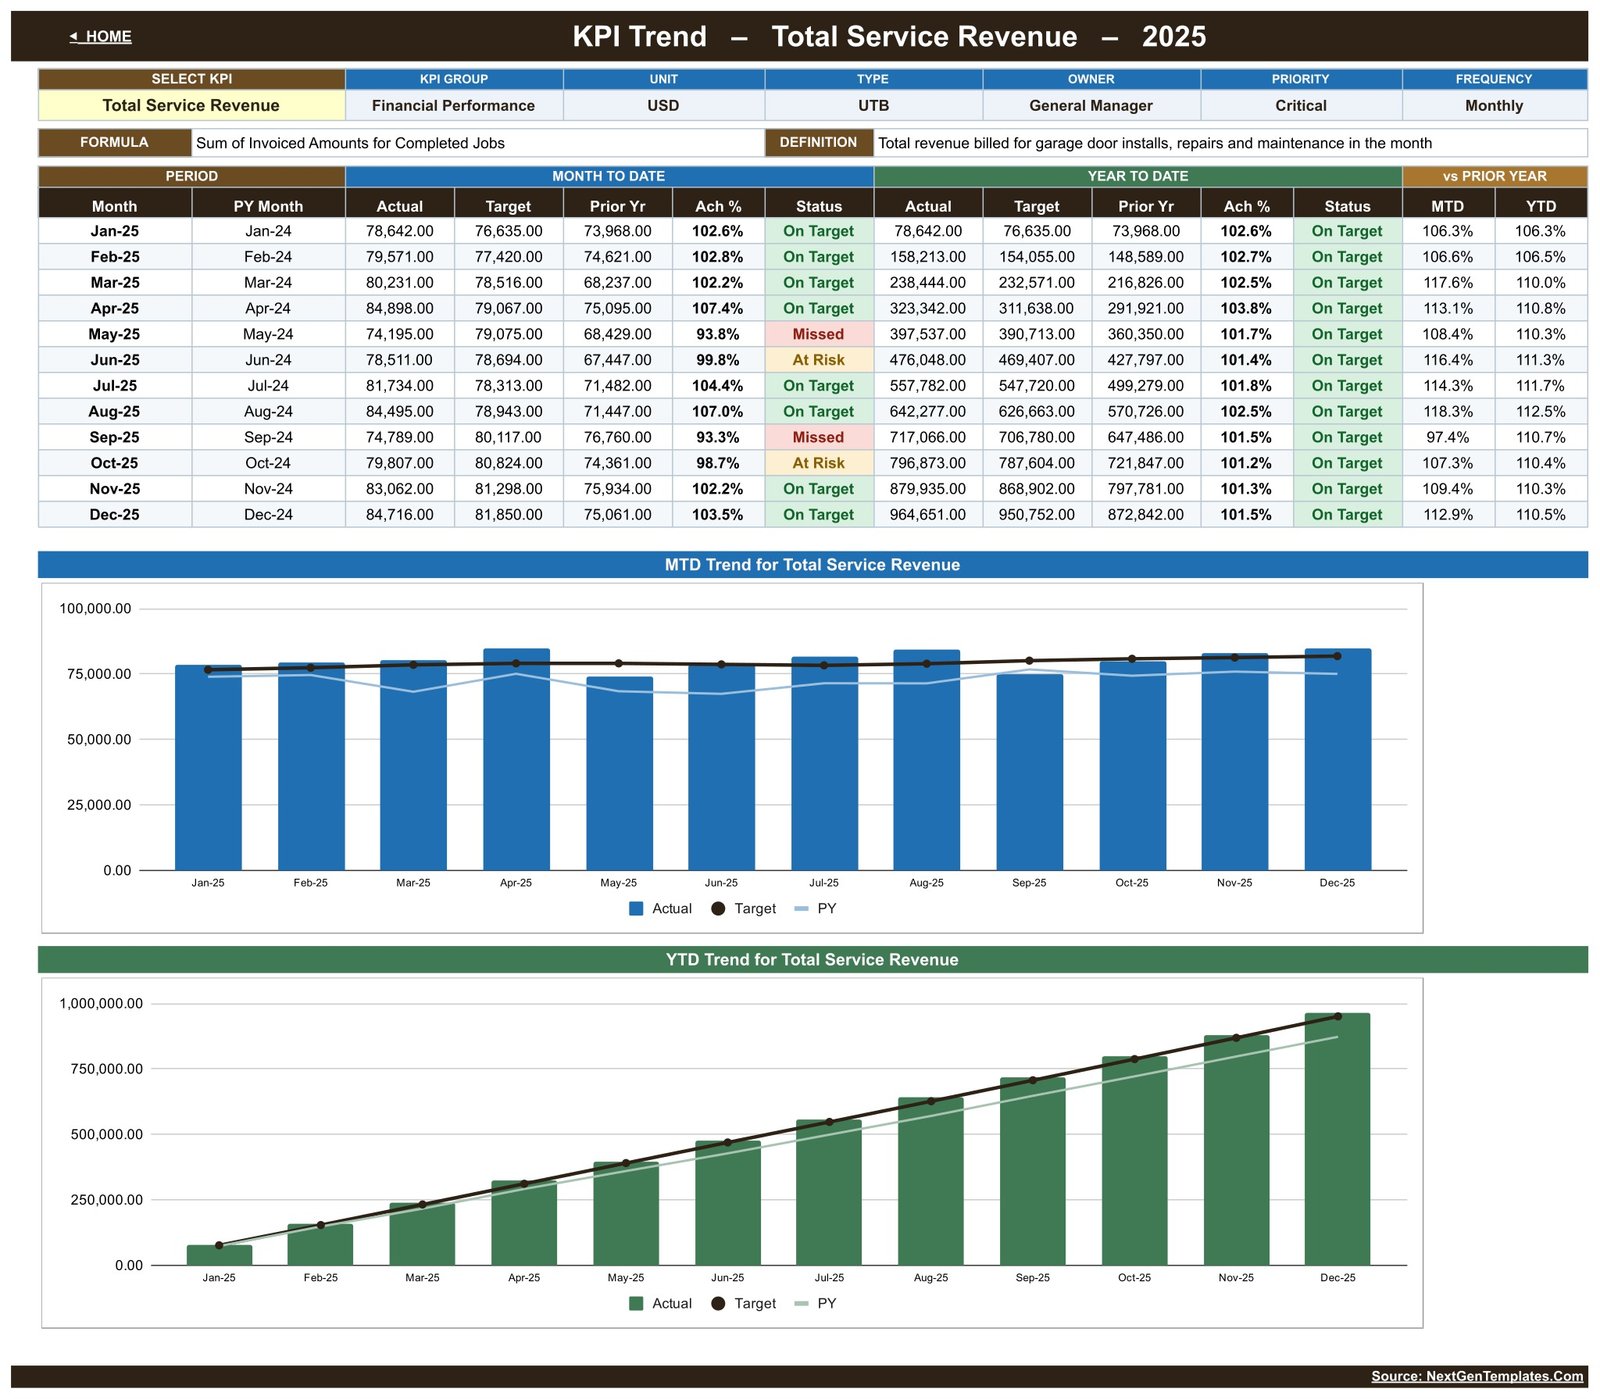
- KPI Trend page: pick one metric and read twelve months of MTD and YTD actual, target, prior year, achievement, and status, with two charts underneath.
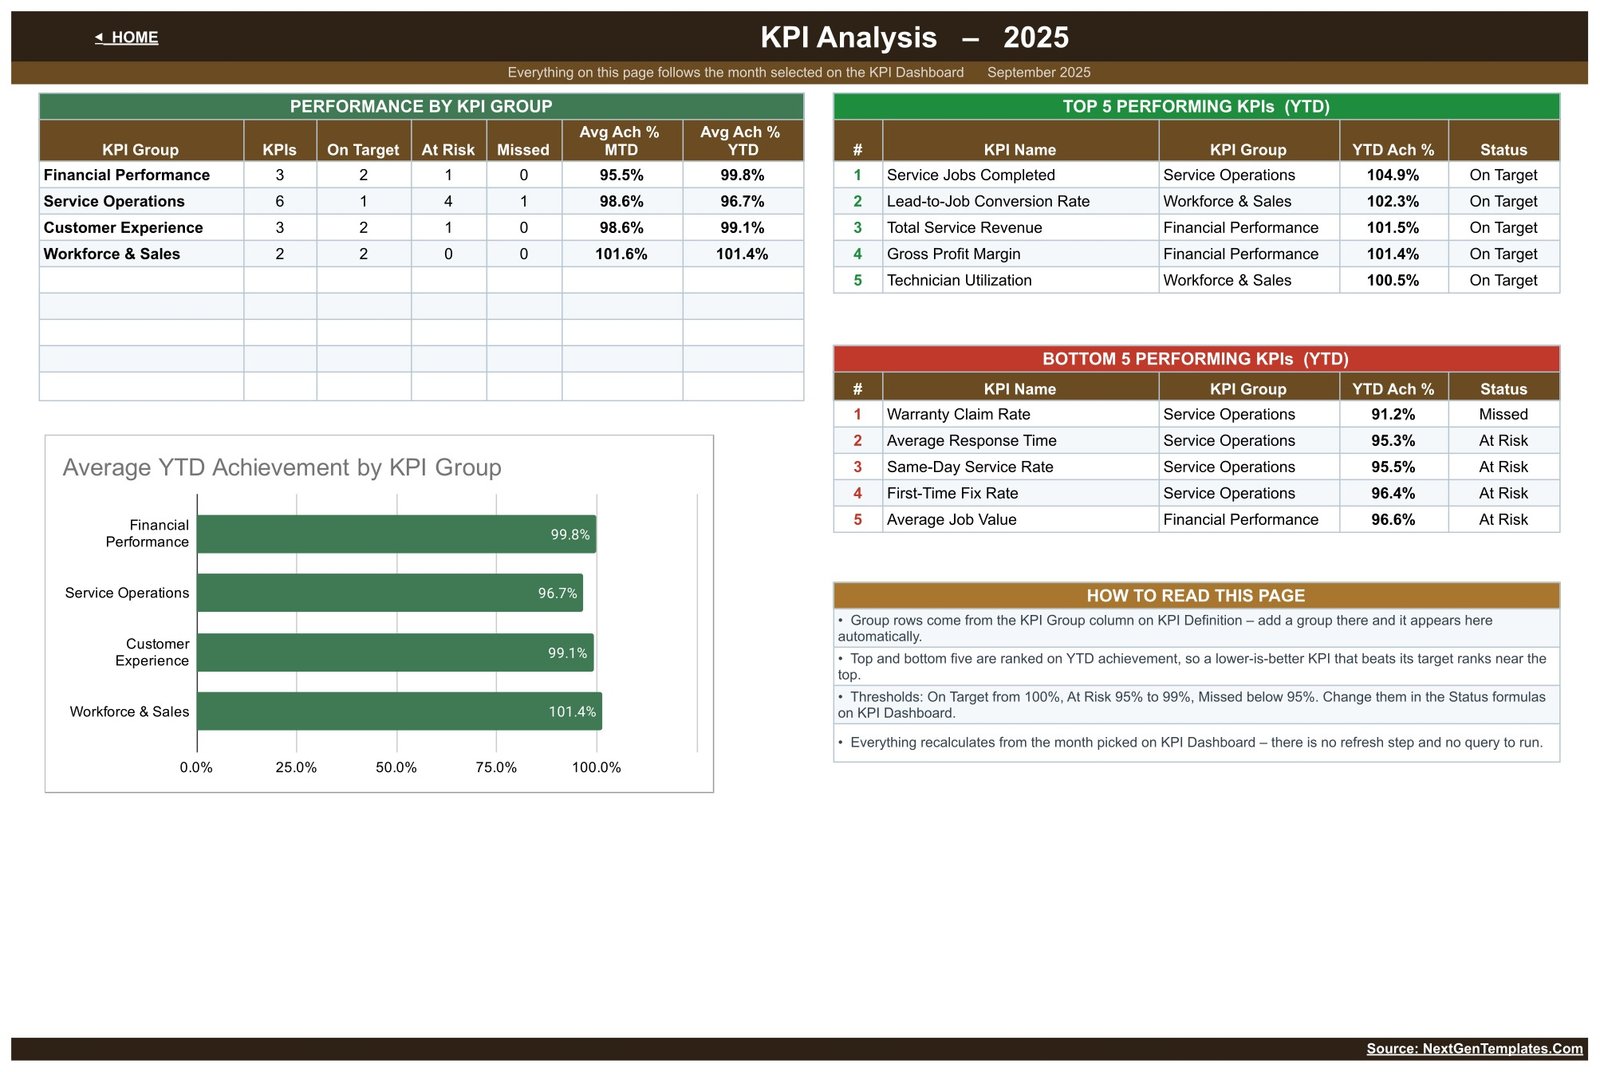
- KPI Analysis page: group roll-ups, an average YTD achievement chart by group, and the top and bottom five KPIs by YTD achievement.
- Editable definition register: every KPI’s group, unit, written formula, plain-language definition, direction, owner, priority, and frequency is a visible cell that other sheets follow automatically.
What’s Inside the Garage Door Service KPI Dashboard in Google Sheets
Home (Read Me): a one-screen index that states the structure before you start – 14 KPIs, MTD plus YTD, three editable input sheets, and formula-driven operation with nothing to install – and links to every other page.
KPI Dashboard: the main scorecard lists all 14 KPIs. The supplied September 2025 sample shows 7 On Target, 6 At Risk, and 1 Missed on YTD, 8 of 14 KPIs improving on prior year, and average achievement of 98.3% MTD and 98.5% YTD. Those are demonstration figures, not garage door industry benchmarks.
KPI Trend: choose a KPI such as Total Service Revenue and review its owner, priority, frequency, written formula, and definition, then twelve rows of MTD and YTD Actual, Target, Prior Year, achievement, and status, followed by an MTD Trend chart and a YTD Trend chart.
KPI Analysis: rolls the register up into its four groups – Financial Performance, Service Operations, Customer Experience, and Workforce & Sales – counts On Target, At Risk, and Missed in each, charts average YTD achievement by group, and ranks the top and bottom five YTD performers. In the sample, Workforce & Sales leads at 101.4% and Service Operations trails at 96.7%.
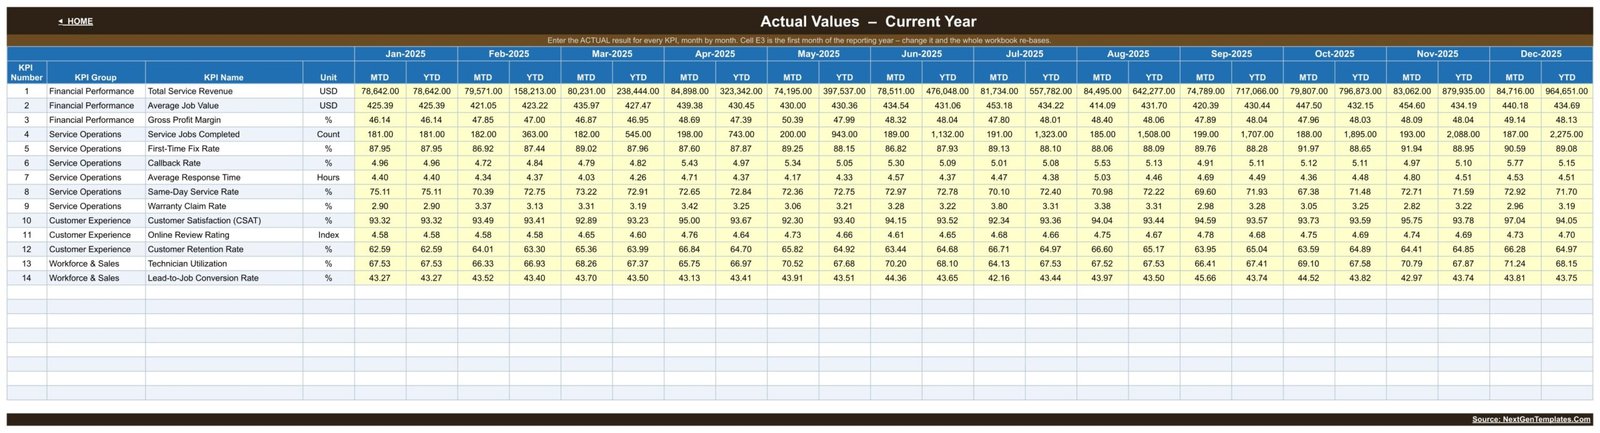
Three input sheets: KPI Input – Actual, KPI Input – Target, and KPI Input – PY each hold the 14 KPIs from January to December with MTD and YTD columns. Type or paste your monthly summaries into the yellow cells and every reporting page recalculates.
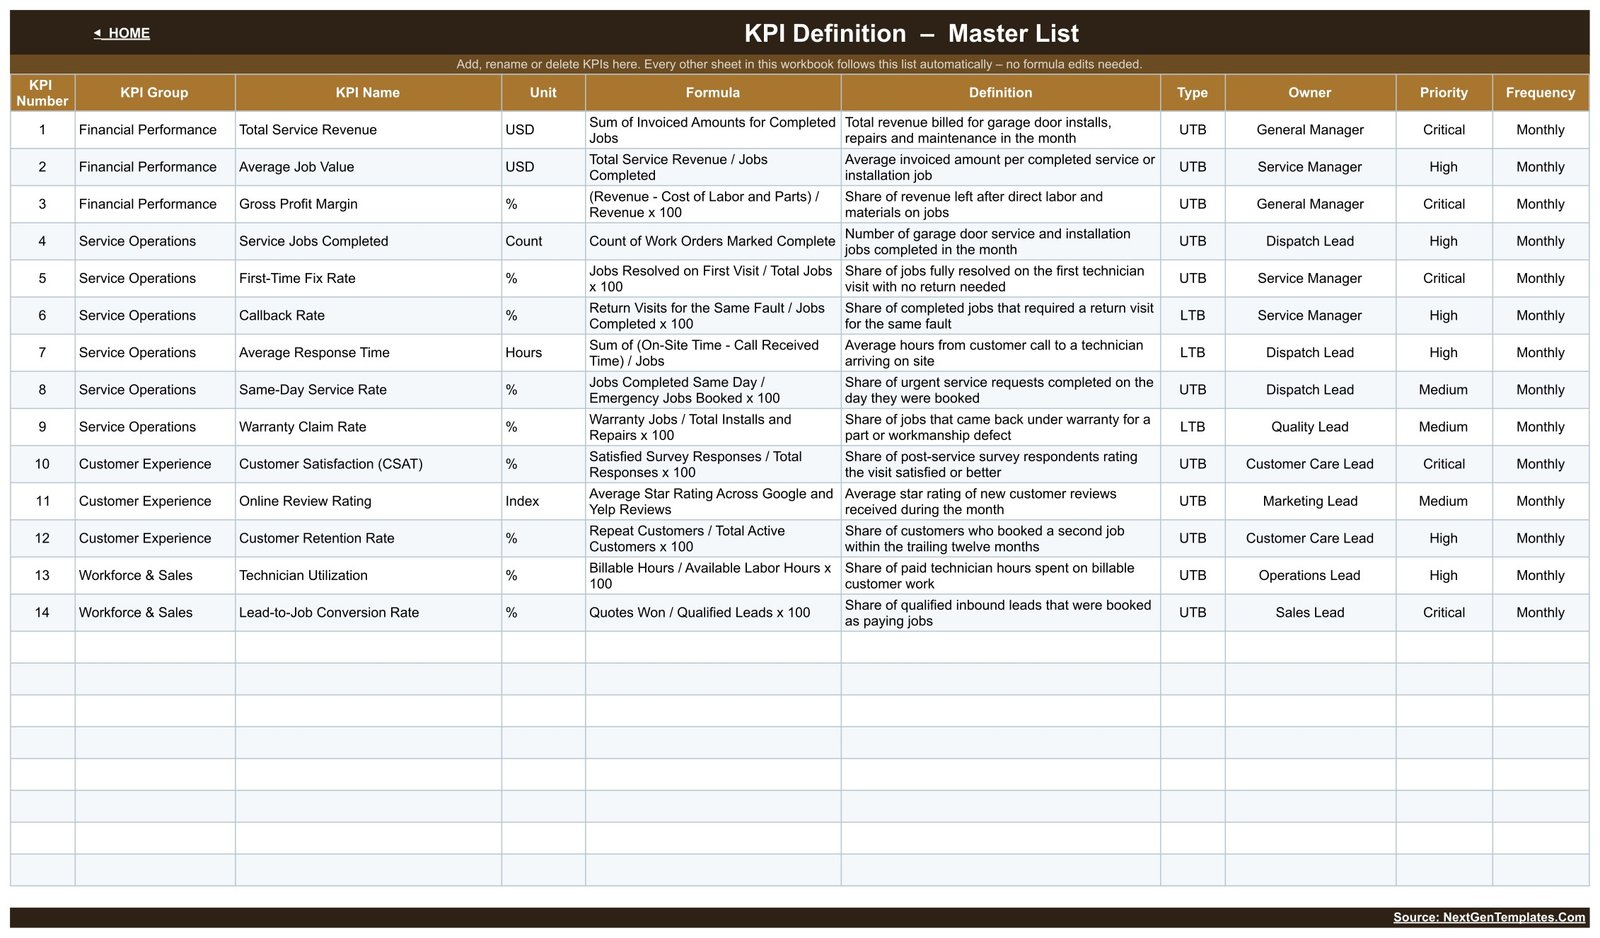
KPI Definition: the master list documents all 14 metrics – Total Service Revenue, Average Job Value, Gross Profit Margin, Service Jobs Completed, First-Time Fix Rate, Callback Rate, Average Response Time, Same-Day Service Rate, Warranty Claim Rate, Customer Satisfaction (CSAT), Online Review Rating, Customer Retention Rate, Technician Utilization, and Lead-to-Job Conversion Rate – each with its formula, definition, UTB/LTB direction, owner, priority, and frequency.
Garage Door Service KPI Dashboard in Google Sheets vs. Excel vs. Paid Field Service SaaS – Where This Fits
| Area | This Google Sheets template | Excel dashboard | Paid field service SaaS |
|---|---|---|---|
| Cost | $8.99 sale price, one time | Template plus Microsoft 365 if needed | Recurring subscription |
| Collaboration | Native browser sharing | Best through OneDrive | Native, normally seat-based |
| Setup | Copy the sheet and replace monthly values | Download and edit locally | Configuration and onboarding |
| Custom KPIs | Editable cells and definitions | Editable workbook | Depends on vendor plan |
| Five-user year-one cost | $8.99 total | Template plus licences | Usually hundreds or more |
| Dispatch, work orders, invoicing | No | No | Usually yes |
| Door, spring, and opener job records | Monthly summary KPIs only | Depends on workbook | May offer job-level records |
Who This Template Is For – and Who It’s Not For
It is built for garage door company owners, service managers, dispatch leads, quality leads, and marketing or sales leads who already produce monthly totals and want one consistent review board. It suits a single-crew installer or a growing multi-van operation that would rather share a Google Sheet than add another per-user subscription. The register even names an owner for each KPI – General Manager, Service Manager, Dispatch Lead, Quality Lead, Customer Care Lead, Marketing Lead, Operations Lead, and Sales Lead – so the monthly meeting has an accountable person per row.
It is not dispatch, routing, CRM, invoicing, inventory, or work-order software. It holds no customer records, no individual job history, no spring or opener part numbers, and no technician timesheets. Warranty Claim Rate and Callback Rate are summary percentages you calculate and enter; the workbook does not store the underlying claims, certify workmanship, or evidence a manufacturer warranty position. Keep those records in the systems your suppliers and insurers require.
How to Use the Garage Door Service KPI Dashboard in Google Sheets
- Open the downloaded PDF and use its Google Sheets link to make your own editable copy.
- Review the KPI Definition page and adapt names, formulas, owners, priorities, and UTB/LTB direction to how your company measures.
- Replace the sample monthly figures on the Actual, Target, and PY input sheets.
- Pick a month from the dropdown on KPI Dashboard and read the MTD and YTD status columns.
- Open KPI Trend for one metric and KPI Analysis for the group roll-up and the top and bottom five.
Real-World Use Cases
Dan, a service manager, reads First-Time Fix Rate, Callback Rate, and Warranty Claim Rate together before deciding whether a recurring spring or opener fault is a training issue or a parts issue.
Priya, a dispatch lead, watches Average Response Time and Same-Day Service Rate against Service Jobs Completed to judge whether the next van pays for itself.
Marcus, an owner, compares Gross Profit Margin, Average Job Value, Lead-to-Job Conversion Rate, and Technician Utilization before changing pricing or hiring plans for the next quarter.
Frequently Asked Questions
Is this the KPI Dashboard or the KPI Scorecard?
This is the 14-KPI Dashboard, with a month picker, separate KPI Trend and KPI Analysis pages, and three monthly input sheets. The Garage Door Service KPI Scorecard in Google Sheets is a separate 10-KPI card-based template for the same trade, not a duplicate of this one.
Do I need a paid Google Workspace account?
No. A free Google account can make, edit, and share a copy.
Can I replace the supplied KPIs?
Yes. The KPI Definition register is editable and every other sheet follows it. Keep the KPI names aligned across the definition and the three input tables so the lookups keep matching.
Does it connect to my scheduling, invoicing, or accounting software?
No. Monthly values are entered by hand. There is no API, add-on, connector, or automatic import, and there is no refresh step to run.
Are the sample numbers garage door industry benchmarks?
No. Every figure in the workbook – including the 98.5% average YTD achievement and the September 2025 statuses – is sample data supplied to demonstrate the formulas and layouts.
Does it track individual jobs, vans, or technicians?
No. The grain is one company-level value per KPI per month. It does not drill into a job, an address, a van, or a technician.
Can several people collaborate?
Yes. Use normal Google Sheets sharing permissions and give edit access only to the people who maintain the inputs.
About the Author
Built by PK – Microsoft Certified Professional with 15+ years of Excel, Google Sheets, and Power BI experience. Founder of NextGenTemplates, reaching 300K+ subscribers across YouTube channels. Every template is hand-built and tested before release.
Explore Related Templates
- Garage Door Service KPI Scorecard in Google Sheets – the compact 10-KPI companion for the same trade.
- Swimming Pool Service KPI Dashboard in Google Sheets – the same dashboard structure for a route-service business.
- Septic Tank Service KPI Dashboard in Google Sheets – another field-service dashboard in this family.
- Locksmith Business KPI Scorecard in Google Sheets – a published trade-service scorecard.
- Browse the Google Sheets KPI Dashboard category.
New to the lookup formulas behind a workbook like this? Google’s own VLOOKUP documentation explains how the definition register drives every other page, and there are step-by-step walkthroughs on PK An Excel Expert on YouTube.
Turn last month’s garage door service totals into a review your team can repeat. Get the Garage Door Service KPI Dashboard in Google Sheets for a one-time $8.99 sale price.
Watch the step-by-step video Demo:
Last updated: September 6, 2026.
Compatibility and Requirements
- Works in Google Sheets. You need a free Google account and a web browser.
- You pick the month from a dropdown on the KPI Dashboard sheet and the KPI on the KPI Trend sheet. Google explains dropdowns in Create an in-cell dropdown list.

































Reviews
There are no reviews yet.