


Freight forwarding operations become more complex every year. Logistics teams manage multiple shipment modes, carriers, origin and destination countries, incoterms, shipment statuses, and monthly volumes. When this data stays scattered across multiple spreadsheets and manual reports, teams struggle to track profitability, control costs, and monitor delivery efficiency. That is exactly why a Freight Forwarding Dashboard in Excel becomes a powerful and practical solution.
This ready-to-use Excel dashboard transforms raw freight data into clear, visual, and decision-ready insights. Instead of spending hours compiling reports, logistics managers, freight forwarders, and finance teams can monitor performance instantly from a single Excel file. As a result, decision-making becomes faster, more accurate, and more confident.
Because the dashboard is built entirely in Excel, it fits naturally into existing logistics workflows. Users only need to update the Data Sheet, and all KPIs, charts, and visuals refresh automatically. Therefore, you gain professional-grade reporting without investing in complex BI tools or additional software.
The Freight Forwarding Dashboard in Excel is designed for real-world logistics analysis. It highlights profit, cost, revenue, margins, shipment status, carrier performance, and trends over time. Moreover, interactive slicers allow users to filter insights by shipment mode, carrier, origin country, destination country, incoterm, or month—without writing formulas.
🔑 Key Features of Freight Forwarding Dashboard in Excel
📊 Centralized Freight Performance Tracking – View shipment, cost, revenue, and profit data in one place
🚢 Shipment Mode Analysis – Compare air, sea, and road performance instantly
🌍 Route & Country Insights – Track origin and destination profitability
🤝 Carrier Performance Evaluation – Identify high-performing and cost-heavy carriers
📈 Monthly Trend Analysis – Spot seasonality and performance changes
🎛️ Interactive Excel Slicers – Filter insights dynamically without complexity
⚡ Fully Automated Reporting – Update data once and refresh all visuals
📂 What’s Inside the Freight Forwarding Dashboard in Excel
This professionally structured dashboard includes five analytical pages, each designed for a specific logistics question:
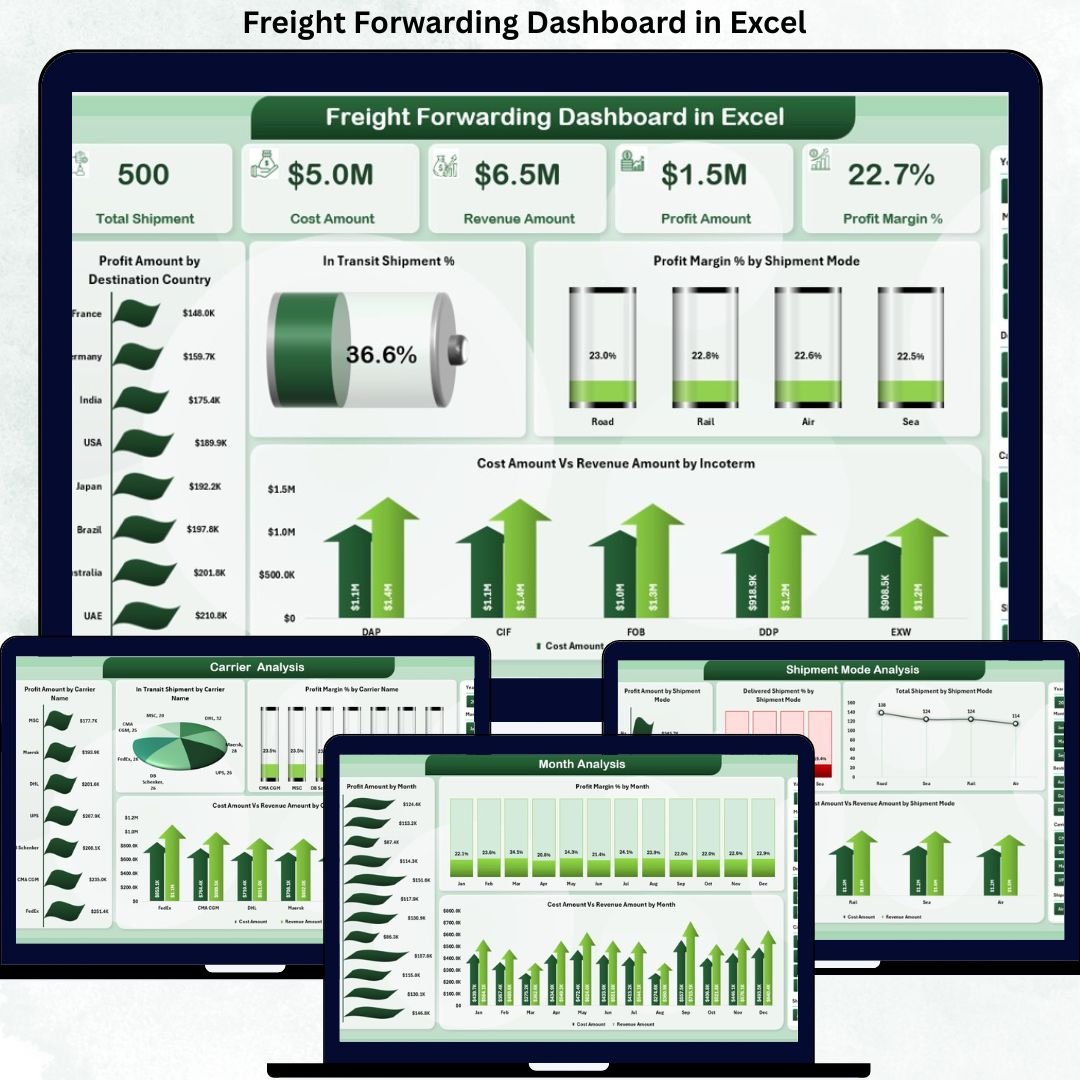
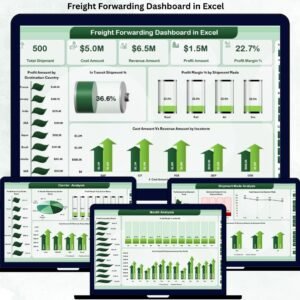
📊 Overview Page – High-level freight performance snapshot
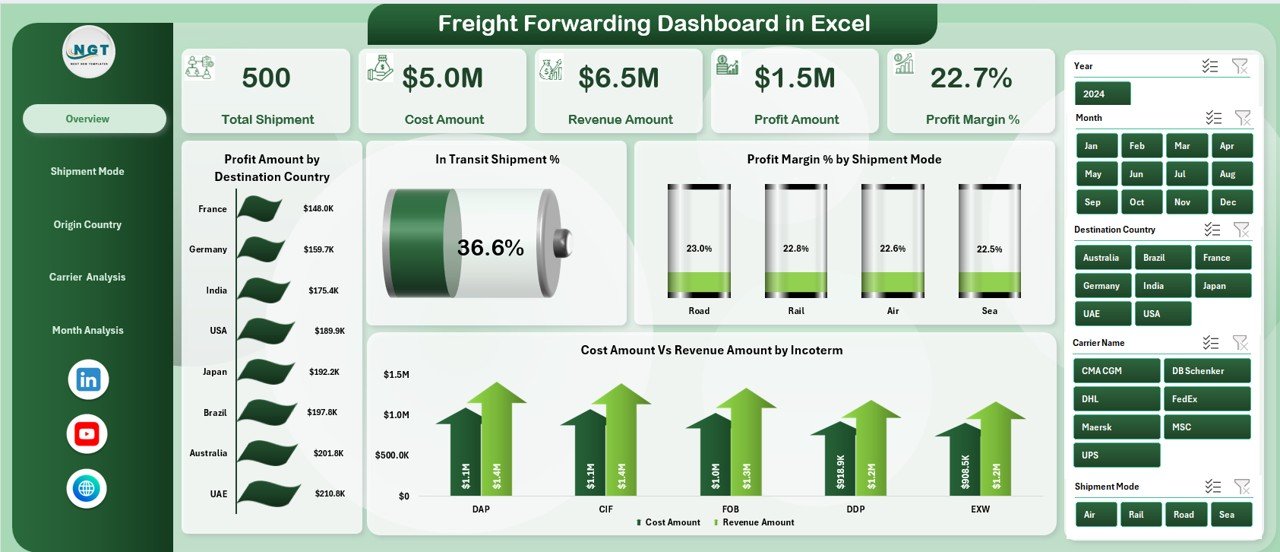
Profit Amount by Destination Country
In-Transit Shipment %
Profit Margin % by Shipment Mode
Cost Amount vs Revenue Amount by Incoterm
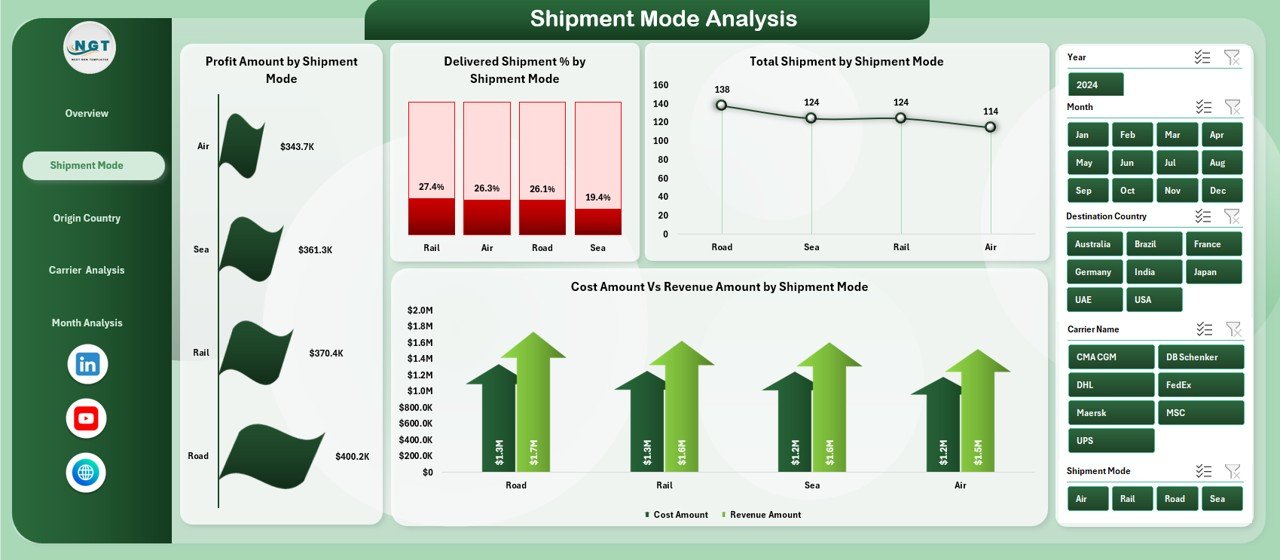
🚢 Shipment Mode Analysis Page – Mode-wise efficiency and profitability
Profit Amount by Shipment Mode
Delivered Shipment % by Shipment Mode
Total Shipment by Shipment Mode
Cost Amount vs Revenue Amount by Shipment Mode
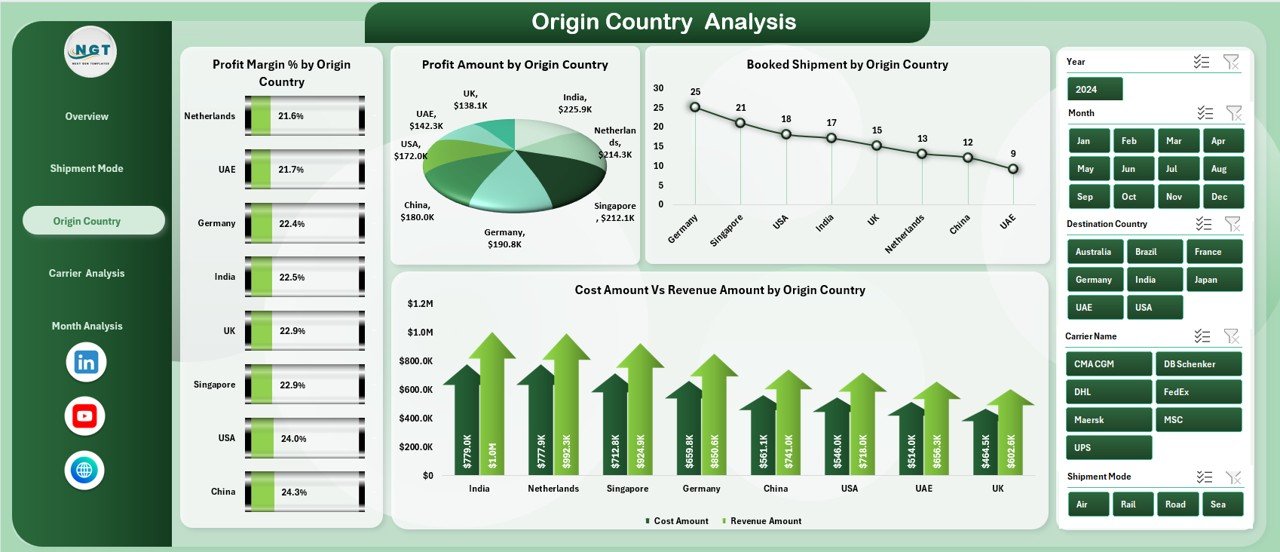
🌍 Origin Country Analysis Page – Regional sourcing performance
Profit Margin % by Origin Country
Profit Amount by Origin Country
Booked Shipment by Origin Country
Cost Amount vs Revenue Amount by Origin Country
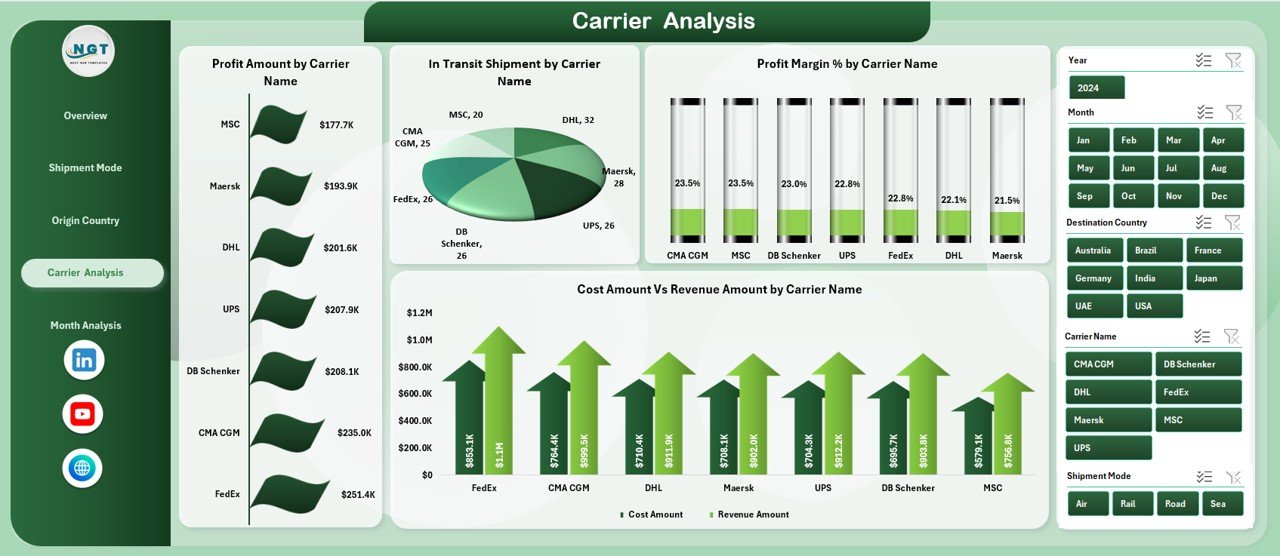
🤝 Carrier Analysis Page – Logistics partner evaluation
Profit Amount by Carrier Name
In-Transit Shipment by Carrier Name
Profit Margin % by Carrier Name
Cost Amount vs Revenue Amount by Carrier Name
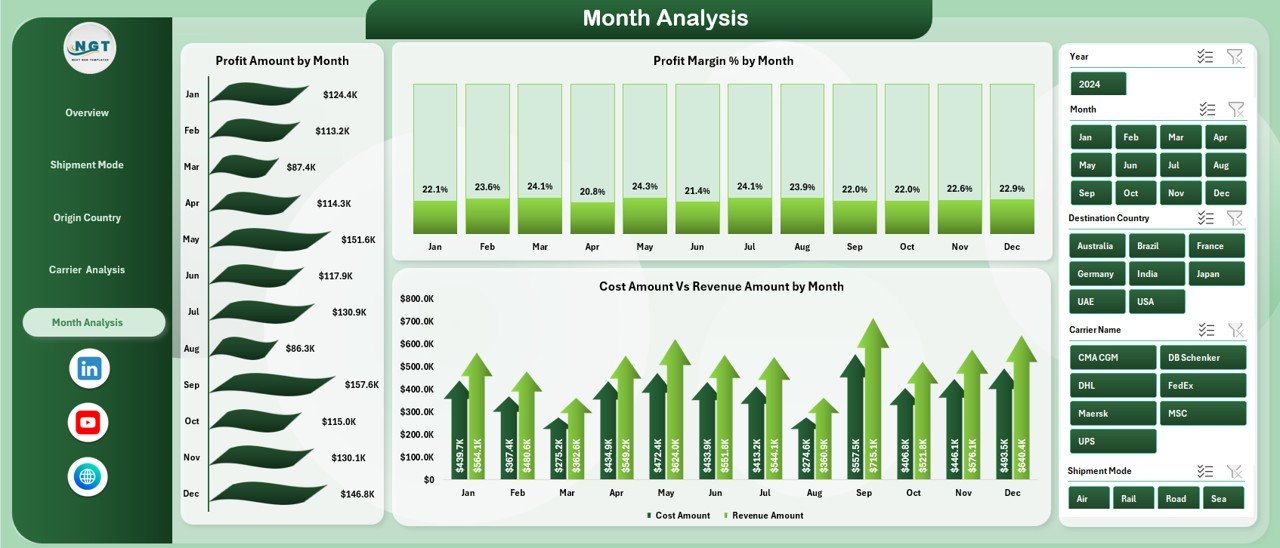
📅 Month Analysis Page – Time-based performance trends
Profit Amount by Month
Profit Margin % by Month
Cost Amount vs Revenue Amount by Month
Each page includes right-side slicers for fast, focused analysis.
▶️ How to Use the Freight Forwarding Dashboard in Excel
1️⃣ Enter or paste shipment data into the Data Sheet
2️⃣ Refresh the Excel file to update all KPIs and charts
3️⃣ Use slicers to filter by carrier, mode, country, incoterm, or month
4️⃣ Review profit, cost, and shipment efficiency
5️⃣ Use insights to optimize routes, carriers, and shipment strategies
No advanced Excel skills are required.
👥 Who Can Benefit from This Freight Forwarding Dashboard in Excel
This dashboard is ideal for:
🚢 Freight Forwarders
📦 Logistics & Operations Managers
📊 Supply Chain Analysts
💰 Finance & Cost Control Teams
🌍 Export-Import Professionals
🏢 3PL & Logistics Service Providers
### 👉 Click here to read the Detailed Blog Post
Visit our YouTube channel to learn step-by-step video tutorials.
Watch the step-by-step video tutorial:
Compatibility and Requirements
- Works in Microsoft Excel desktop (Excel 2016 or later, or Microsoft 365).
- Each page has slicers on the right. Microsoft explains them in Use slicers to filter data.
Frequently Asked Questions
Which pages are in the dashboard?
Five pages: Overview, Shipment Mode Analysis, Origin Country Analysis, Carrier Analysis and Month Analysis.
How can I filter the results?
Use the slicers to filter by shipment mode, carrier, origin country, destination country, incoterm or month.
Where do I enter shipment data?
Enter or paste it into the Data Sheet, then refresh the file. All KPIs and charts update.
What does the Overview page show?
Profit by destination country, in-transit shipment %, profit margin % by shipment mode and cost vs revenue by incoterm.
How does it compare carriers?
The Carrier Analysis page shows profit, in-transit shipments, profit margin % and cost vs revenue for each carrier.
Related Freight and Logistics Templates
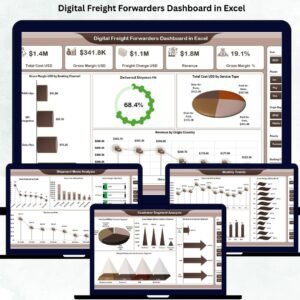
- Digital Freight Forwarders Dashboard in Power BI: freight forwarding analysis in Power BI
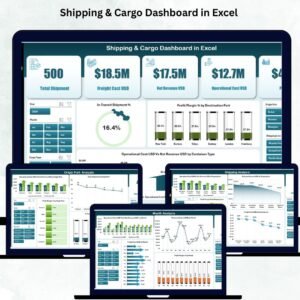
- Shipping & Cargo Dashboard in Excel: cargo volumes and shipment costs
- Freight Cost KPI Dashboard in Excel: freight cost KPIs against targets
- Transportation & Logistics Dashboard in Excel: fleet and delivery performance
- Logistics and Transportation Hub: 7 logistics templates in one download
Browse all Excel dashboards or the Excel logistics templates.
























Reviews
There are no reviews yet.