


The Freight Cost KPI Dashboard in Excel is an essential tool for logistics managers, supply chain professionals, and business owners who need to track, analyze, and optimize freight costs. This Excel-based dashboard allows you to monitor key performance indicators (KPIs) related to shipping and logistics, including total freight costs, cost per shipment, fuel surcharges, and delivery times, to help you improve cost efficiency and optimize your supply chain operations.
With real-time tracking, customizable reports, and interactive charts, this dashboard provides valuable insights into your freight spending and allows you to identify areas where you can reduce costs, improve delivery efficiency, and streamline operations.

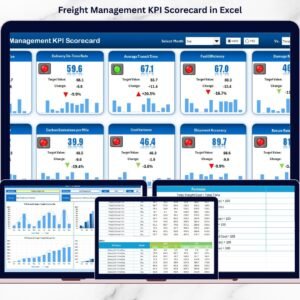
Key Features of the Freight Cost KPI Dashboard in Excel:
📦 Freight Cost Tracking
Track the total cost of shipments, including freight charges, fuel surcharges, customs fees, and other associated shipping costs, to ensure your operations remain cost-efficient.
💰 Cost Per Shipment Analysis
Monitor the average cost per shipment, helping you evaluate shipping cost efficiency across different delivery methods, suppliers, or regions.
📈 Delivery Time Monitoring
Track the average delivery time for shipments, allowing you to identify delays, optimize routes, and ensure timely deliveries.
🚚 Shipping Mode and Carrier Comparison
Analyze the performance of different shipping methods and carriers to determine the most cost-effective and efficient options for your business.
💡 Freight Spend Breakdown
Break down your freight spending by region, shipment type, carrier, or other categories, giving you a clear view of where your money is being spent.
🚀 Why You’ll Love the Freight Cost KPI Dashboard in Excel:
✅ Monitor Freight Costs – Track the total cost of shipping, including all freight-related charges, to ensure that your business remains within budget and cost-effective.
✅ Optimize Shipping Efficiency – Use delivery time metrics and cost per shipment data to optimize your shipping methods and delivery processes.
✅ Evaluate Carrier Performance – Compare the performance of different carriers to identify the most cost-effective shipping options.
✅ Track Cost Trends – Use real-time data and visualizations to track trends in freight costs and identify opportunities to reduce shipping expenses.
✅ Customizable and User-Friendly – This Excel dashboard is simple to use, and you can customize it to suit your specific freight cost tracking needs.
✅ Make Informed Decisions – Use the insights provided by the dashboard to make data-driven decisions that improve your logistics operations and reduce costs.
What’s Inside the Freight Cost KPI Dashboard in Excel:
- Freight Cost Tracking: Track the total freight costs for each shipment, including shipping, fuel surcharges, customs fees, and any other charges.
- Cost Per Shipment Analysis: Monitor the average cost per shipment and evaluate shipping efficiency across different regions or carriers.
- Delivery Time Metrics: Track the average delivery time for shipments to ensure timely deliveries and identify areas for improvement.
- Carrier and Shipping Mode Comparison: Analyze the cost-effectiveness of different shipping carriers and modes to determine the best options for your business.
- Freight Spend Breakdown: Break down freight costs by category, such as region, shipment type, and carrier, to identify cost-saving opportunities.
- Custom Reports: Generate customized reports that summarize freight cost data, providing stakeholders with clear insights into shipping expenses.
How to Use the Freight Cost KPI Dashboard in Excel:
1️⃣ Download the Template – Instantly access your Excel file upon purchase.
2️⃣ Input Freight Data – Enter data such as shipping costs, delivery times, carrier information, and shipment details into the dashboard.
3️⃣ Track Key Metrics – Monitor important KPIs such as total freight costs, cost per shipment, and delivery times in real-time.
4️⃣ Analyze Performance – Use charts and graphs to analyze cost efficiency, shipping trends, and carrier performance.
5️⃣ Generate Reports – Create customized reports to communicate your freight cost performance to stakeholders or management.
Who Can Benefit from the Freight Cost KPI Dashboard in Excel:
- Logistics Managers
- Supply Chain Professionals
- Shipping Coordinators
- E-commerce Businesses
- Freight Forwarders
- Warehouse Managers
- Operations Managers
- Business Owners
The Freight Cost KPI Dashboard in Excel is an indispensable tool for anyone managing freight costs and logistics operations. It helps you monitor shipping costs, improve delivery efficiency, and reduce expenses, ensuring that your supply chain operates smoothly and profitably.
Click here to read the Detailed blog post
https://www.pk-anexcelexpert.com/freight-cost-kpi-dashboard-in-excel/
Visit our YouTube channel to learn step-by-step video tutorials
Youtube.com/@PKAnExcelExpert


Reviews
There are no reviews yet.