



Happy employees are the foundation of a thriving, sustainable organization. With the Environmental and Sustainability Employee Satisfaction KPI Dashboard in Excel, you can now monitor and improve employee well-being while staying aligned with your green and ethical goals. 💚📊
This all-in-one dashboard helps HR leaders, sustainability teams, and executives track key employee satisfaction metrics in the context of environmental responsibility. From engagement to eco-friendly behaviors, you’ll gain real-time visibility and actionable insights.
🛠️ Key Features of Environmental and Sustainability Employee Satisfaction KPI Dashboard
🏠 Home Sheet – Quick Navigation Made Easy

🖱️ One-click access to all 6 major sheets
Acts as your central dashboard hub
Simple and intuitive for first-time users
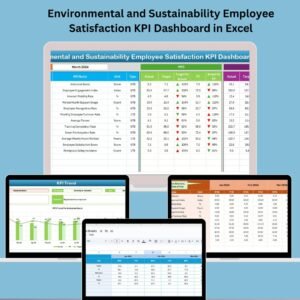
📊 Dashboard Sheet – View Real-Time Performance
📅 Select a Month (D3) to view metrics
📈 Displays MTD and YTD:
Actual, Target, and Previous Year
🎯 Includes KPIs such as:
Satisfaction Score
Eco Participation
Remote Work Satisfaction
🔺🔻 Conditional formatting with arrows shows performance trends
💡 Compare actual vs. target and previous year for clarity
📈 KPI Trend Sheet – Track Growth Over Time
🔽 Drop-down to select any KPI (C3)
💬 Shows Group, Unit, Type (UTB/LTB), Formula & Definition
📊 MTD and YTD combo charts: Actual vs. Target vs. PY
Perfect for identifying long-term trends and insights
✍️ Actual Numbers Input Sheet
📆 Select starting month (E1) of the fiscal year
🧾 Enter monthly Actuals for each KPI
Supports MTD and YTD input
🎯 Target Sheet
Input monthly Targets for each KPI
MTD and YTD values tracked separately
📆 Previous Year Number Sheet
Archive data for previous year KPIs
Enables year-over-year comparison on all charts
📘 KPI Definition Sheet
Create or modify KPIs easily
Fields: Name, Group, Unit, Type, Formula, Definition
Tailor the dashboard to your exact tracking needs
📂 What’s Inside the Dashboard File?
✅ 7 structured Excel worksheets
✅ KPI tracking for satisfaction, engagement, eco metrics, and more
✅ Dynamic drop-downs for KPI and month selection
✅ Conditional formatting with real-time status icons
✅ Custom charts that update automatically
✅ Formula-ready and fully editable layout
✅ Easy to customize for additional KPIs
Designed for simplicity and scalability — no advanced Excel skills required!
🧑💻 How to Use the Employee Satisfaction KPI Dashboard
📝 Go to the KPI Definition Sheet and add or adjust KPIs
🎯 Enter monthly target values in the Target Sheet
📆 Fill in last year’s metrics in the Previous Year Sheet
📥 Update actual MTD and YTD data in the Actual Input Sheet
📊 Head to the Dashboard Sheet to monitor progress
📈 Use the Trend Sheet to see how KPIs evolve month by month
Share insights, generate reports, and make data-driven HR & sustainability decisions — all in Excel!
🎯 Who Can Benefit from This Dashboard?
👩💼 HR Managers – Track satisfaction, retention, and training
🌿 Sustainability Officers – Link eco-awareness to engagement
📊 ESG Analysts – Meet reporting and audit requirements
🏢 Corporate Leaders – Align people-first values with ESG goals
🧑🤝🧑 CSR & DEI Teams – Monitor well-being and social impact
💻 Remote Teams – Gauge digital satisfaction metrics
Perfect for organizations that care about people and the planet.
🔗 Click here to read the Detailed blog post
🔗 Visit our YouTube channel to learn step-by-step video tutorials
Watch the step-by-step video tutorial:
Compatibility and Requirements
- Works in Microsoft Excel desktop (Excel 2016 or later, or Microsoft 365).
- You pick the month and the KPI from dropdown lists. Microsoft explains how in Create a drop-down list.
Frequently Asked Questions
Which sheets are included?
Seven worksheets: Home, Dashboard, KPI Trend, Actual Numbers, Target, Previous Year Number and KPI Definition.
How do I update the dashboard?
Enter your MTD and YTD figures in the Actual Numbers sheet and your goals in the Target sheet. Then select a month on the Dashboard sheet and it updates.
Can I compare this year with last year?
Yes. Add last year’s figures to the Previous Year Number sheet. The Dashboard and the trend charts show Actual, Target and Previous Year side by side.
Can I add my own KPIs?
Yes. The KPI Definition sheet lets you create or edit a KPI with its name, group, unit, type (UTB or LTB), formula and definition.
Is there a Power BI or Google Sheets version?
The Employee Satisfaction Dashboard in Power BI and the Employee Satisfaction Dashboard in Google Sheets cover employee satisfaction on those platforms.
Related Environmental and Sustainability Templates
- Environmental and Sustainability Employee Retention KPI Dashboard in Excel: track retention alongside satisfaction
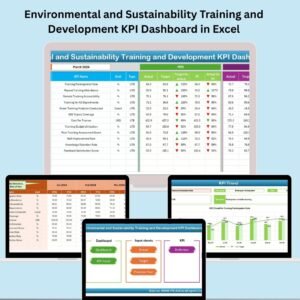
- Environmental and Sustainability Training and Development KPI Dashboard in Excel: training KPIs for your team
- Environmental and Sustainability Compliance KPI Dashboard in Excel: compliance metrics in the same layout
- Employee Satisfaction Dashboard in Excel: a general employee satisfaction dashboard
- Employee Satisfaction Report in Excel: a report format for survey results
Browse all Excel KPI dashboards.































Reviews
There are no reviews yet.