

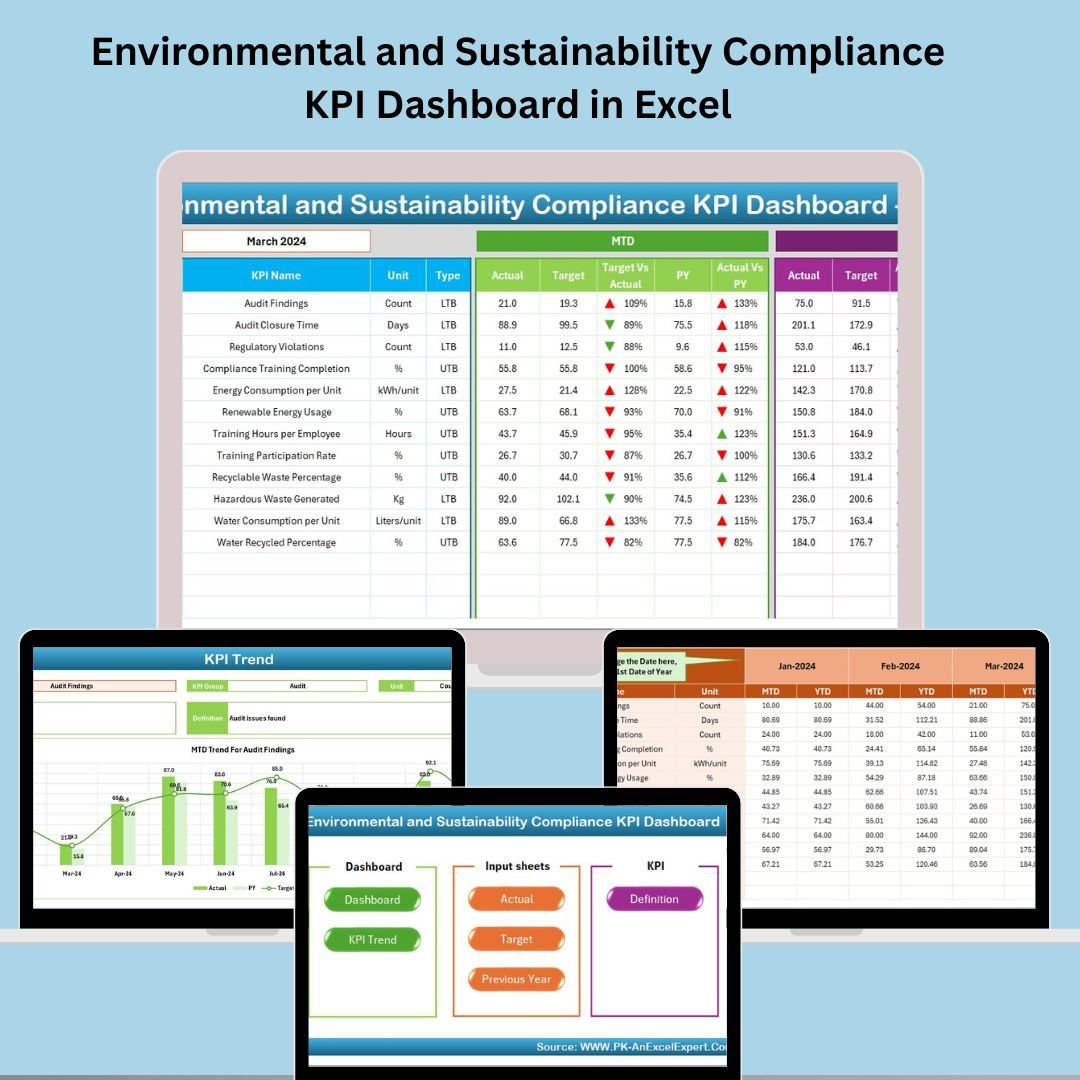
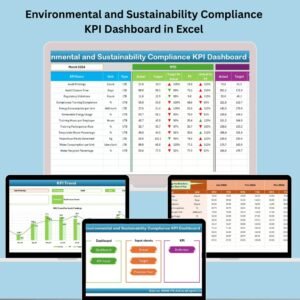
In a world where regulatory compliance and sustainability are non-negotiable, every organization needs a smart tool to keep performance in check. Enter the Environmental and Sustainability Compliance KPI Dashboard in Excel—your all-in-one, Excel-powered solution for tracking environmental KPIs, achieving compliance, and leading sustainability initiatives with data-driven clarity! 💡
This interactive dashboard is fully automated and easy to use, providing decision-makers and environmental managers with real-time insights on carbon emissions, water usage, energy efficiency, and more—without relying on expensive software. Let’s dive in! 🌍
✨ Key Features of Environmental and Sustainability Compliance KPI Dashboard
Here’s what makes this dashboard a game-changer:
🏠 Home Sheet
6 navigation buttons to jump across dashboard sections
Streamlined user experience for fast access
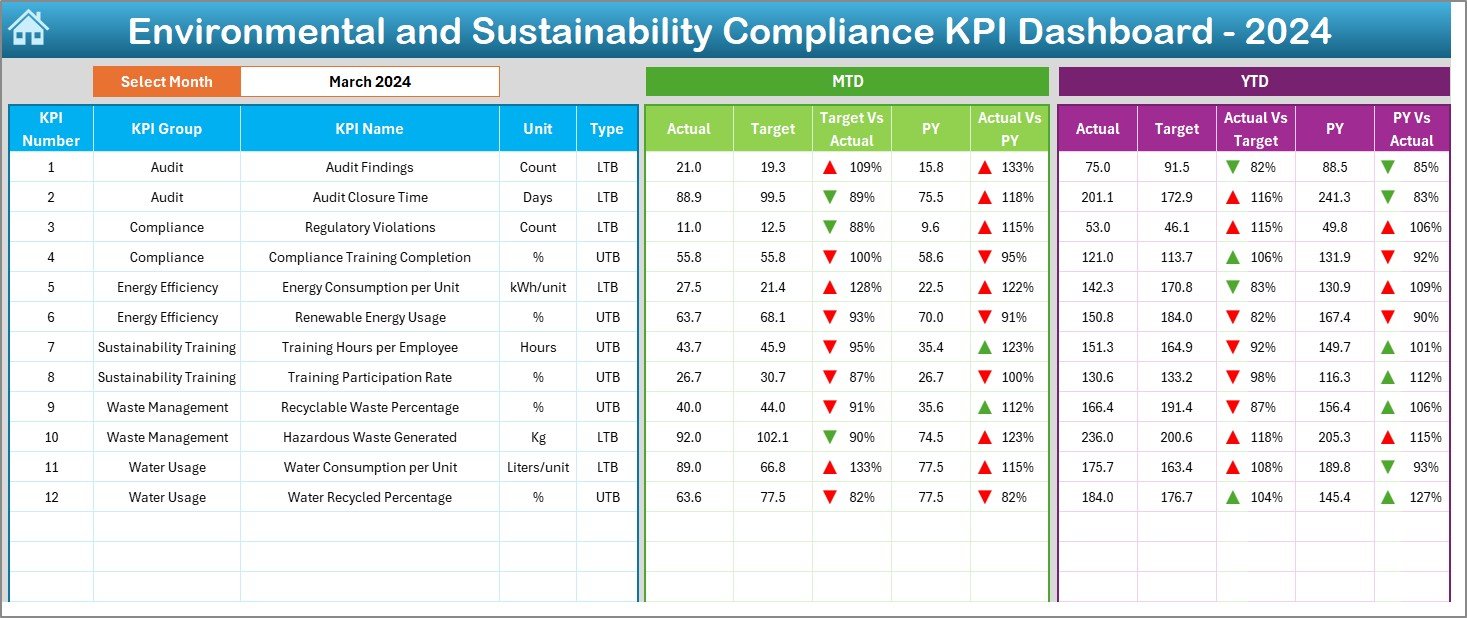
📊 Dashboard Sheet
Select a month in cell D3 and see metrics update instantly
Displays MTD/YTD values with 🔼🔽 visual indicators
Track Target vs. Actual and Previous Year vs. Actual
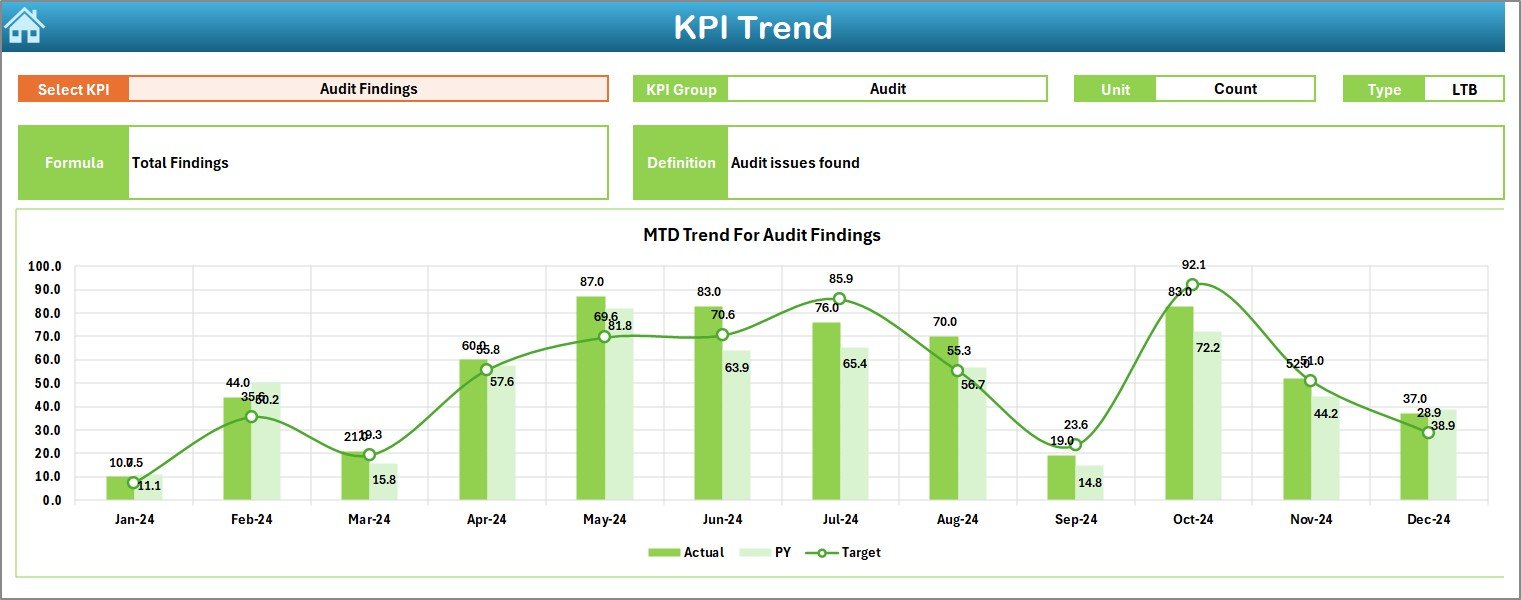
📈 KPI Trend Sheet
Pick a KPI from the dropdown
View its group, formula, type (LTB or UTB), and performance graph
Analyze monthly trends with side-by-side MTD & YTD charts
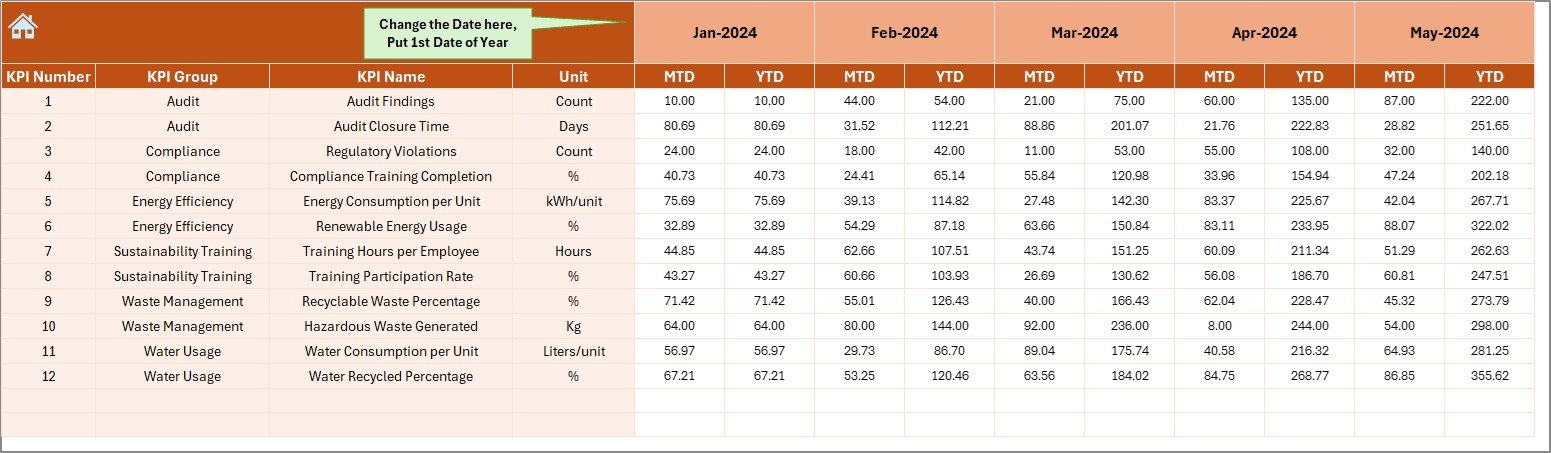
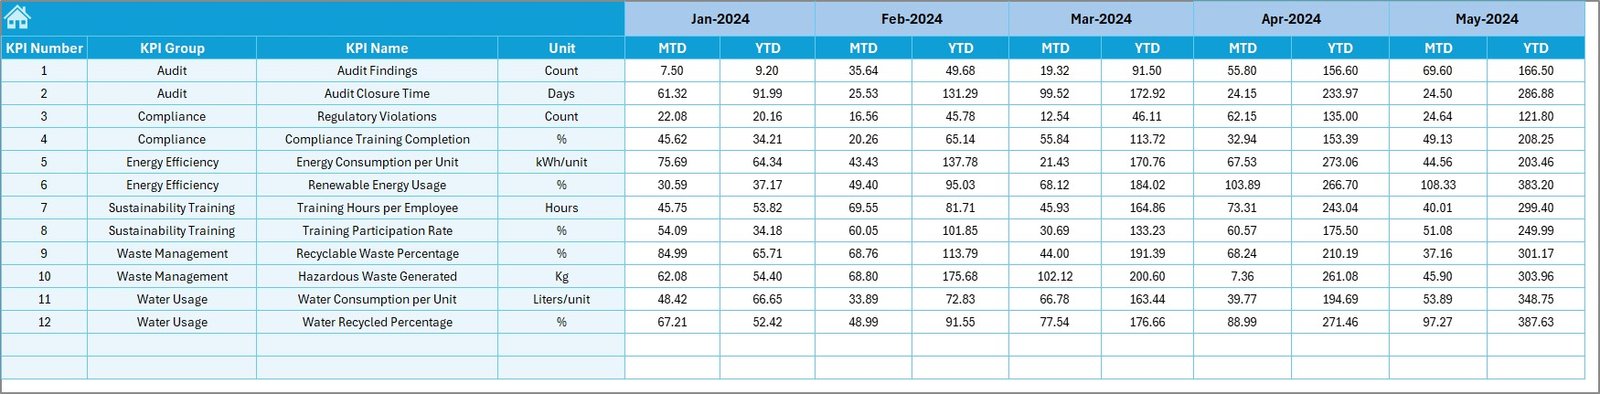
🧾 Actual Numbers Input Sheet
Enter monthly actuals for each KPI
MTD and YTD formats supported
Controlled by a date range selector (E1)
🎯 Target Sheet
Record MTD and YTD targets
Compare performance to goals and stay focused
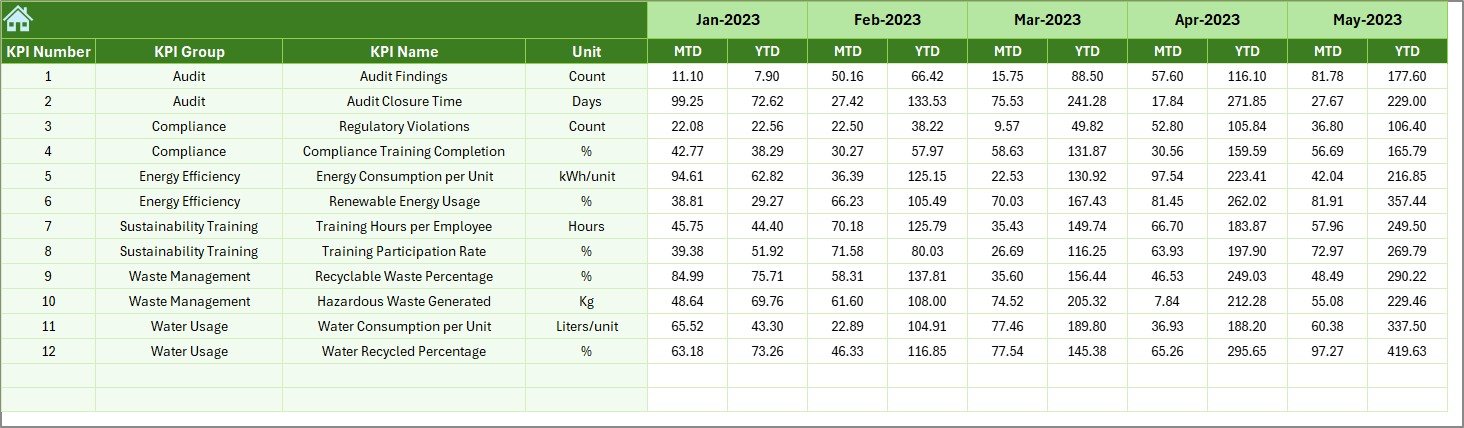
📆 Previous Year Numbers Sheet
Year-over-year performance tracking
Great for forecasting and board reporting
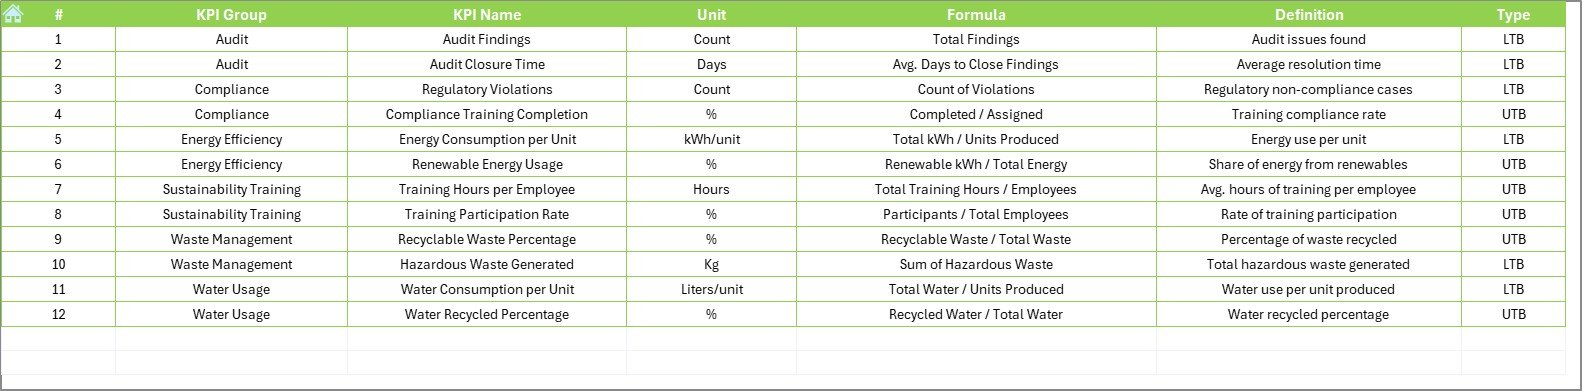
🧠 KPI Definition Sheet
Define each KPI with group, formula, unit, and description
Structured reference to keep everyone aligned
📦 What’s Inside the Dashboard?
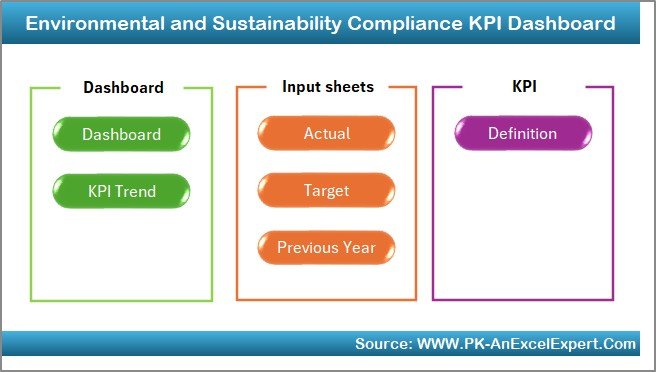
7 structured worksheet tabs
20+ KPI tracking fields for sustainability, compliance, and environment
Fully editable Excel file—no software dependency!
Conditional formatting for instant visual feedback
User-friendly dropdown menus and automated calculations
🔧 How to Use the Dashboard
Set your start month in the Actual Numbers Input sheet
Define your KPIs in the KPI Definition tab
Enter target values in the Target tab
Input actual data monthly in the Actual Numbers Input tab
Select the month in the Dashboard tab to view updated charts
Analyze trends in the KPI Trend tab
Export or present visual summaries for compliance reviews or team meetings!
👥 Who Can Benefit from This Dashboard?
Whether you’re a sustainability officer, compliance analyst, or operations manager, this tool is made for YOU:
✅ Corporate Sustainability Teams: Monitor and report KPIs
✅ Compliance Officers: Ensure regulatory alignment
✅ Manufacturers & Industries: Track carbon, waste, and water usage
✅ Consultants: Offer clients real-time dashboards
✅ Small Businesses: Achieve goals with a budget-friendly tool
✅ ESG Reporters: Simplify data gathering for disclosures
🔗 Click here to read the Detailed blog post
📺 Visit our YouTube channel to learn step-by-step video tutorials






























Reviews
There are no reviews yet.