





Managing employee workload effectively is essential for productivity, employee well-being, and timely project delivery. When tasks are unevenly distributed, some employees experience burnout while others remain underutilized. Unfortunately, many organizations still depend on emails, manual trackers, or basic spreadsheets, which makes workload monitoring fragmented and inefficient.
That is exactly why an Employee Workload Dashboard in Google Sheets becomes an essential workforce management tool.
This ready-to-use dashboard provides a centralized and visual way to track tasks, estimated effort, and workload distribution across employees, departments, categories, and months. Instead of guessing who is overloaded or underutilized, managers gain instant, data-driven insights that support fair task allocation and smarter planning.
Because the dashboard is built in Google Sheets, it remains easy to use, collaborative, and accessible—without requiring expensive software or complex project management tools.
🚀 Key Features of the Employee Workload Dashboard
📌 Centralized Task & Workload Tracking
Track all tasks and effort estimates from a single dashboard.
⏱️ Estimated Effort Visibility
Monitor average estimated hours to understand workload pressure.
👥 Employee-Level Analysis
Identify overloaded or underutilized employees instantly.
🏢 Department & Category Insights
Balance workload across teams and task types.
📅 Monthly Trend Analysis
Understand how workload changes over time.
🔍 Smart Search Functionality
Find tasks instantly using keyword and field-based search.
📦 What’s Inside the Employee Workload Dashboard
🗂️ Overview Sheet Tab – High-Level Snapshot
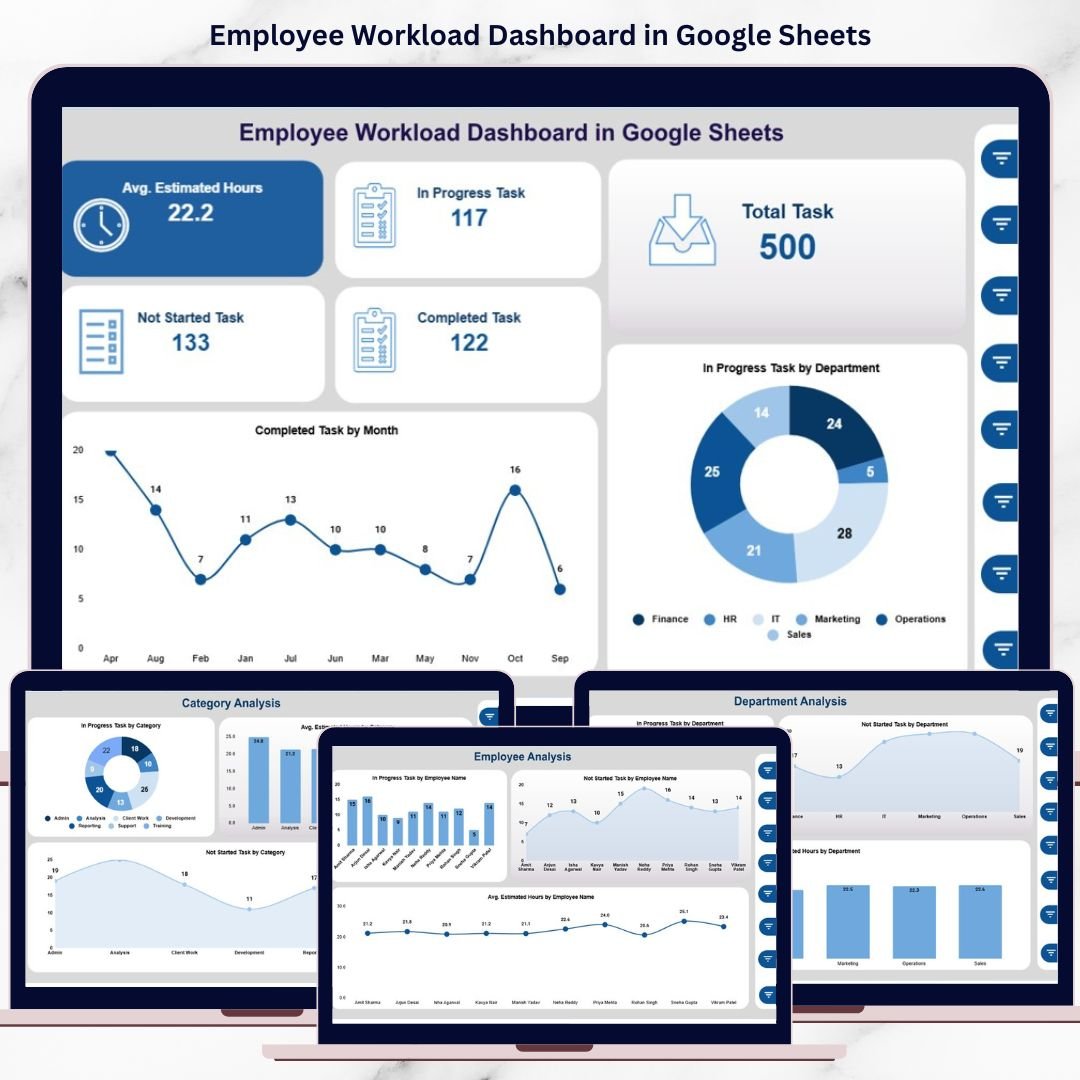
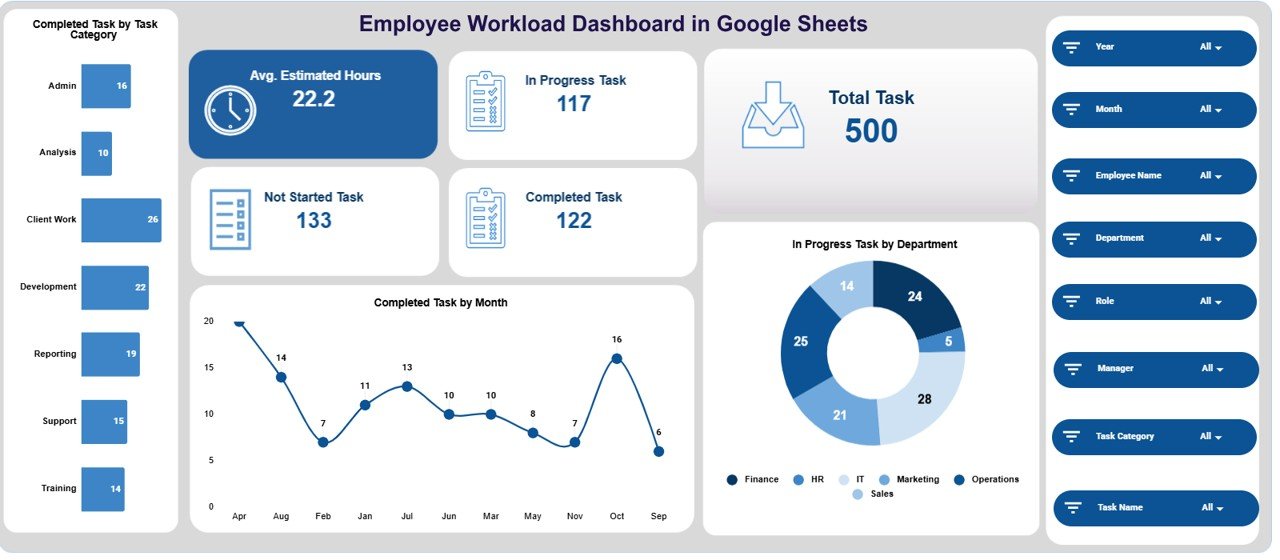
The Overview Sheet provides leadership with an instant summary of workload health.
📊 KPI Cards Included
Avg. Estimated Hours – Average planned effort per task
Total Task – Total number of tasks recorded
In Progress Task – Ongoing tasks
Completed Task – Successfully completed tasks
Not Started Task – Tasks yet to begin
These KPI cards help managers quickly assess workload intensity and task flow.
📈 Overview Charts
Completed Task by Task Category
Completed Task by Month
In Progress Task by Department
Together, these visuals highlight productivity trends and workload concentration areas.
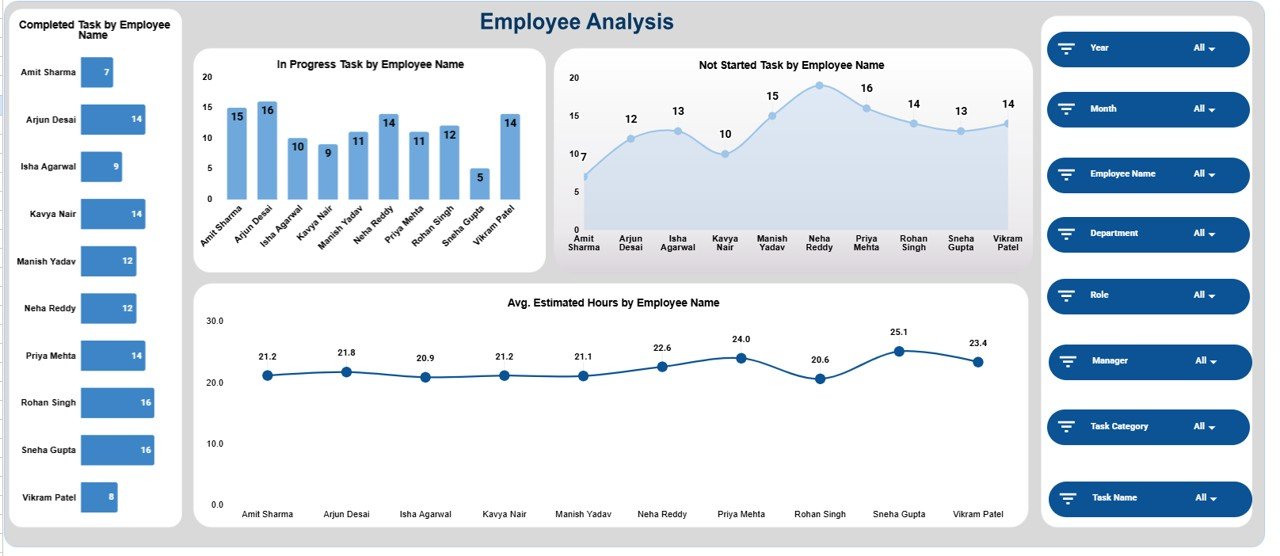
👤 Employee Analysis Section
This section focuses on individual employee workload and utilization.
📊 Charts Included
Completed Task by Employee Name
In Progress Task by Employee Name
Not Started Task by Employee Name
Avg. Estimated Hours by Employee Name
Managers can quickly identify employees who may need support, task reassignment, or additional capacity.
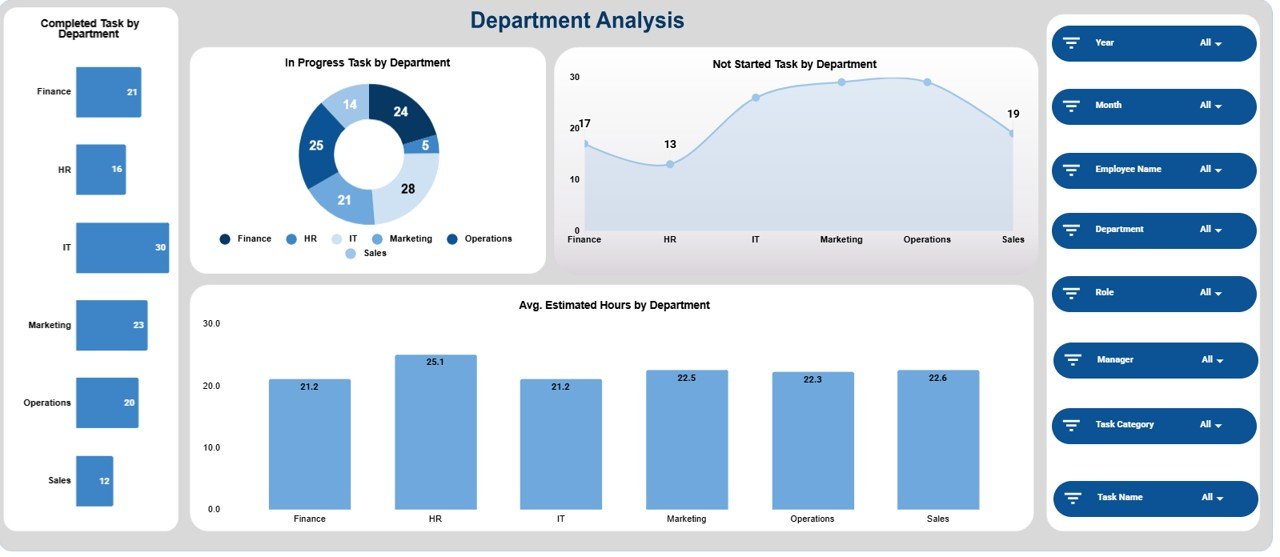
🏢 Department Analysis Section
This section analyzes workload distribution at the department level.
📊 Charts Included
Completed Task by Department
In Progress Task by Department
Not Started Task by Department
Avg. Estimated Hours by Department
These insights help leadership balance workloads across departments and prevent bottlenecks.
🧩 Category Analysis Section
Different task categories demand different effort levels. This section helps evaluate category-wise workload.
📊 Charts Included
Completed Task by Category
In Progress Task by Category
Not Started Task by Category
Avg. Estimated Hours by Category
This analysis supports better prioritization and capacity planning.
📆 Monthly Trends Section
The Monthly Trends view highlights workload movement over time.
📊 Charts Included
Completed Task by Month
In Progress Task by Month
Not Started Task by Month
Avg. Estimated Hours by Month
This helps teams identify seasonal spikes, delivery slowdowns, or sustained workload issues.
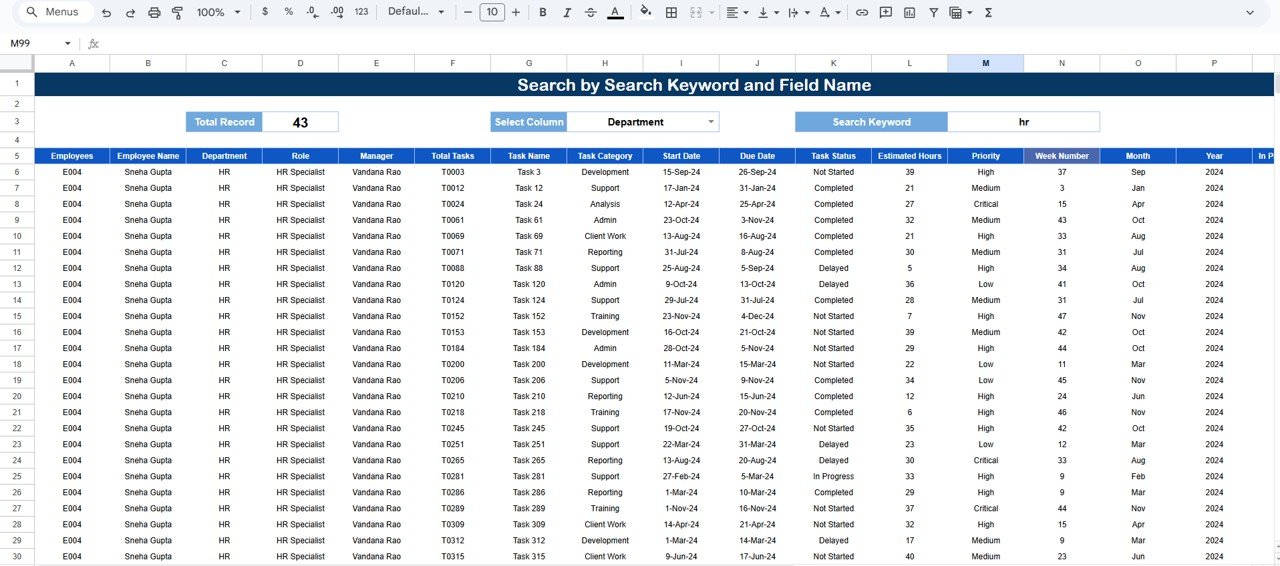
🔍 Search Functionality – Search by Keyword & Field Name
The dashboard includes a powerful Search feature that allows users to filter tasks instantly by:
Employee Name
Department
Task Category
Task Status
Month
This feature saves time, supports quick follow-ups, and improves operational efficiency.
🎯 Who Should Use This Dashboard
👥 Team Leaders & Managers
📋 Project Managers
🧠 HR & Workforce Planning Teams
⚙️ Operations Managers
🚀 Organizations of all sizes
🛠️ How to Use the Employee Workload Dashboard
Update task and effort data regularly
Review workload weekly or bi-weekly
Reassign tasks proactively
Monitor estimated hours vs task status
Use trends for long-term capacity planning
Consistent use helps prevent burnout and improve productivity.
🔗 Click here to read the Detailed blog post
Watch the step-by-step video tutorial:
▶️ Visit our YouTube channel for step-by-step video tutorials
👉 Youtube.com/@NeotechNavigators






























Reviews
There are no reviews yet.