

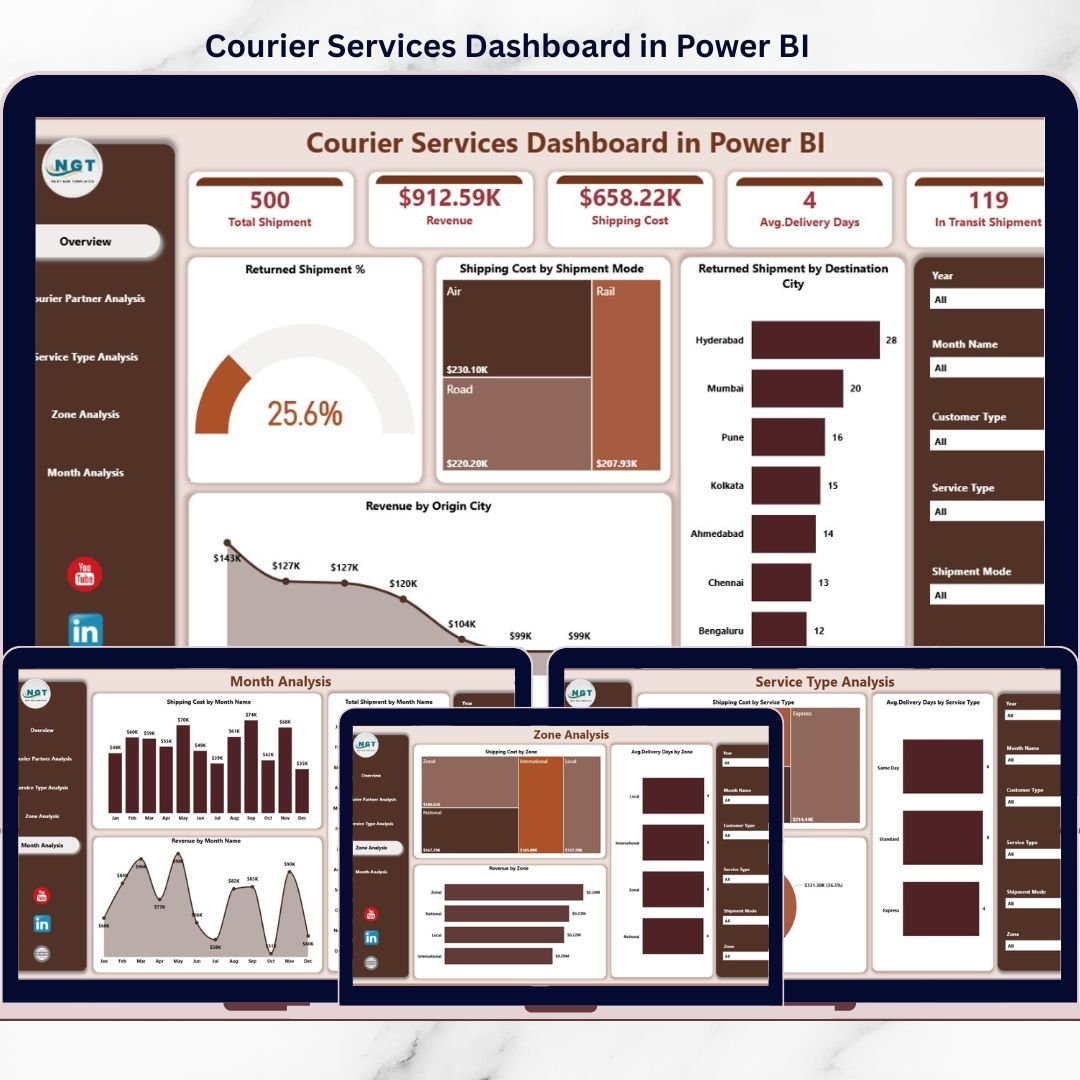

Courier and logistics operations run on speed, accuracy, and efficiency. Every day, courier companies handle thousands of shipments across cities, zones, partners, and service types. However, when operational data remains trapped in spreadsheets, static reports, or disconnected systems, teams struggle to control costs, reduce returns, and improve delivery performance.
That is exactly where the Courier Services Dashboard in Power BI becomes a powerful and strategic solution 🚚📊.
This ready-to-use Power BI dashboard transforms raw courier and logistics data into interactive, real-time, and decision-ready insights. Instead of manually analyzing shipment logs, cost sheets, and revenue files, courier managers can instantly monitor shipments, delivery timelines, return rates, costs, partner performance, zone efficiency, and monthly trends—all from a single dashboard.
Built using Microsoft Power BI, this dashboard enables dynamic filtering, drill-down analysis, and executive-level visual reporting. As a result, courier companies move from reactive problem-solving to proactive, data-driven operations management.
## ✨ Key Features of Courier Services Dashboard in Power BI
This dashboard is designed specifically for courier, logistics, and delivery operations.
🚚 Centralized Courier Performance Tracking
Monitor all courier KPIs in one interactive dashboard.
📊 Power BI Interactive Visuals
Slice, filter, and drill down without manual reporting.
🔁 Return & Delivery Performance Analysis
Track returned shipment %, delivery speed, and service quality.
💰 Cost & Revenue Visibility
Analyze shipping costs and revenue across partners, services, and zones.
🧭 Multi-Dimensional Analysis
Filter insights by courier partner, service type, zone, city, and month.
📈 Trend & Seasonality Analysis
Understand monthly shipment, cost, and revenue patterns.
⚡ Scalable & Refreshable Model
Easily refresh data and expand KPIs as the business grows.
## 📂 What’s Inside the Courier Services Dashboard in Power BI
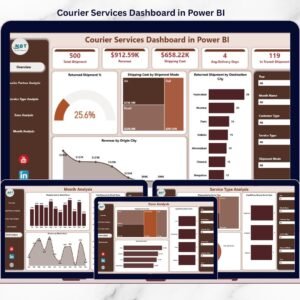
The dashboard includes five professionally designed analytical pages, each focused on a critical operational area.
🟦 Overview Page
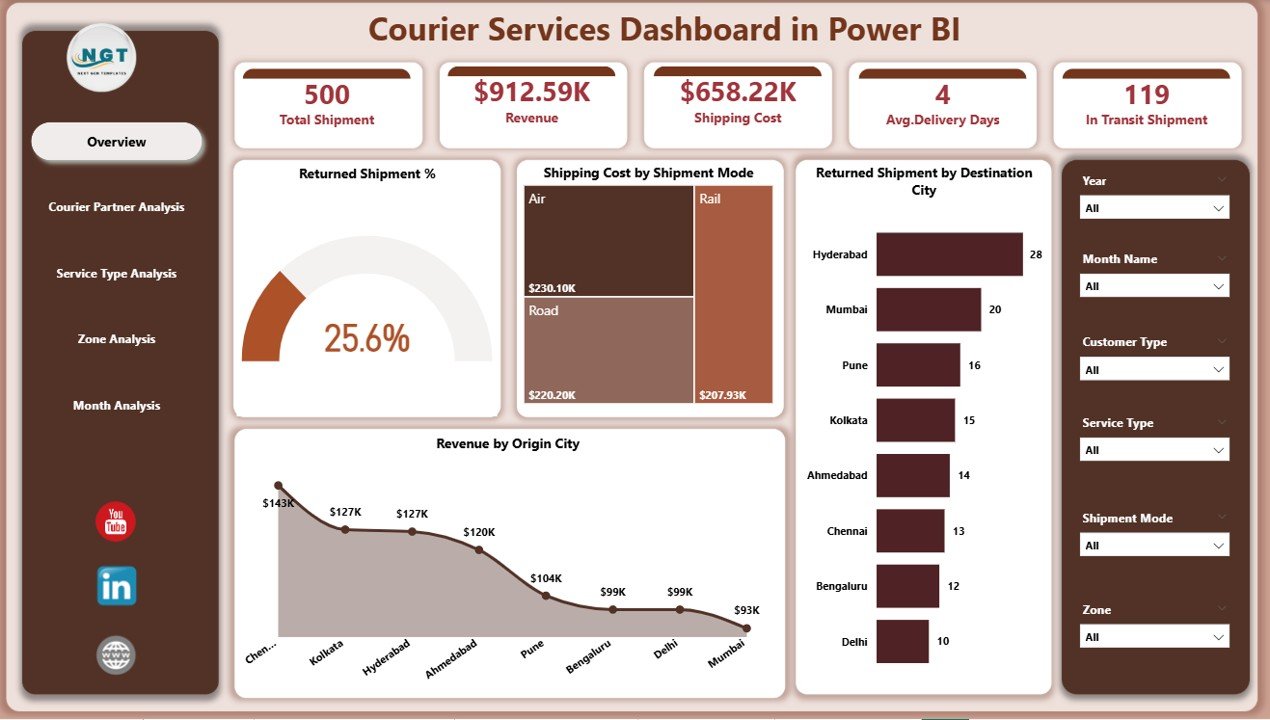
The main control panel showing high-level courier performance:
Returned Shipment %
Shipping Cost by Shipment Mode
Returned Shipment by Destination City
Revenue by Origin City
This page helps leadership quickly identify problem areas and revenue drivers.
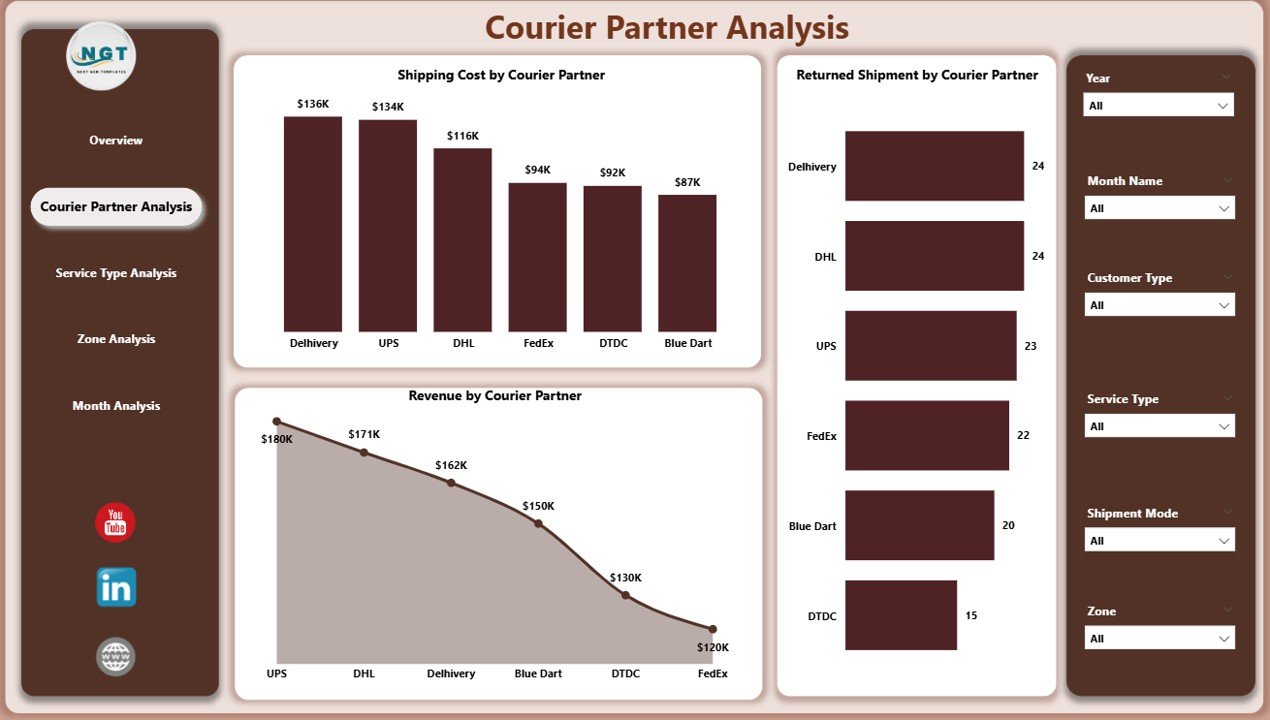
🟦 Courier Partner Analysis Page
Evaluates partner-wise performance using:
Returned Shipment by Courier Partner
Shipping Cost by Courier Partner
Revenue by Courier Partner
Perfect for partner comparison, contract reviews, and accountability.
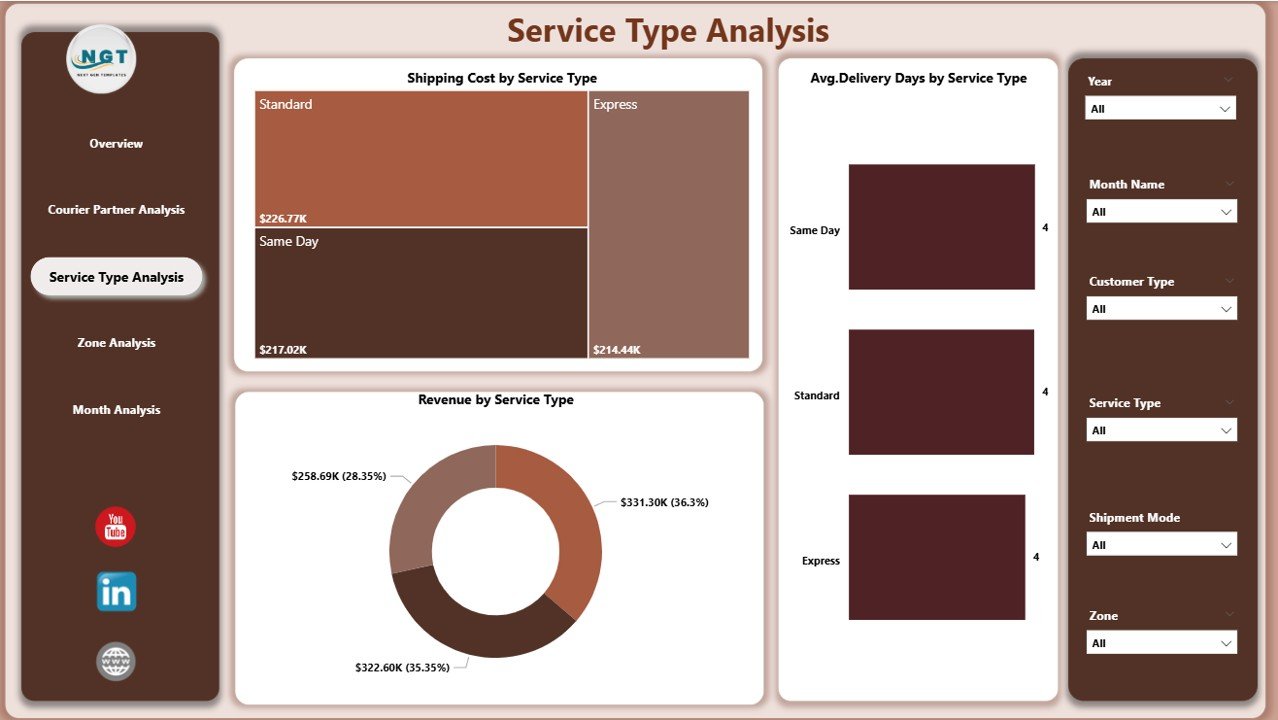
🟦 Service Type Analysis Page
Analyzes performance across delivery services:
Average Delivery Days by Service Type
Shipping Cost by Service Type
Revenue by Service Type
Helps balance speed, cost, and profitability.
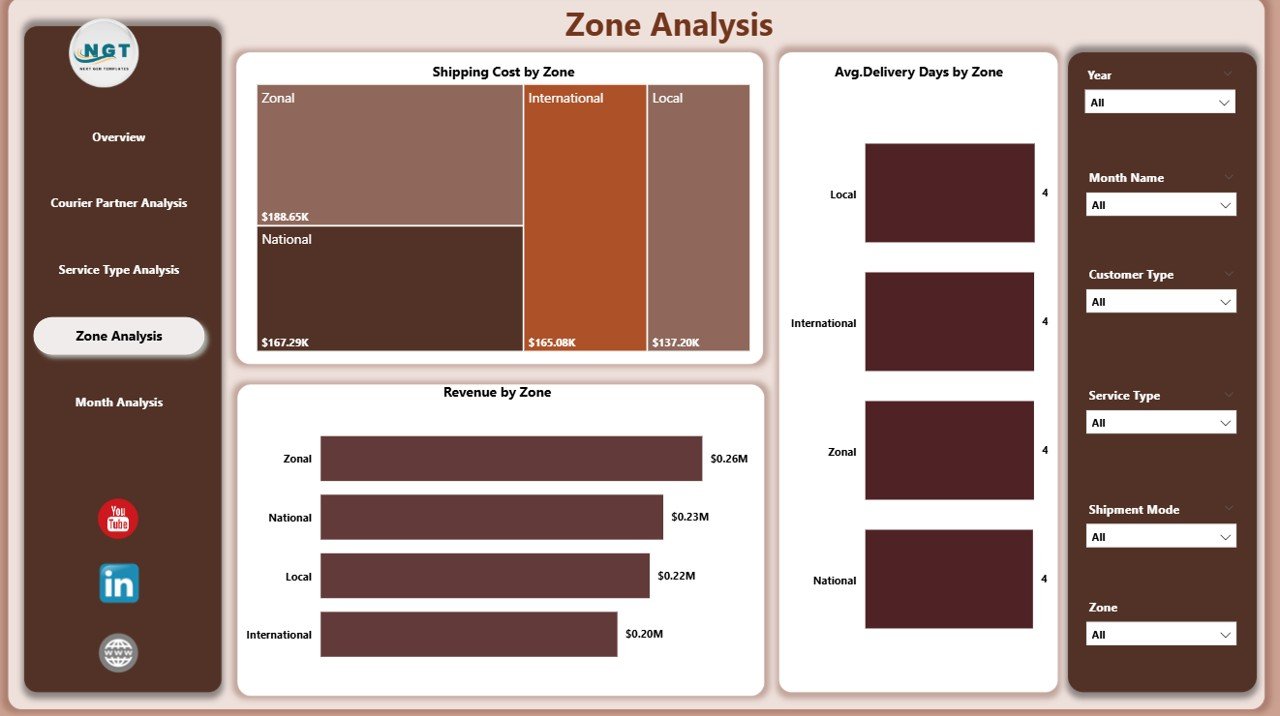
🟦 Zone Analysis Page
Provides regional and zone-wise insights:
Average Delivery Days by Zone
Shipping Cost by Zone
Revenue by Service Zone
Supports route optimization and regional planning.
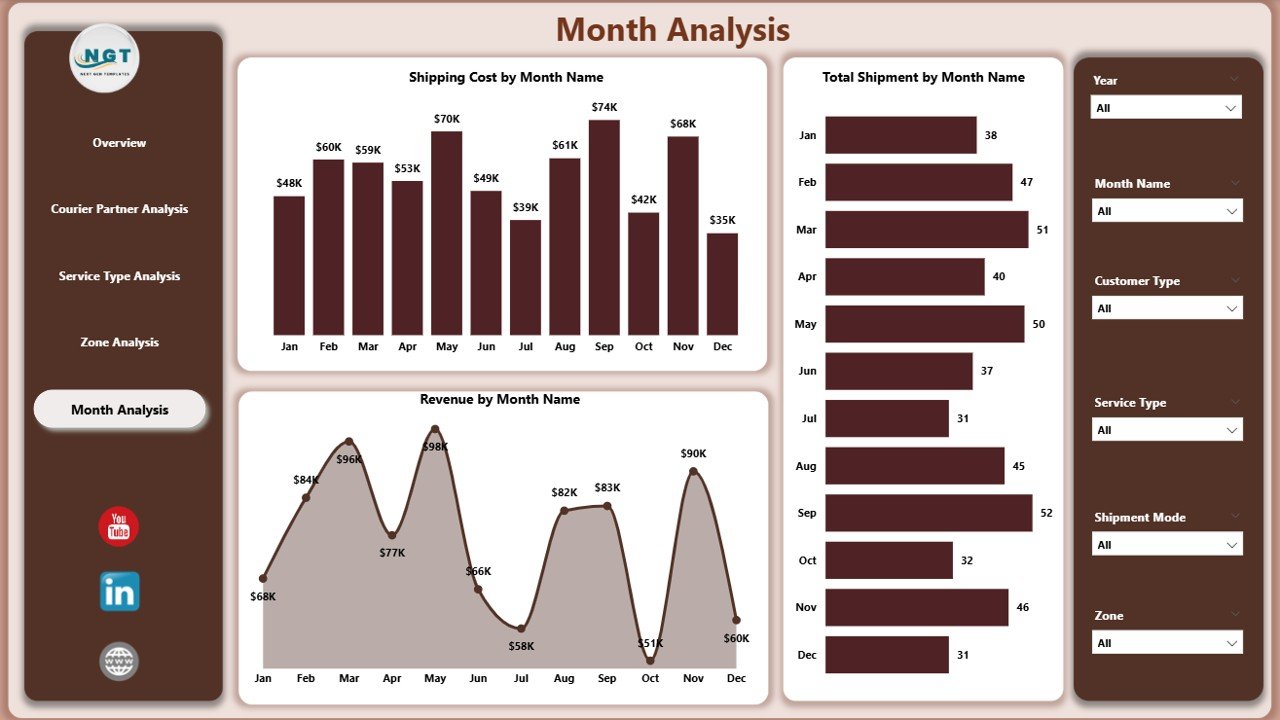
🟦 Month Analysis Page
Tracks time-based trends using:
Total Shipment by Month
Shipping Cost by Month
Revenue by Month
Enables forecasting, capacity planning, and seasonal preparation.
Together, these pages deliver a 360-degree operational view of courier performance.
## 🧩 How to Use the Courier Services Dashboard in Power BI
Using the dashboard is simple and efficient:
1️⃣ Connect or refresh your courier data
2️⃣ Open the dashboard in Power BI
3️⃣ Apply slicers by partner, zone, service type, or month
4️⃣ Review returns, delivery speed, costs, and revenue
5️⃣ Drill down into underperforming areas
6️⃣ Take data-backed corrective actions
No advanced Power BI skills are required to use the dashboard—only basic familiarity.
## 👥 Who Should Use This Dashboard?
This dashboard is ideal for:
✔️ Courier & Logistics Companies
✔️ Operations Managers
✔️ Supply Chain & Delivery Heads
✔️ Finance & Cost Control Teams
✔️ Business Owners
✔️ Strategy & Planning Teams
Both technical and non-technical users can benefit from its intuitive design.
### Click here to read the Detailed blog post
Visit our YouTube channel to learn step-by-step video tutorials
👉 https://youtube.com/@PKAnExcelExpert
Watch the step-by-step video tutorial:
Compatibility and Requirements
- Works in Power BI Desktop, which is free to download. Microsoft explains the install in Get Power BI Desktop.
- You connect or refresh your own courier data, then use the slicers to filter the report.
Frequently Asked Questions
Which pages does the dashboard include?
Five pages: Overview, Courier Partner Analysis, Service Type Analysis, Zone Analysis and Month Analysis.
What can I filter by?
You can apply slicers by courier partner, service type, zone, city and month.
Which return and cost figures does it show?
The Overview page shows returned shipment %, shipping cost by shipment mode, returned shipments by destination city and revenue by origin city. The other pages break returns, shipping cost and revenue down by partner, service type and zone.
Can I see monthly trends?
Yes. The Month Analysis page shows total shipments, shipping cost and revenue by month.
Is there an Excel or Google Sheets version?
Yes. See the Courier Service KPI Dashboard in Excel and the Courier Service KPI Dashboard in Google Sheets.
Related Courier and Service Dashboards
- Courier Service KPI Dashboard in Power BI: a KPI-focused courier report in Power BI
- Courier Service KPI Dashboard in Excel: the courier KPIs in Excel
- Courier Service KPI Dashboard in Google Sheets: the courier KPIs in Google Sheets
- Transportation Services KPI Dashboard in Excel: a related transport view in Excel
- Logistics and Transportation Hub: 7 logistics templates in one download
Browse all Power BI dashboards.


















Reviews
There are no reviews yet.