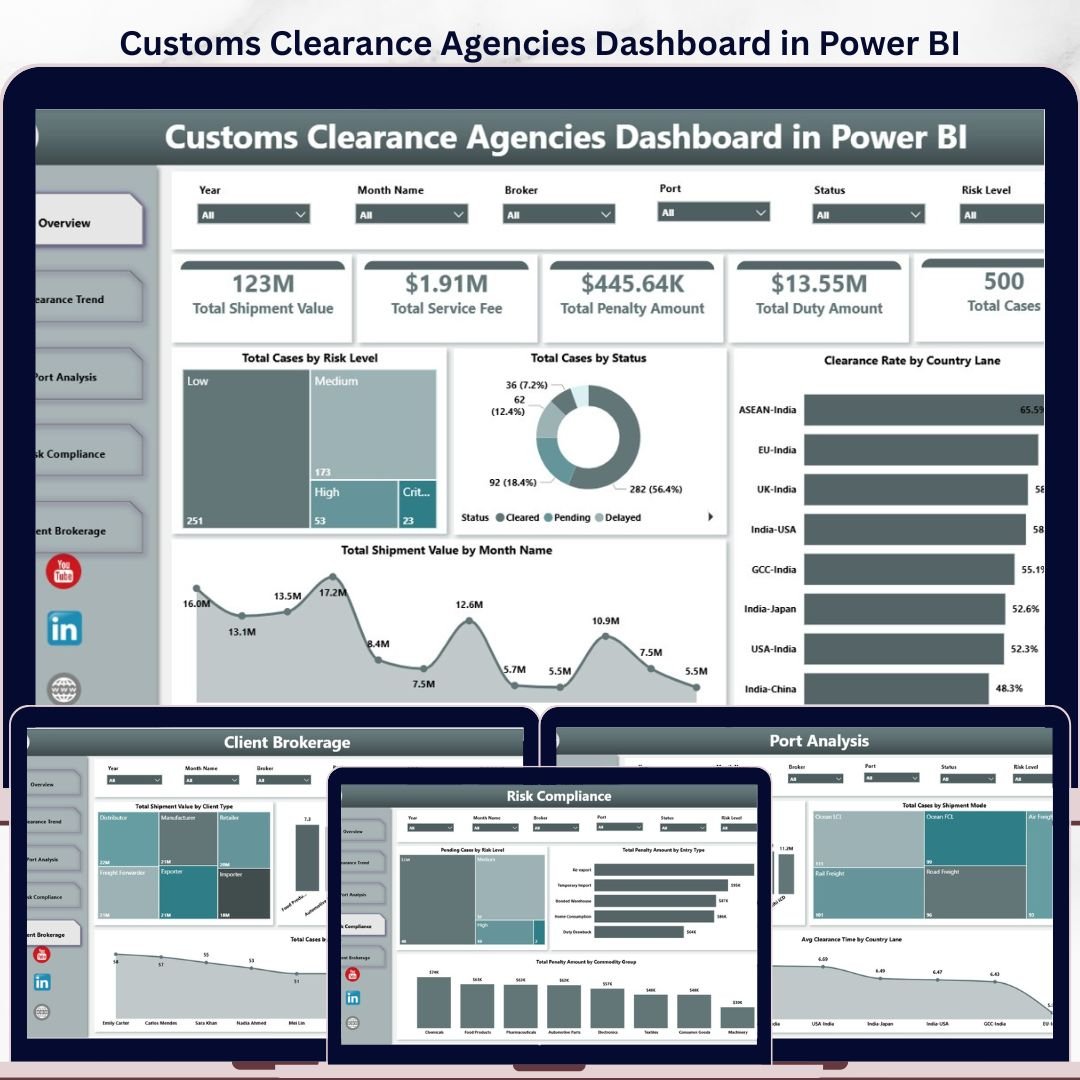

Customs Clearance Agencies Dashboard in Power BI helps customs brokers, freight forwarders, import-export teams, compliance managers, and brokerage owners monitor clearance workload, shipment value, duty amount, service fees, penalties, case status, risk exposure, ports, country lanes, clients, and brokers in one ready-made Power BI report. The template includes 5 dashboard pages, executive KPI cards, multiple slicers, and focused visual analysis for daily operations reviews. Join 8,400+ teams in 40+ countries using NextGenTemplates to replace scattered spreadsheets and expensive reporting tools with one-time-purchase dashboard templates. Instant download, lifetime access, editable Power BI file, and no subscription.
Key Features of Customs Clearance Agencies Dashboard in Power BI
- 5 Power BI dashboard pages: Overview, Clearance Trend, Port Analysis, Risk Compliance, and Client Brokerage.
- Executive KPI cards: Track Total Shipment Value, Total Service Fee, Total Penalty Amount, Total Duty Amount, and Total Cases.
- Operational slicers: Filter quickly by status, risk level, country lane, port, shipment mode, client type, broker, commodity group, and month.
- Clearance trend analysis: Review quarterly shipment value, cases by month, and average clearance time by case status.
- Port and lane visibility: Compare shipment value by port, cases by shipment mode, and average clearance time by country lane.
- Risk and compliance reporting: Monitor pending cases by risk level and penalty amount by entry type or commodity group.
- Editable PBIX file: Change visuals, colors, measures, model fields, filters, and branding inside Power BI Desktop.
What’s Inside the Customs Clearance Agencies Dashboard in Power BI
1. Overview Page
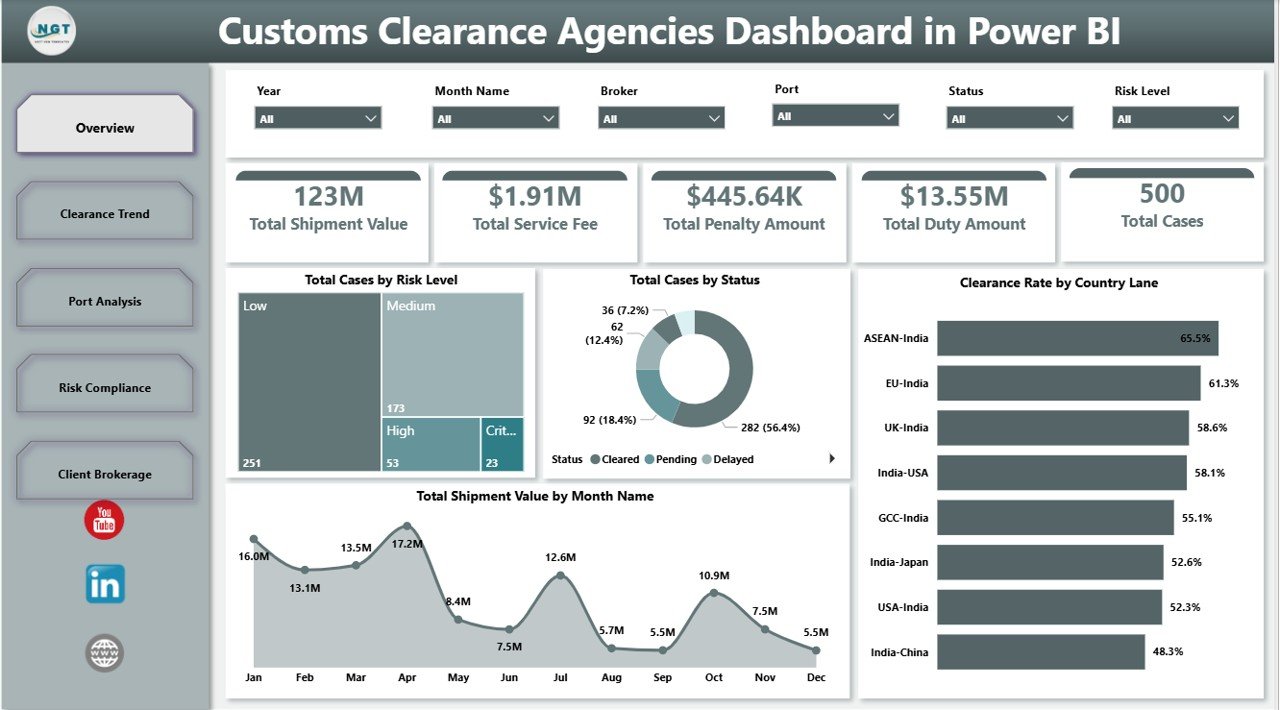
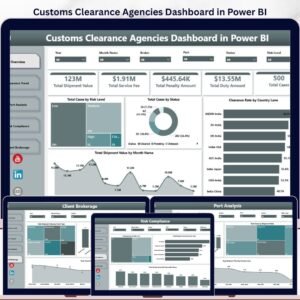
The Overview page gives leaders the high-level performance view before they drill into operational detail. KPI cards summarize Total Shipment Value, Total Service Fee, Total Penalty Amount, Total Duty Amount, and Total Cases so teams can quickly review volume, financial exposure, and compliance cost.
Total Cases by Risk Level shows how clearance workload is distributed across risk bands. Use it to see whether high-risk files are increasing and where compliance effort should be focused.
Total Cases by Status separates cleared, pending, delayed, rejected, or in-review cases. It helps managers identify workload bottlenecks before clients start asking for updates.
Clearance Rate by Country Lane compares clearance performance across import-export lanes. This is useful for finding routes where documentation, inspection, or regulatory friction is slowing completion.
Total Shipment Value by Month Name shows monthly movement in shipment value. Finance and operations teams can use the trend to compare workload with duties, service fees, and seasonal shipment patterns.
Customs Clearance Agencies Dashboard in Power BI
2. Clearance Trend
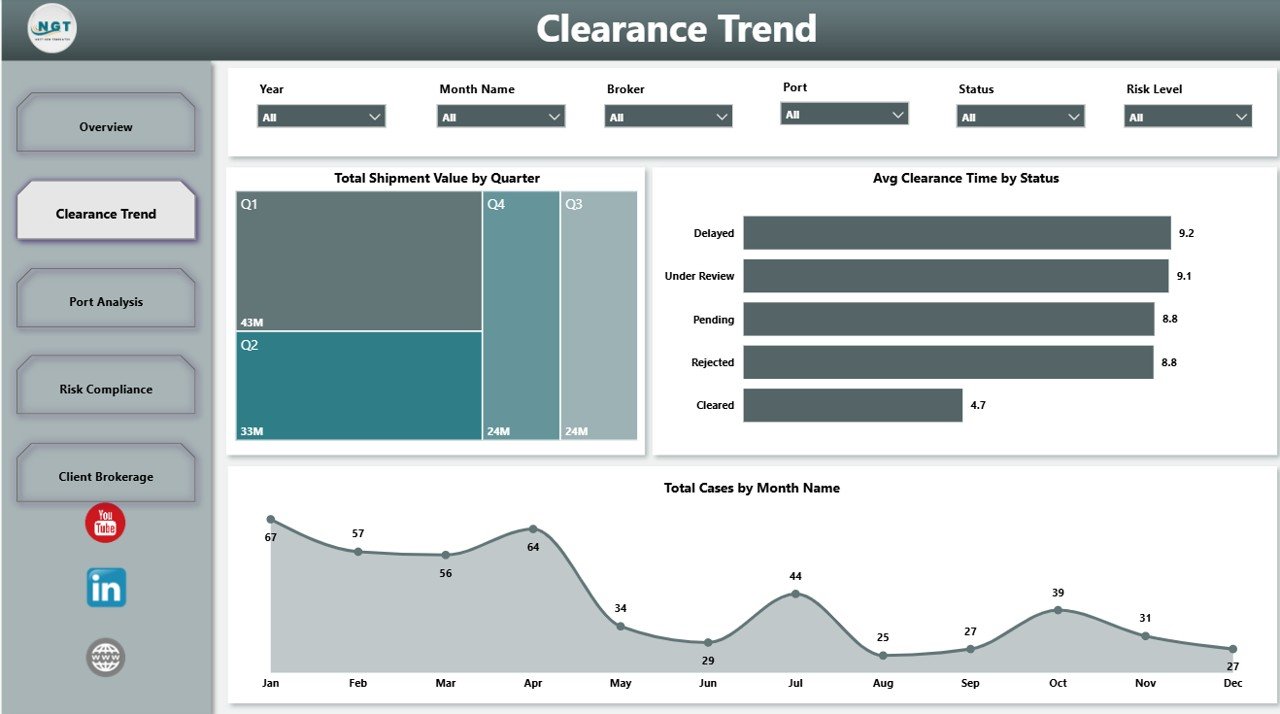
The Clearance Trend page tracks how customs activity changes over time. Total Shipment Value by Quarter highlights value movement, Avg Clearance Time by Status reveals workflow delays, and Total Cases by Month Name shows the rhythm of monthly workload.
Clearance Trend
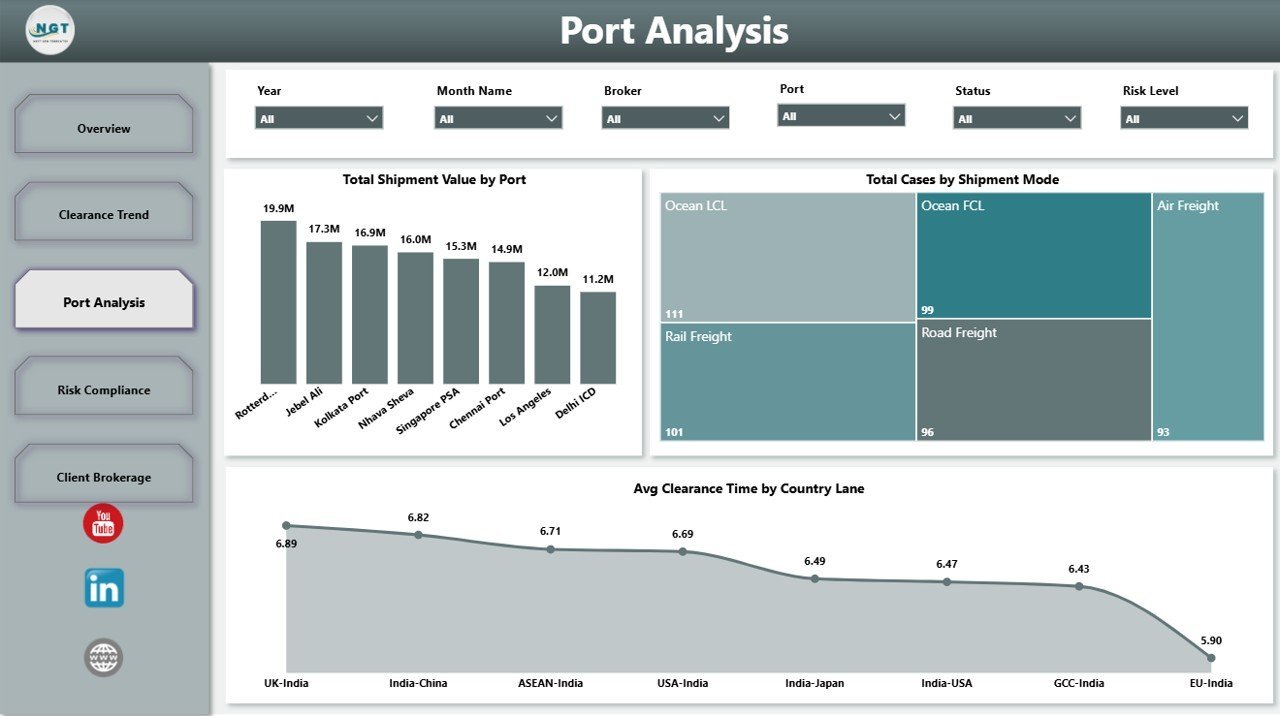
3. Port Analysis
The Port Analysis page explains how ports, shipment modes, and country lanes affect performance. Total Shipment Value by Port shows where commercial value is concentrated, Total Cases by Shipment Mode compares air, sea, road, or rail workload, and Avg Clearance Time by Country Lane supports lane-level process review.

Port Analysis
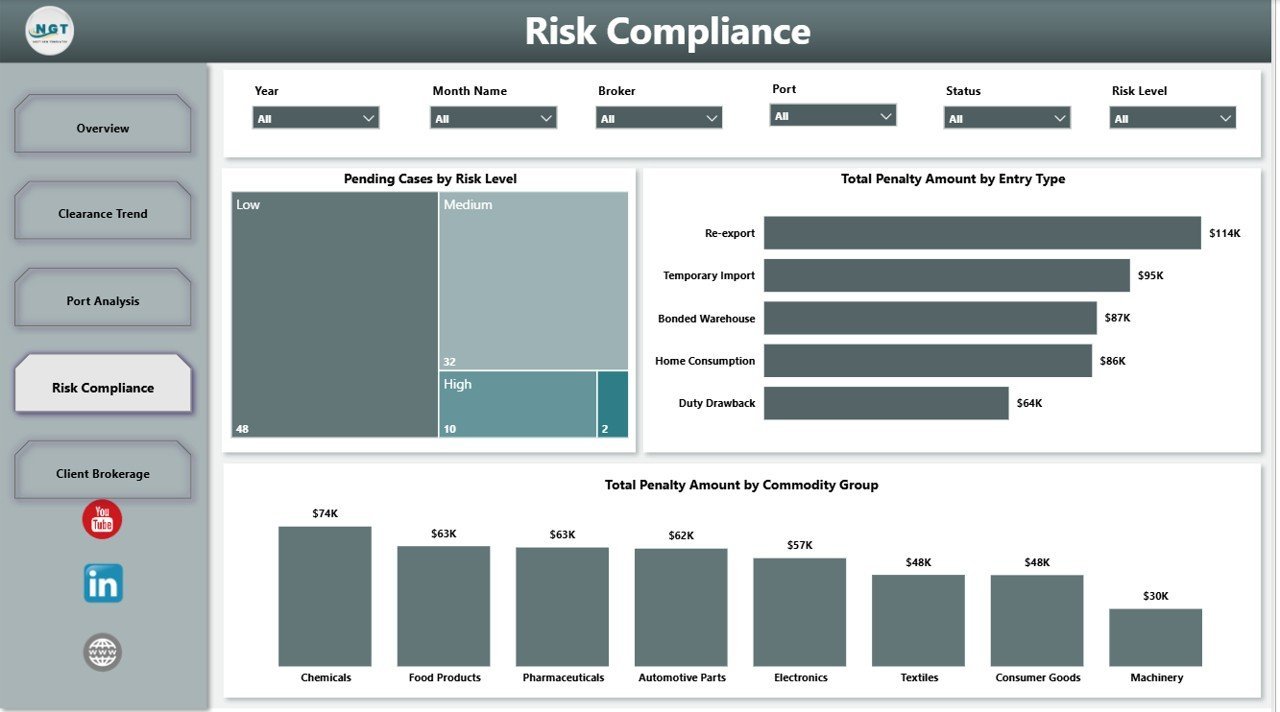
4. Risk Compliance
The Risk Compliance page connects pending workload with penalty exposure. Pending Cases by Risk Level helps teams prioritize the riskiest open files, while Total Penalty Amount by Entry Type and Total Penalty Amount by Commodity Group show where compliance costs are coming from.

Risk Compliance
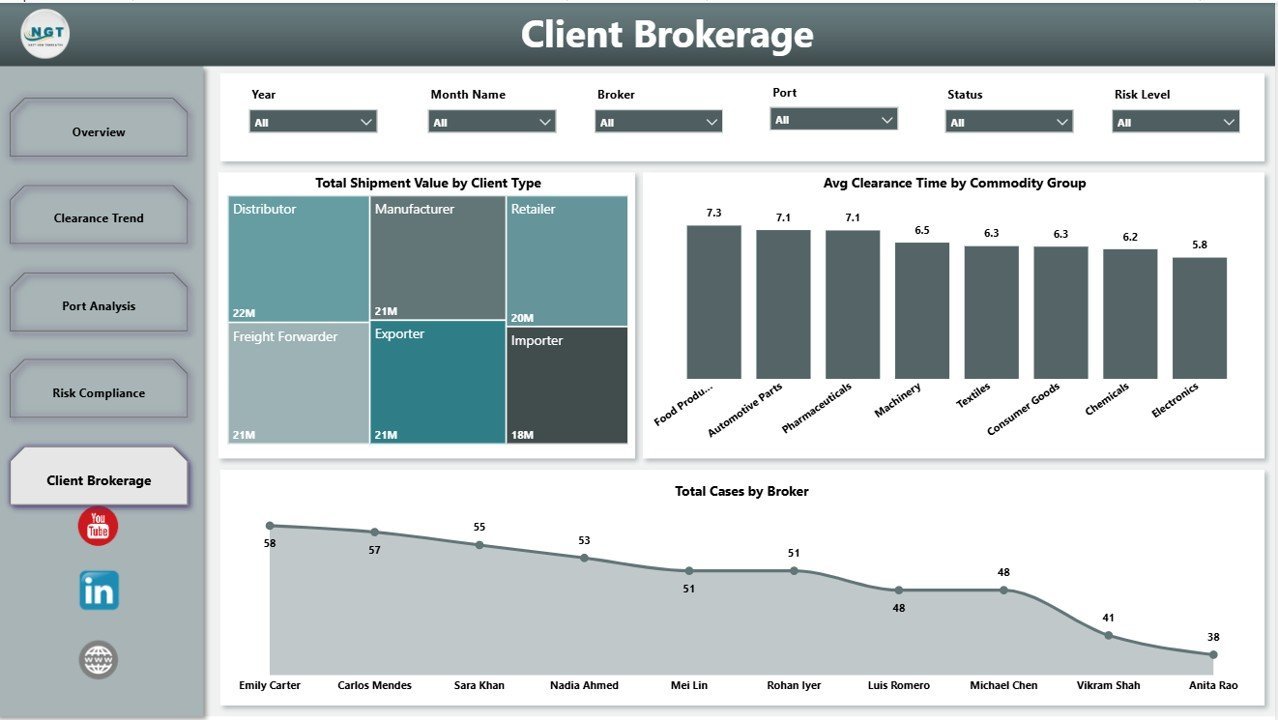
5. Client Brokerage
The Client Brokerage page focuses on client mix, commodity processing, and broker workload. Total Shipment Value by Client Type shows which client groups drive value, Avg Clearance Time by Commodity Group reveals categories that take longer to clear, and Total Cases by Broker compares broker workload.

Client Brokerage
Customs Clearance Agencies Dashboard in Power BI vs. Tableau vs. Paid Logistics SaaS – Where This Fits
| Feature | This Power BI Dashboard | Tableau Alternative | Paid Logistics SaaS |
|---|---|---|---|
| Cost | $17.99 one-time | License cost may apply | Monthly or annual subscription |
| Platform | Power BI Desktop and Power BI Service | Tableau Desktop or Cloud | Vendor cloud platform |
| Setup time | Open PBIX and connect your data | Build or adapt workbook | Vendor onboarding and configuration |
| Customizable fields | Editable model, visuals, and measures | Editable with Tableau skills | Depends on vendor plan |
| Share with link | Yes, through Power BI Service | Yes, through Tableau Cloud/Server | Usually included |
| Year-1 cost at 5 users | $17.99 plus any Microsoft licensing you already use | Often higher for paid seats | Often hundreds or thousands of dollars |
| Customs clearance metrics | Pre-built for cases, value, duties, penalties, ports, lanes, and brokers | Manual setup needed | May require configuration |
Who This Template Is For – and Who It’s Not For
This template is for customs clearance agencies, customs brokers, freight forwarders, import-export businesses, compliance analysts, brokerage managers, logistics consultants, and finance teams that need a repeatable Power BI reporting layer for clearance operations.
It is not a live government filing system, customs declaration portal, EDI integration, or shipment tracking API. If you need automated filing or live customs authority connectivity, use this dashboard as the management analytics layer beside your operational systems.
How to Use the Customs Clearance Agencies Dashboard in Power BI
- Download and unzip the product file.
- Open the PBIX file in Microsoft Power BI Desktop.
- Review the sample data structure and replace it with your customs clearance data source.
- Map fields such as shipment value, duty amount, service fee, penalty amount, status, risk level, country lane, port, shipment mode, client type, broker, commodity group, and month.
- Refresh the model and review all 5 report pages.
- Use slicers to filter dashboard pages during team meetings, client reviews, and compliance checks.
- Publish to Power BI Service if your team wants controlled online access and scheduled refresh.
Real-World Use Cases
Arjun, Brokerage Operations Manager: Arjun checks Total Cases by Status and Pending Cases by Risk Level every morning to identify delayed files and prioritize high-risk work before client calls begin.
Meera, Trade Compliance Lead: Meera reviews penalty amount by entry type and commodity group to find recurring compliance issues, then uses those insights for documentation training.
Daniel, Finance Analyst: Daniel tracks shipment value by month, quarter, port, and client type before monthly profitability and duty exposure reviews.
Frequently Asked Questions
Do I need Power BI Desktop to use this dashboard?
Yes. Open the PBIX file in Power BI Desktop, which is available from Microsoft. You can then edit, refresh, and publish the dashboard if needed.
Can I connect this dashboard to my own customs data?
Yes. Replace or connect the sample data with your own source and map the required fields for cases, values, duties, fees, penalties, risk, status, ports, lanes, clients, brokers, and commodities.
What pages are included?
The file includes Overview, Clearance Trend, Port Analysis, Risk Compliance, and Client Brokerage pages.
Can I customize the visuals and colors?
Yes. The PBIX file is editable, so you can change charts, colors, labels, measures, and report layout in Power BI Desktop.
Is this a SaaS subscription?
No. This is a one-time purchase template. Any Microsoft Power BI licensing for sharing or cloud refresh is separate from this template.
Does it handle customs filings automatically?
No. It is an analytics dashboard, not a filing platform. Use it to analyze operations, risks, penalties, and performance from your own data.
About the Author
Built by PK – Microsoft Certified Professional with 15+ years of Excel, Google Sheets, and Power BI experience. Founder of NextGenTemplates, reaching 300K+ subscribers across YouTube channels. Every template is hand-built and tested before release.
Explore Related Templates
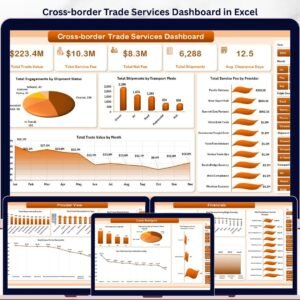
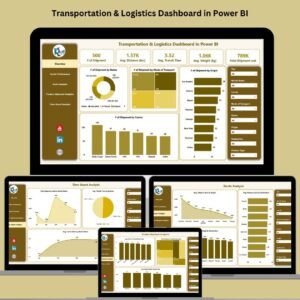
Explore more Power BI Dashboard Templates and logistics-friendly templates on NextGenTemplates. Related products include Customs Clearance Agencies Dashboard in Excel, Cross-border Trade Services Dashboard in Excel, and Trucking and Logistics Dashboard in Excel.
Click here to read the detailed blog post
Ready to analyze customs clearance performance in Power BI? Download the Customs Clearance Agencies Dashboard in Power BI, connect your clearance data, refresh the model, and start reviewing cases, duties, fees, penalties, ports, lanes, clients, and brokers today.
Last updated: May 24, 2026


Reviews
There are no reviews yet.