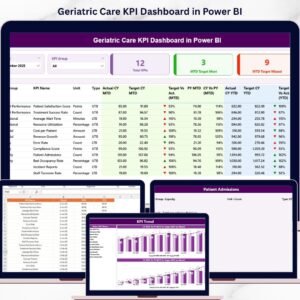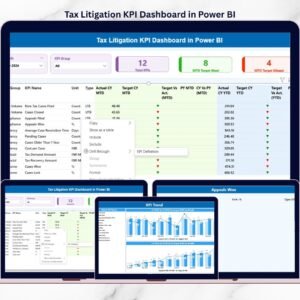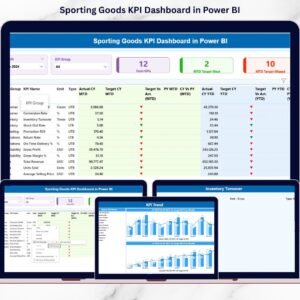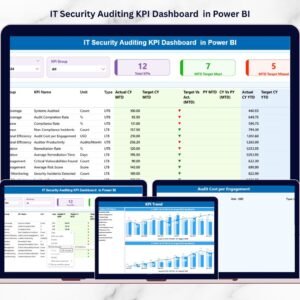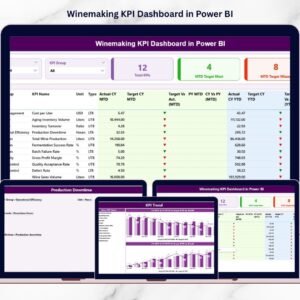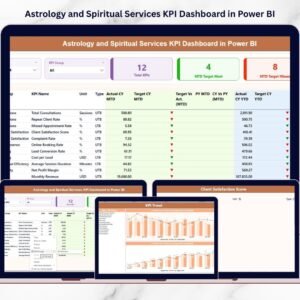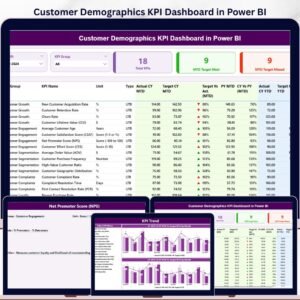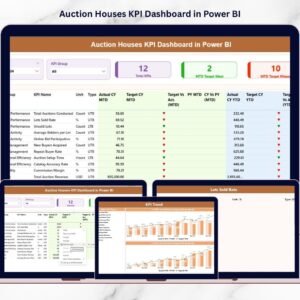
Copywriting & Content Creation KPI Dashboard in Power BI In the digital age, every word counts. ✨ Whether it’s storytelling, SEO-optimized blogs, or brand campaigns — content fuels visibility, engagement, and growth. Copywriting & Content Creation KPI Dashboard in Power BI But how do you measure if your content strategy is truly working?
Introducing the Copywriting & Content Creation KPI Dashboard in Power BI — a dynamic, interactive, and data-driven tool designed to turn creativity into measurable performance. 🚀
This ready-to-use Power BI dashboard helps marketers, content writers, and creative teams monitor productivity, quality, engagement, and results — all in one place. It connects to a structured Excel data source and automatically visualizes Month-to-Date (MTD), Year-to-Date (YTD), and Previous Year (PY) performance.
Built with Power BI’s smart visualizations, this dashboard simplifies content tracking, offering a clear path from idea to impact.
⚙️ Key Features of Copywriting & Content Creation KPI Dashboard in Power BI
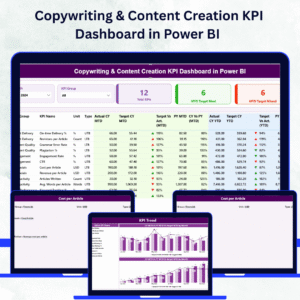
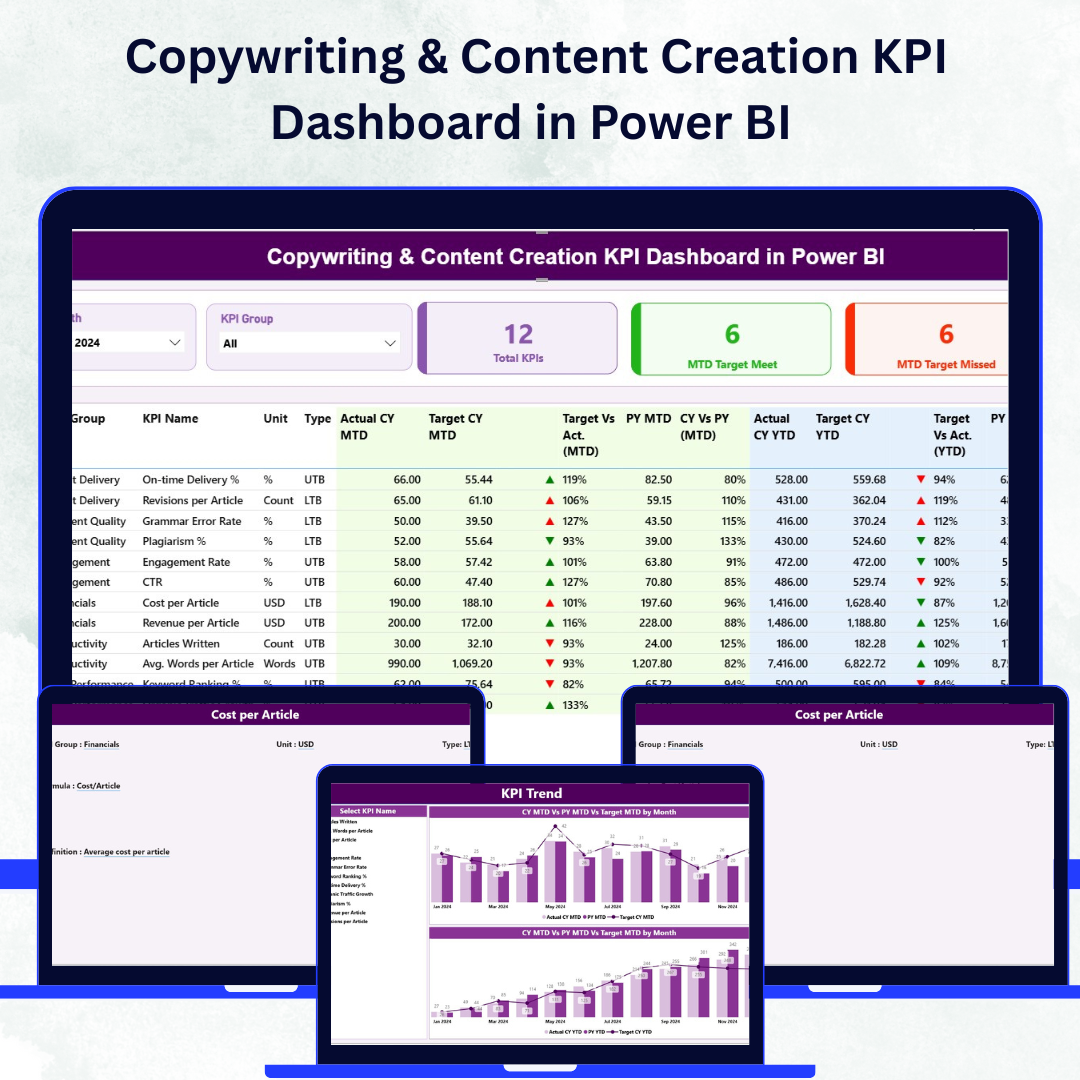
📊 Three Insightful Pages – Summary, KPI Trend, and KPI Definition for full visibility.
🎯 MTD & YTD Tracking – Evaluate short-term and long-term performance with ease.
📈 Actual vs Target Comparison – Quickly identify which KPIs are on track or underperforming.
🟢 Dynamic Visual Indicators – Green ▲ for success, Red ▼ for areas that need attention.
📅 Interactive Filters & Slicers – Filter data by month or KPI group instantly.
📘 Excel-Powered Data Source – Connect seamlessly for automatic updates.
📍 Drill-Through Capability – Right-click a KPI to view its detailed definition and formula.
💡 Customizable Metrics – Add, remove, or redefine KPIs as your content strategy evolves.
📤 Shareable Insights – Publish, export, or share the dashboard across teams and stakeholders.
📦 What’s Inside the Dashboard
The dashboard includes three Power BI pages and a structured Excel workbook that feed real-time data into your visuals.
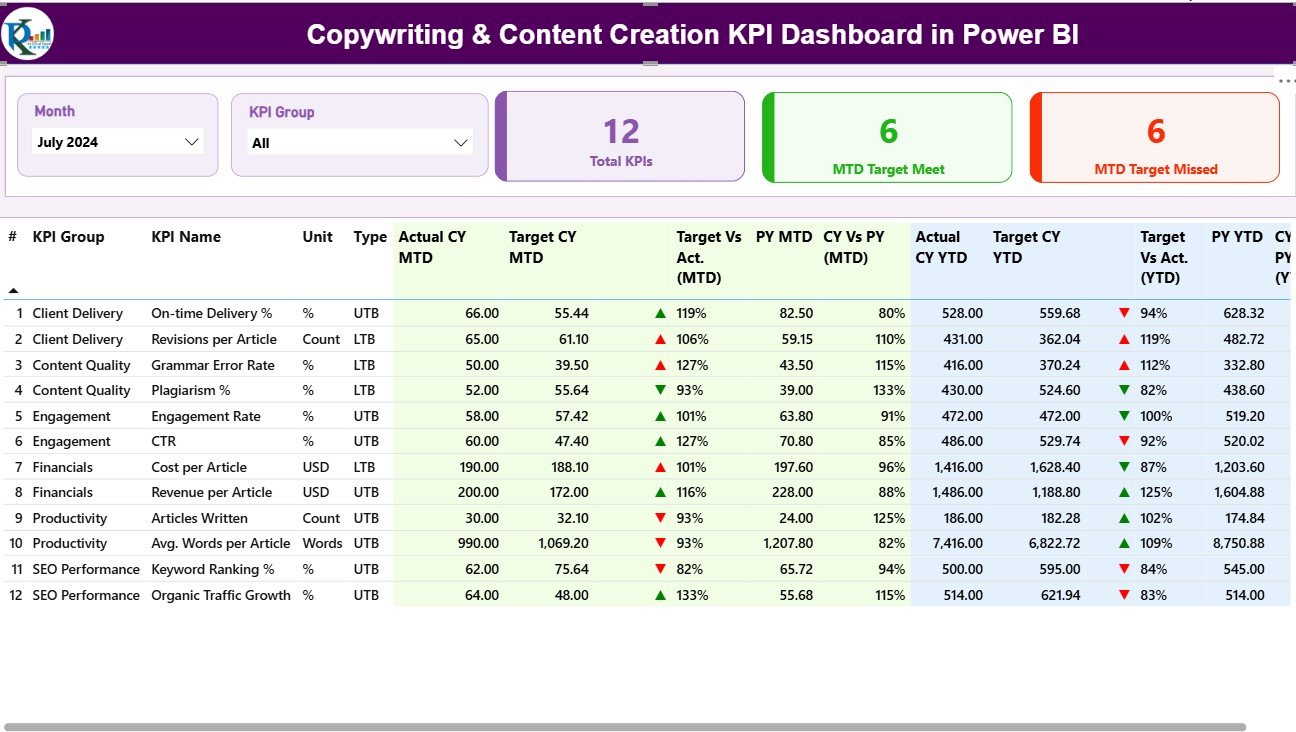
1️⃣ Summary Page – Performance Overview
View total KPIs, MTD Target Met, and Target Missed counts.
See all KPIs in one glance: KPI Group, Name, Unit, Actual, Target, PY, and comparison arrows.
Instantly detect which KPIs need focus with color-coded visuals and performance percentages.
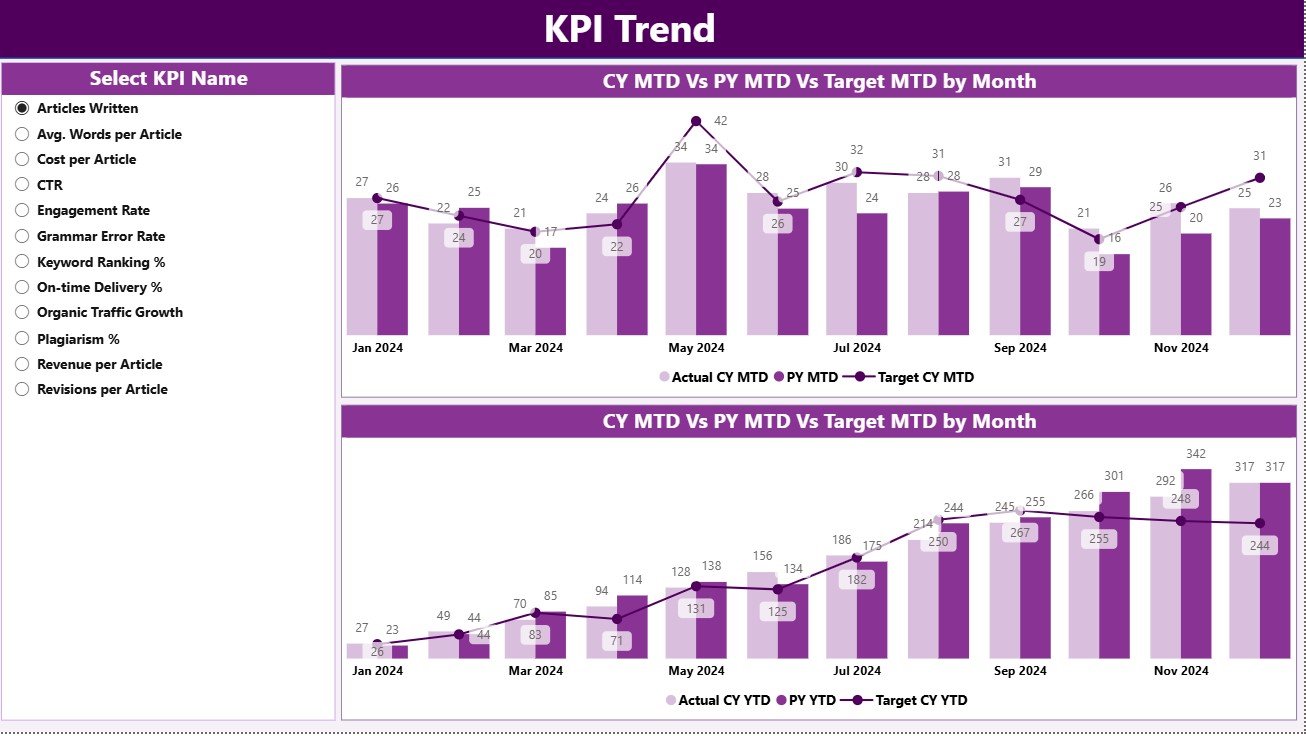
2️⃣ KPI Trend Page – Analyze Month-by-Month Progress
Combo charts show Actual, Target, and PY trends for both MTD and YTD metrics.
A slicer lets you pick any KPI to deep dive into historical performance.
Perfect for tracking improvement in writing efficiency, engagement, or quality scores.
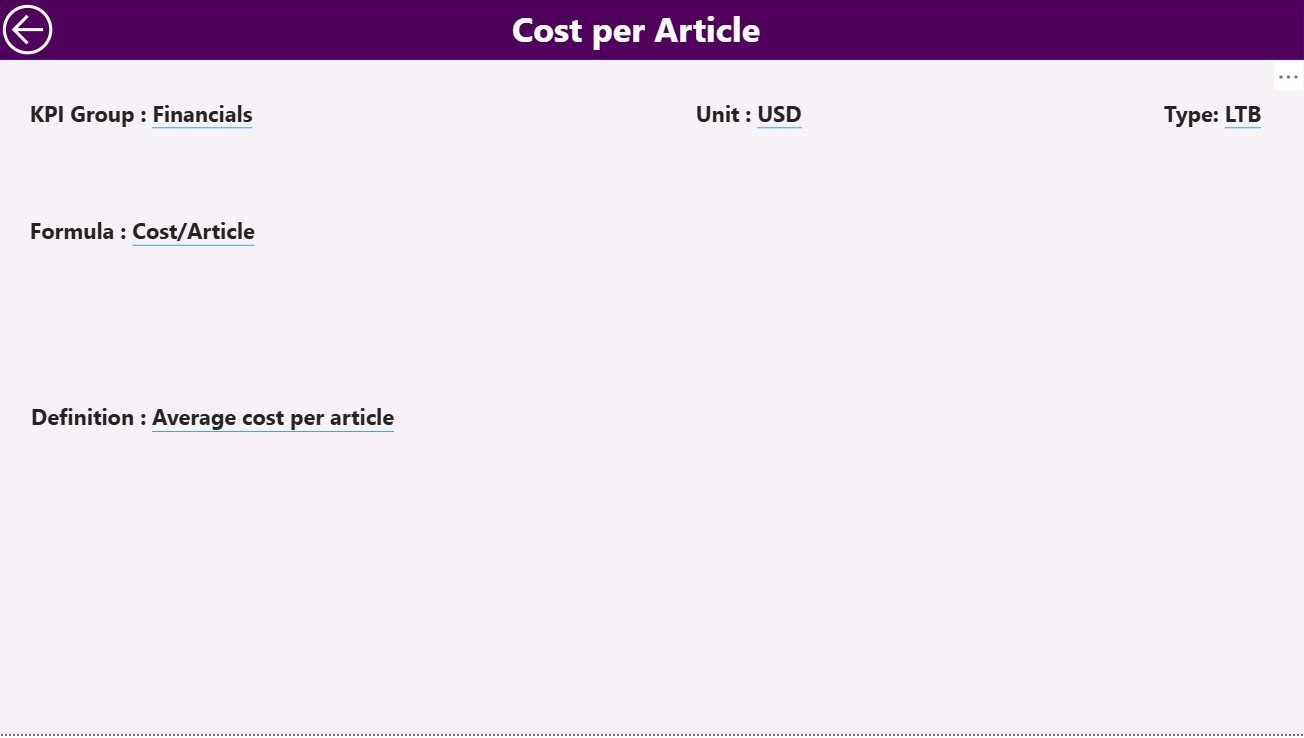
3️⃣ KPI Definition Page – Complete Transparency
Displays all KPIs with their Group, Unit, Formula, Definition, and Type (LTB/UTB).
Drill-through from the main page for deeper insights.
Includes a handy “Back” button for seamless navigation.
📘 Excel Data Source Structure
The dashboard connects to a three-sheet Excel workbook:
Input Actual Sheet: Captures monthly actual data (KPI Name, Month, MTD, YTD).
Input Target Sheet: Records MTD and YTD targets for each KPI.
KPI Definition Sheet: Documents all KPI attributes for alignment and clarity.
This structure ensures accurate, automated, and consistent data management.
🧭 How to Use the Copywriting & Content Creation KPI Dashboard
🪄 Step 1: Enter Actual and Target values in Excel each month.
📂 Step 2: Open the Power BI file and click Refresh to update visuals automatically.
🎯 Step 3: Use slicers (Month or KPI Group) to customize views.
📊 Step 4: Drill through to see KPI formulas and definitions.
📈 Step 5: Review trends to identify performance improvements and areas for growth.
📤 Step 6: Share or publish reports with your team for collaborative decision-making.
Within minutes, you’ll have a live performance snapshot of your content team — no manual reporting required. 🧠
👥 Who Can Benefit from This Dashboard
🧑💼 Marketing Managers – Track campaign efficiency, SEO success, and engagement KPIs.
✍️ Content Writers & Copywriters – Measure writing quality, turnaround time, and output.
📅 Content Strategists – Align content goals with organizational performance.
📊 Team Leaders & Editors – Monitor accuracy, readability, and productivity trends.
🏢 Agencies & Businesses – Showcase performance metrics in client presentations.
Whether you’re managing a small writing team or a large content department, this dashboard transforms raw data into clarity and control.