


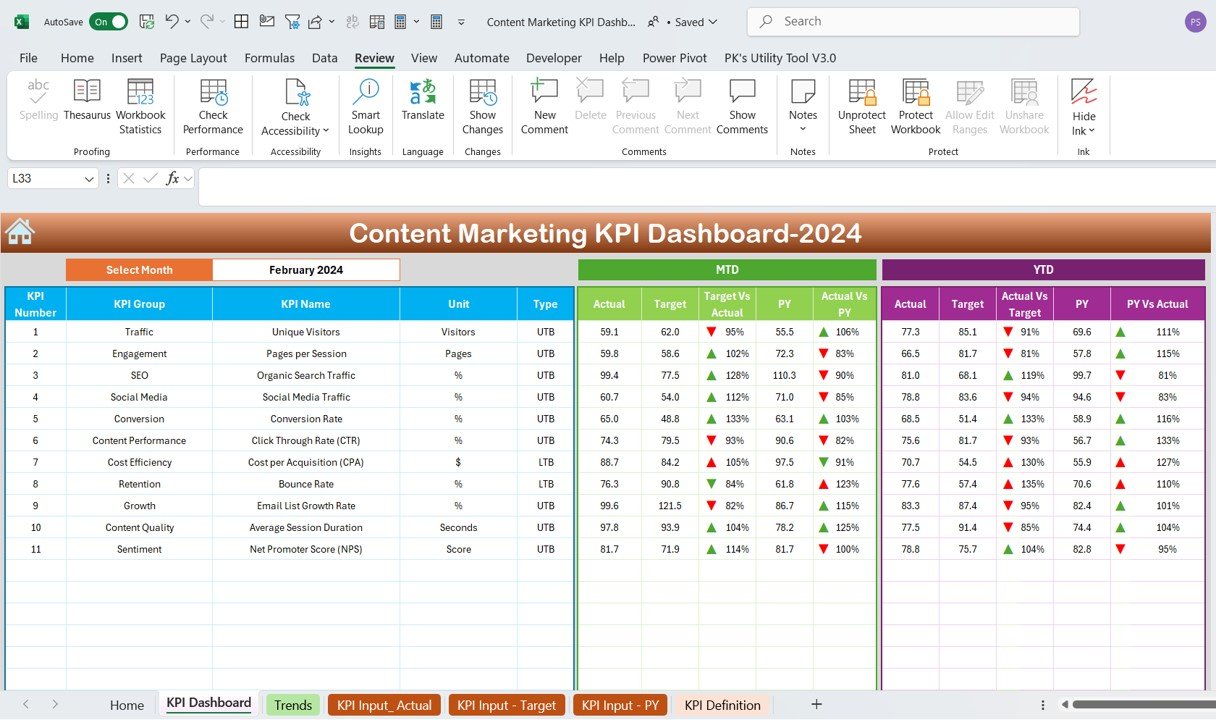



The Content Marketing KPI Dashboard in Excel is an essential tool for content marketers, agencies, and businesses looking to track, measure, and optimize their content marketing efforts. This interactive dashboard enables you to monitor key performance indicators (KPIs) such as website traffic, engagement, conversion rates, and content ROI, all in one place.
With a user-friendly interface and powerful visualizations, this Excel-based dashboard helps you evaluate the effectiveness of your content marketing strategy, identify areas for improvement, and make data-driven decisions to achieve better results. Whether you’re managing blog posts, social media campaigns, or other types of content, this tool makes it easy to stay on top of your content performance.
Key Features of the Content Marketing KPI Dashboard in Excel
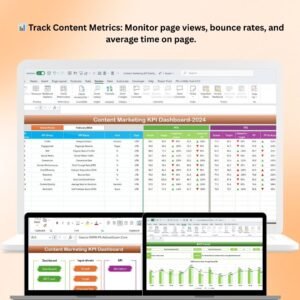
📊 Track Content Performance Metrics
Monitor key metrics such as page views, bounce rates, average time on page, and conversions to measure the effectiveness of your content. Track how well each piece of content is performing and identify high-performing content that drives traffic.
📈 Measure Engagement & Interaction
Track content engagement metrics such as comments, social shares, likes, and user interactions. Measure how well your content resonates with your audience and optimize based on performance data.
💡 Monitor Content ROI
Evaluate the ROI of your content marketing efforts by comparing revenue generated through content-driven channels to the cost of content creation and promotion. Ensure that your content marketing strategy is financially efficient.
📅 Content Calendar & Scheduling
Plan, schedule, and track your content publication schedule using the built-in content calendar. Stay organized and ensure you’re delivering content on time and as planned.
📥 Conversion Tracking
Monitor how well your content is converting visitors into leads or customers. Track conversion rates from landing pages, blogs, or other content pieces and optimize for higher conversion rates.
🖥️ Customizable & Interactive Layout
This Excel dashboard is fully customizable to suit your specific content marketing needs. Filter data by content type, time period, or campaign to gain deeper insights into your marketing performance.
Why You’ll Love the Content Marketing KPI Dashboard in Excel
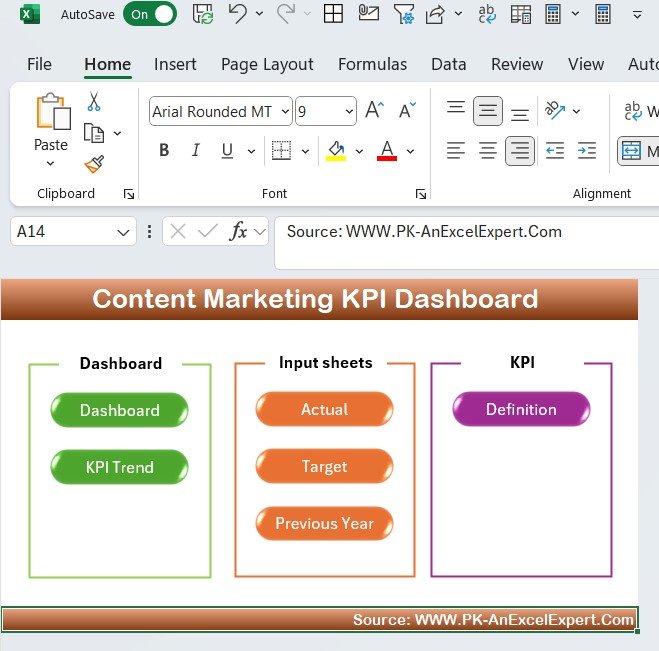
✅ Optimize Content Strategy
Track key performance metrics across your content to identify what works and what doesn’t. Optimize your content strategy to drive more traffic and conversions.
✅ Measure Content Effectiveness
Monitor content performance in real-time. Use the data to improve your content creation process and ensure that your content meets business goals and objectives.
✅ Increase Engagement & Interaction
Evaluate audience engagement metrics and use the insights to enhance content, increase user interaction, and build stronger relationships with your audience.
✅ Maximize ROI on Content Marketing
Track the ROI of your content marketing campaigns and ensure that your efforts are generating revenue. Identify areas to improve and maximize returns on content investment.
✅ Fully Customizable & Scalable
The dashboard is fully customizable to meet the needs of your business. Adjust metrics, content types, and reports to focus on what matters most to your content strategy.
What’s Inside the Content Marketing KPI Dashboard Template in Excel?
- Content Performance Metrics: Track page views, bounce rates, and time on page.
- Engagement Monitoring: Track likes, shares, and user interactions with your content.
- Content ROI Analysis: Measure revenue generated against content creation costs.
- Content Calendar: Plan, schedule, and track content publishing dates.
- Conversion Tracking: Monitor conversion rates and optimize content for lead generation.
- Customizable Filters & Reports: Adjust data filters, metrics, and visuals to meet your marketing goals.
How to Use the Content Marketing KPI Dashboard in Excel
1️⃣ Download the Template: Access the Content Marketing KPI Dashboard in Excel instantly.
2️⃣ Input Your Content Data: Enter your content performance data, including page views, engagement metrics, and conversion rates.
3️⃣ Track & Monitor KPIs: Use the dashboard to monitor and measure content performance and ROI.
4️⃣ Analyze & Optimize Content: Use insights to optimize your content strategy for better engagement, higher traffic, and increased conversions.
5️⃣ Generate Reports & Insights: Create customized reports to share with stakeholders or clients.
Who Can Benefit from the Content Marketing KPI Dashboard in Excel?
🔹 Content Marketers & Digital Marketers
🔹 Marketing Agencies & Freelancers
🔹 E-commerce Businesses & Online Brands
🔹 Content Creators & Bloggers
🔹 Social Media Managers
🔹 Business Owners & Executives
Track, measure, and optimize your content marketing efforts with the Content Marketing KPI Dashboard in Excel. Monitor performance, measure ROI, and boost your content strategy with valuable insights.
Click here to read the Detailed blog post
Visit our YouTube channel to learn step-by-step video tutorials
Youtube.com/@PKAnExcelExpert
Compatibility and Requirements
- Works in Microsoft Excel desktop (Excel 2016 or later, or Microsoft 365).
- Results show in interactive charts. Microsoft explains Excel charts in Create a chart from start to finish.
Frequently Asked Questions
Which KPIs does the Content Marketing KPI Dashboard track?
It tracks page views, bounce rates, average time on page, comments, shares, likes, conversion rates and content ROI.
Does it include a content calendar?
Yes. A built-in content calendar lets you plan, schedule and track publishing dates.
How is content ROI measured?
It compares revenue from content-driven channels with the cost of creating and promoting the content.
Can I filter by content type?
Yes. You can filter the data by content type, time period or campaign.
Is there a Power BI or Google Sheets version?
Yes. See the Content Marketing KPI Dashboard in Power BI and the Content Marketing KPI Dashboard in Google Sheets.
Related Content and SEO Templates
- Content Marketing KPI Dashboard in Power BI: the same KPIs in Power BI
- Content Marketing KPI Dashboard in Google Sheets: the same KPIs in Google Sheets
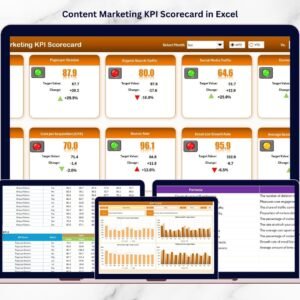
- Content Marketing KPI Scorecard in Excel: a scorecard view with targets
- SEO Performance KPI Dashboard in Excel: track rankings and organic traffic
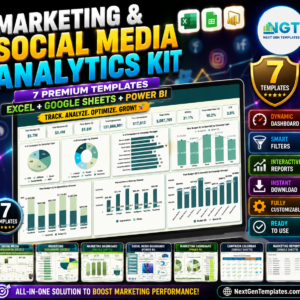
- Marketing and Social Media Analytics Kit: 7 marketing templates in one download
Browse all Excel KPI dashboards or the Excel sales and marketing templates.






























Reviews
There are no reviews yet.