

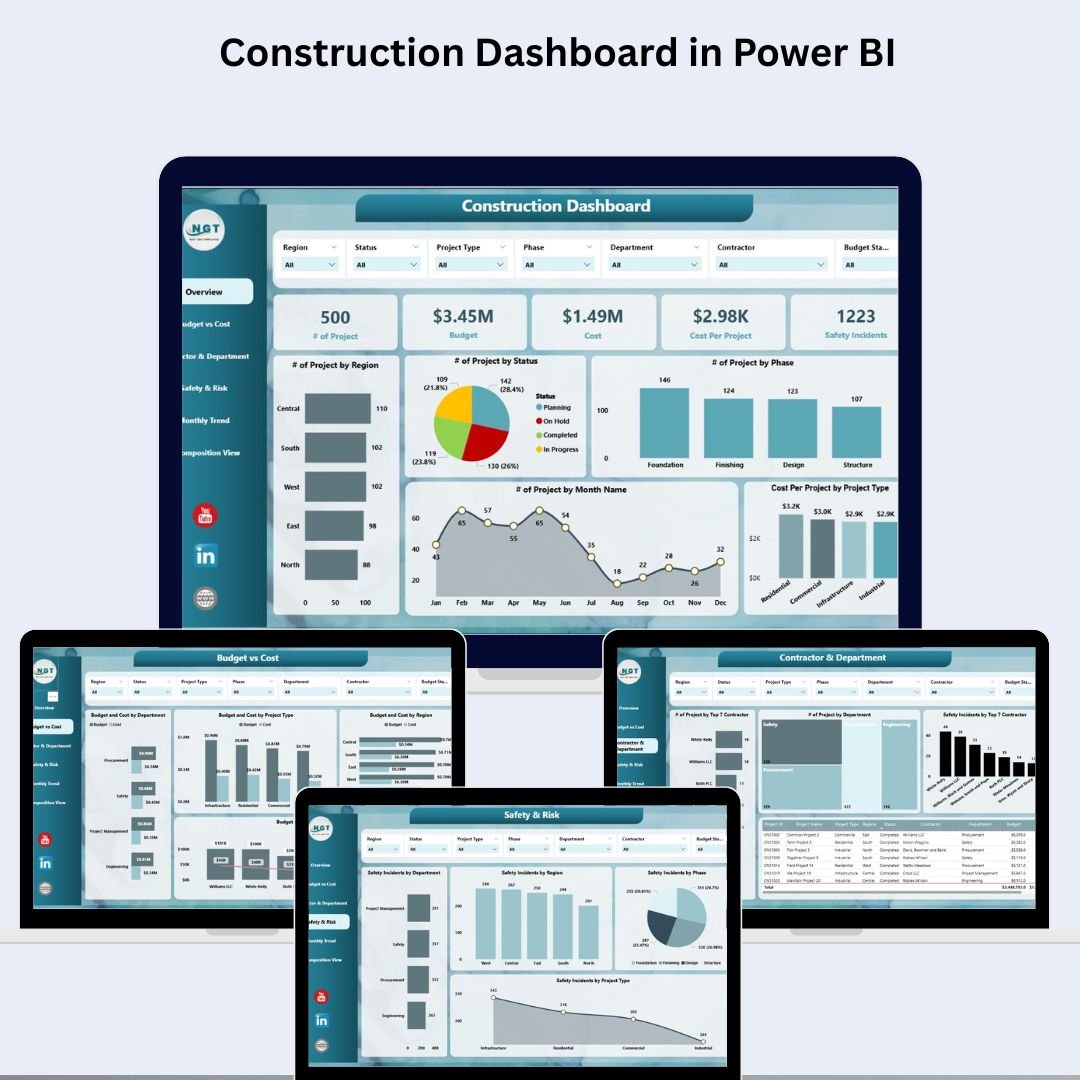
Managing multiple construction projects across departments, regions, and contractors can be overwhelming. That’s why the Construction Dashboard in Power BI is your ultimate solution — a ready-to-use dashboard that offers real-time insights, powerful visualizations, and data-driven decision-making capabilities for the construction industry.
Track budgets, monitor safety, and manage contractors effortlessly using this dynamic dashboard tailored for construction project managers, engineers, and executives.
📊 Key Features of the Construction Dashboard in Power BI
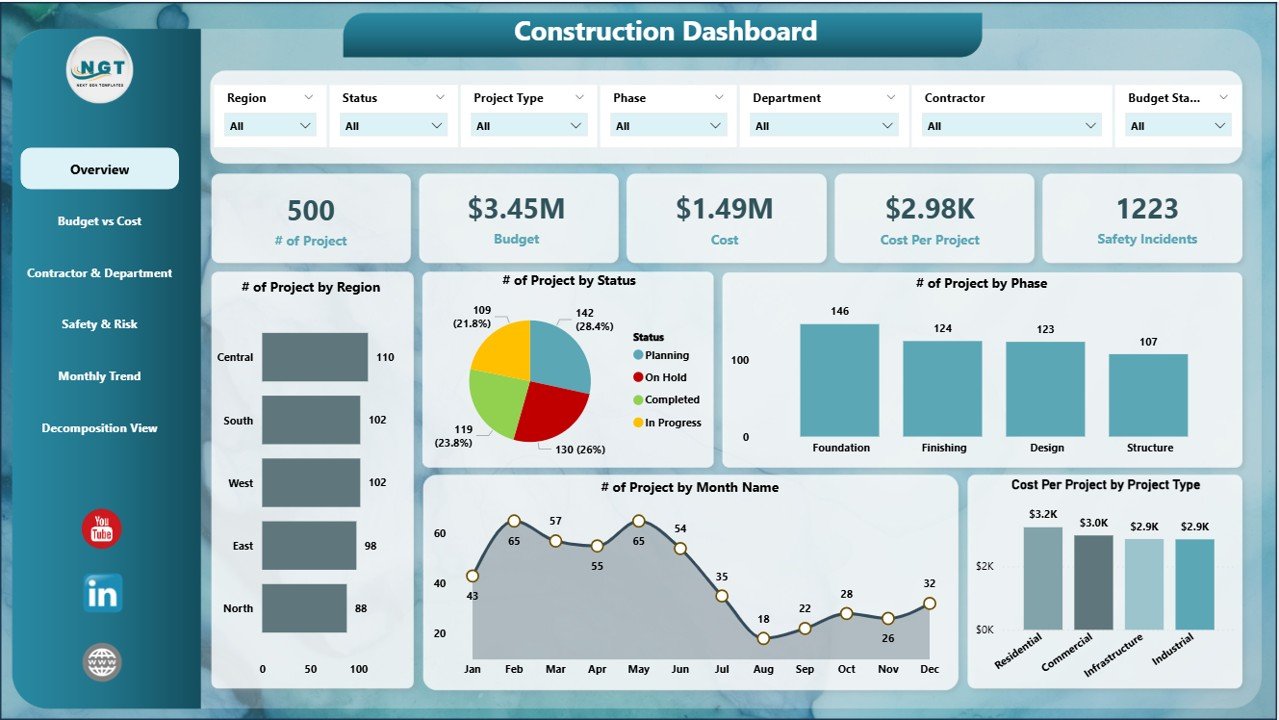
🧭 1. Overview Page – Snapshot of Your Construction Portfolio
Includes:
🔢 Cards: # of Projects, Budget, Cost, Cost per Project, Safety Incidents
📊 Charts: Projects by Region, Status, Phase, Month, Cost per Project by Type
Quickly assess your project spread, current status, and key KPIs at a glance.
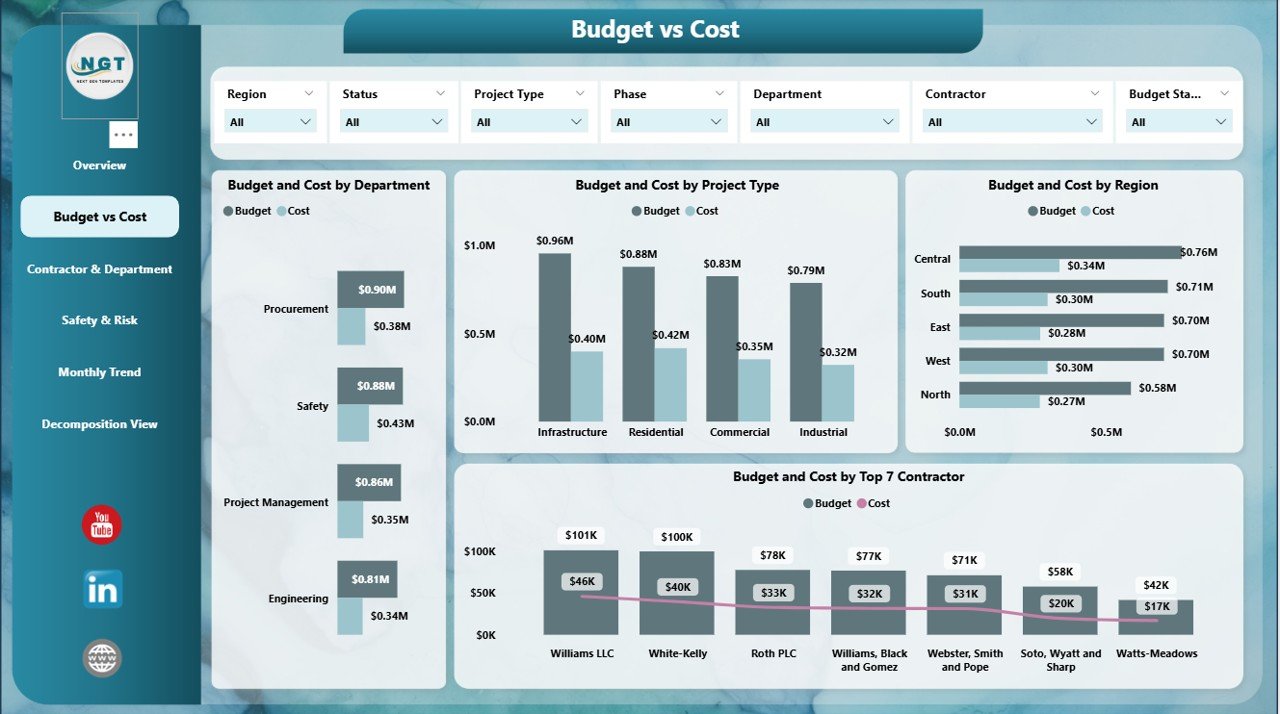
💰 2. Budget vs Cost Page – Keep Finances on Track
Includes:
📉 Budget & Cost by Department
🏢 Budget & Cost by Project Type
🌍 Budget & Cost by Region
👷♂️ Budget & Cost by Top 7 Contractors
Compare targets vs actuals and instantly identify budget overruns.
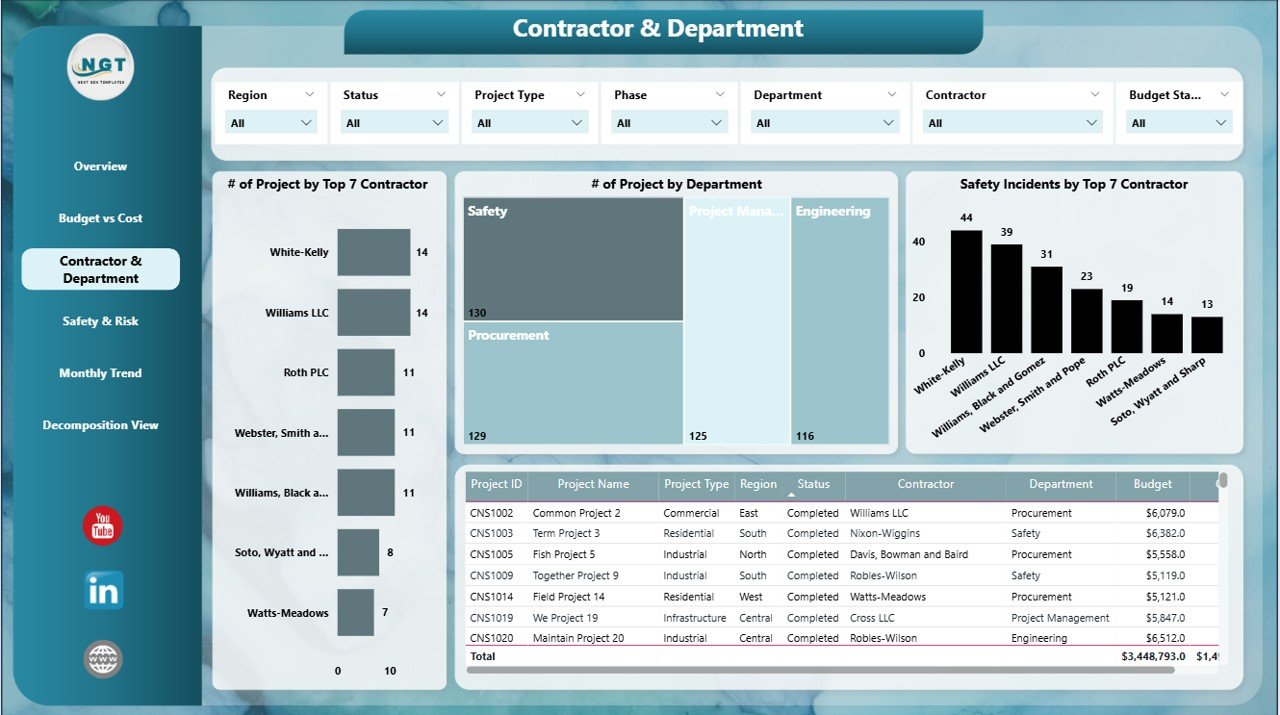
🛠️ 3. Contractor & Department Page – Performance Insights
Includes:
📋 Projects by Contractor & Department
⚠️ Safety Incidents by Contractor
Evaluate which teams are performing well and which require attention.
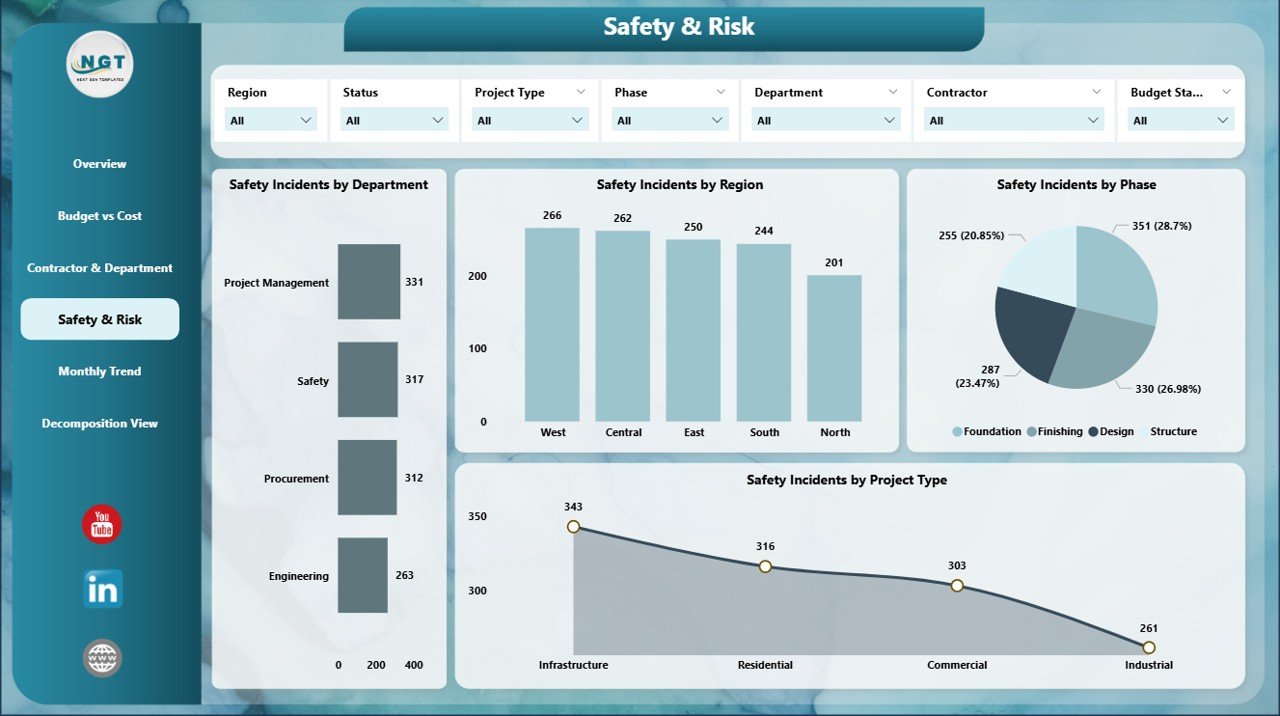
🦺 4. Safety & Risk Page – Monitor Incidents and Risks
Includes:
🚧 Safety Incidents by Department, Region, Phase, and Project Type
Stay proactive by tracking and mitigating safety risks across your sites.
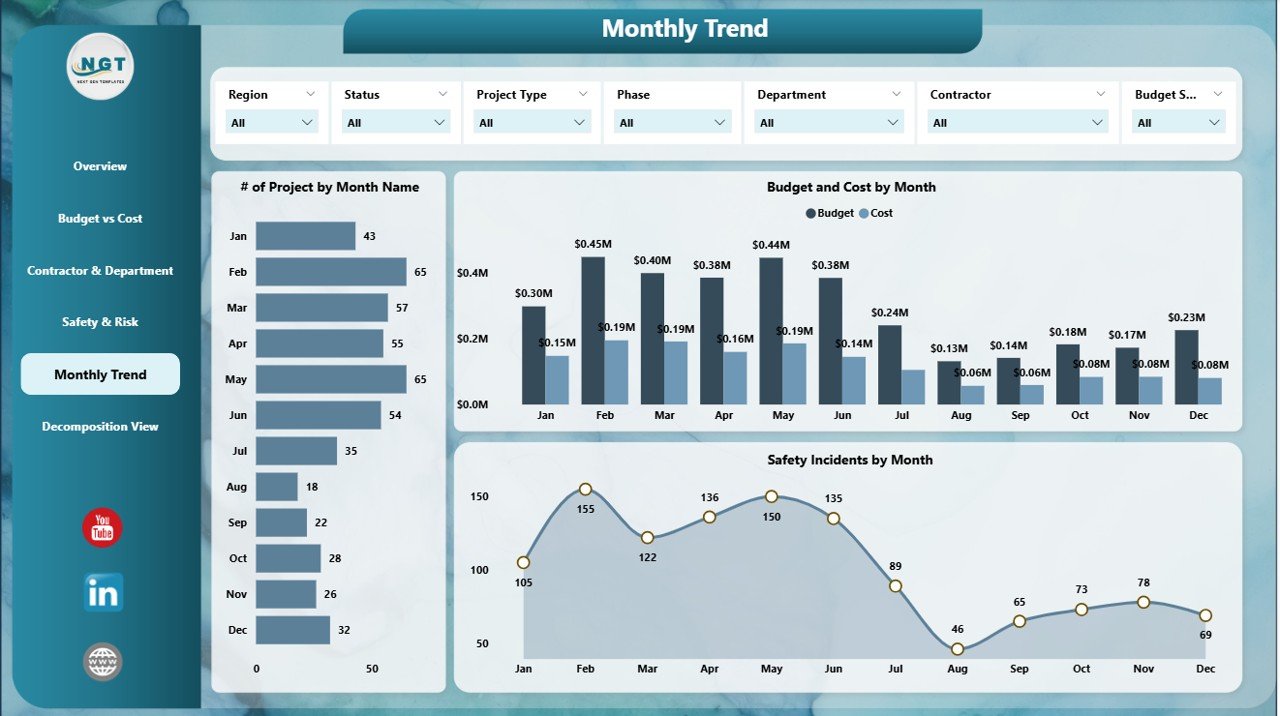
📈 5. Monthly Trend Page – Performance Over Time
Includes:
📅 Projects by Month
💸 Budget & Cost by Month
⚠️ Safety Incidents by Month
⏱️ Avg. Resolution Time
Track seasonal trends, delays, and improvements to guide better planning.
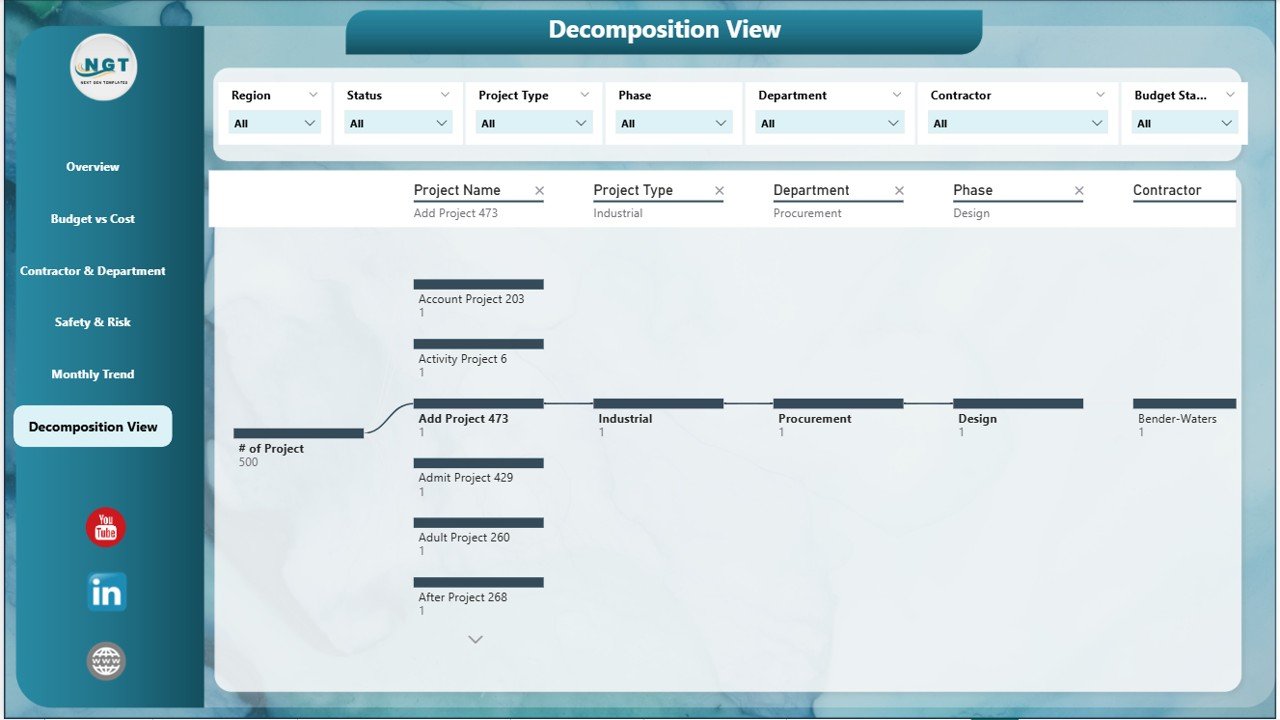
🔍 6. Decomposition View Page – Drill Down with Power BI
Explore the root causes and breakdowns in:
🏗️ Project Type
🧱 Project Phase
🌎 Region
👷 Contractor
Perfect for advanced users needing multi-dimensional analysis.
📦 What’s Inside the Dashboard?
✅ 6 Fully Designed Power BI Pages
✅ Linked Excel Data Model (Actuals + Targets + KPI Definitions)
✅ Cards, Charts, and Drill-down Visuals
✅ Dynamic Filters and Slicers for Instant Segmentation
✅ Shareable for Team Collaboration
✅ Completely Customizable
🛠️ How to Use This Dashboard
📥 Load your data into the provided Excel template
📊 Open the Power BI file (PBIX) – everything updates automatically
🔍 Use slicers for instant filtering by region, contractor, phase, etc.
👥 Share with stakeholders for real-time collaboration
✏️ Customize charts or add new metrics as needed
👥 Who Should Use This Dashboard?
🏗️ Construction Project Managers
🧑💼 Contractors & Site Engineers
🏢 Real Estate Developers
🧾 Finance & Procurement Officers
🦺 Safety Officers & Auditors
📈 PMO & CXOs overseeing capital projects
If you manage more than one project, this dashboard is a game-changer.
Click here read detailed blog post
📺 Watch the full walkthrough on our YouTube channel:
🔗 youtube.com/@PKAnExcelExpert












Reviews
There are no reviews yet.