Travel agencies operate in a dynamic, data-heavy, and highly competitive market. Every day, they manage bookings, destinations, agents, commissions, customer satisfaction, and revenue targets. Travel Agencies KPI Dashboard in Power BI However, when performance tracking depends on static Excel reports or manual summaries, insights arrive late and opportunities are missed. As a result, management decisions often become reactive instead of strategic.
That is exactly where the Travel Agencies KPI Dashboard in Power BI becomes a powerful, modern, and game-changing analytics solution.
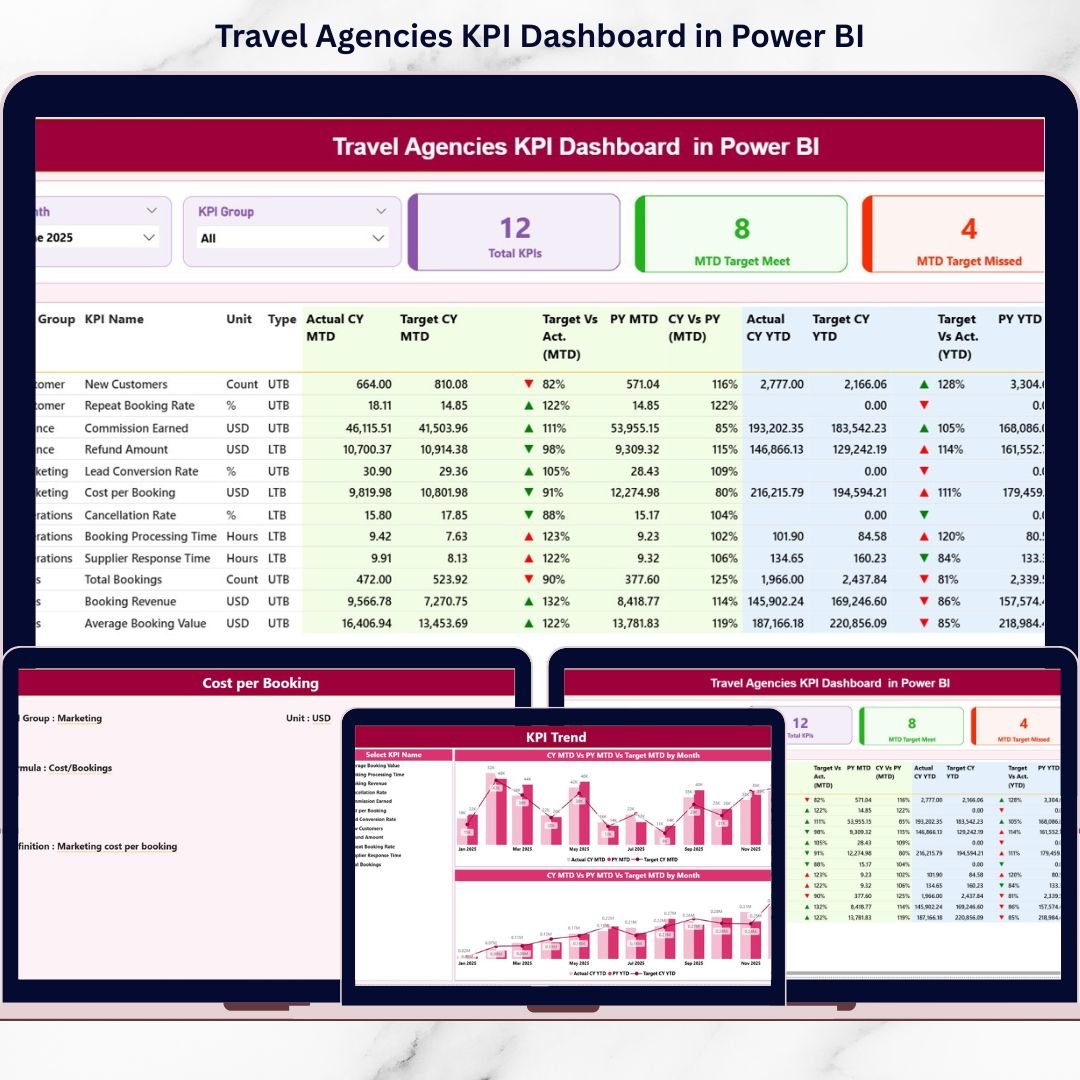
Travel Agencies KPI Dashboard in Power BI This ready-to-use Power BI dashboard is designed specifically for travel agencies that want real-time visibility, clear KPI tracking, and data-driven decision-making. Instead of reviewing multiple reports, managers get one centralized dashboard that displays MTD (Month-to-Date) and YTD (Year-to-Date) performance, target achievement, and year-over-year comparisons with clear visual indicators. As a result, leadership teams gain clarity, speed, and confidence in managing business performance.
✅ Key Features of Travel Agencies KPI Dashboard in Power BI
📊 Interactive KPI Dashboard
Track all travel agency KPIs in one centralized and interactive Power BI report.
🎛️ Dynamic Slicers
Filter data instantly using Month and KPI Group slicers.
🎯 MTD & YTD Performance Tracking
Monitor short-term and long-term performance in one view.
📈 Target vs Actual Analysis
Instantly identify whether KPIs are meeting targets.
📉 Previous Year Comparison
Analyze growth and decline using CY vs PY metrics.
🚦 Conditional Formatting Icons
Green and red arrows visually highlight performance direction.
📊 KPI Trend Analysis
Understand KPI movement over time using MTD and YTD trend charts.
🔍 Drill-Through KPI Details
Deep dive into KPI definitions, formulas, and context when needed.
📦 What’s Inside the Travel Agencies KPI Dashboard in Power BI
📄 Summary Page
This is the main page of the dashboard and provides an instant performance snapshot.
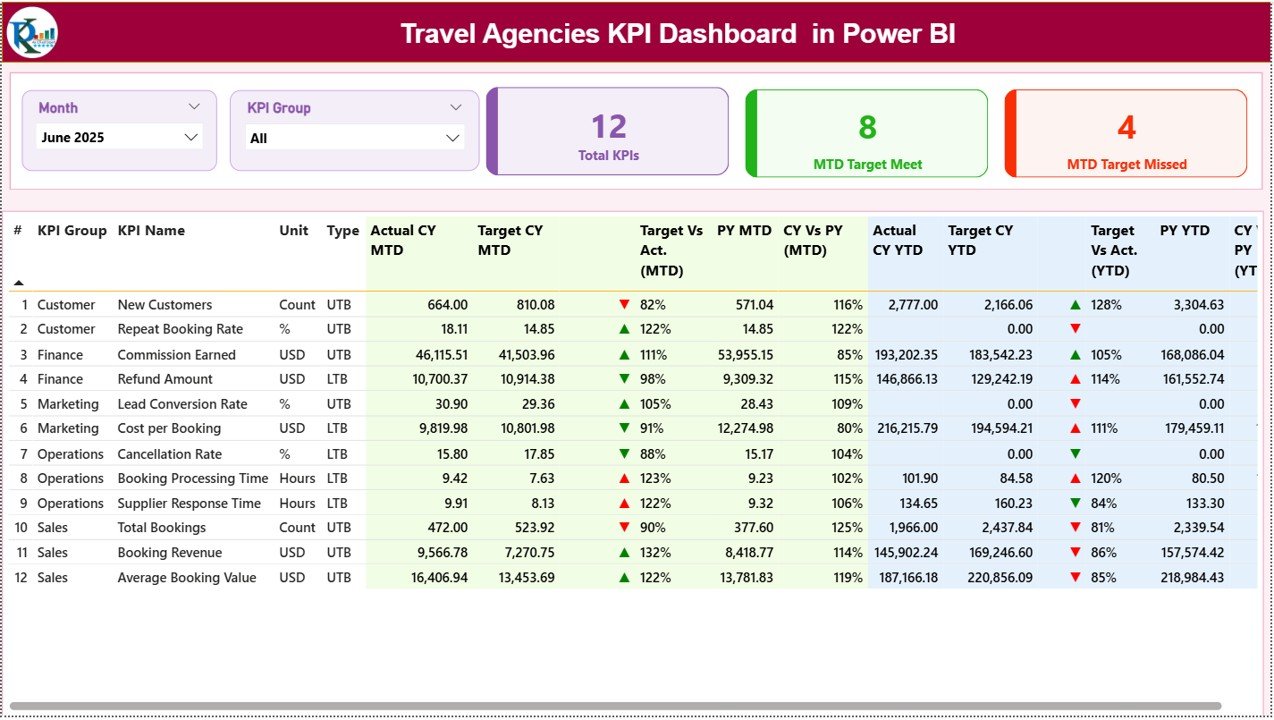
Top Slicers:
-
Month
-
KPI Group
KPI Summary Cards Display:
-
Total KPIs Count
-
MTD Target Meet Count
-
MTD Target Missed Count
Detailed KPI Table Shows:
-
KPI Number, Group, Name, Unit, Type (LTB/UTB)
-
MTD Actual, Target, PY, and variance (%)
-
YTD Actual, Target, PY, and variance (%)
-
Performance icons with ▲ / ▼ indicators
Because everything updates dynamically, users immediately spot strong and weak KPIs.
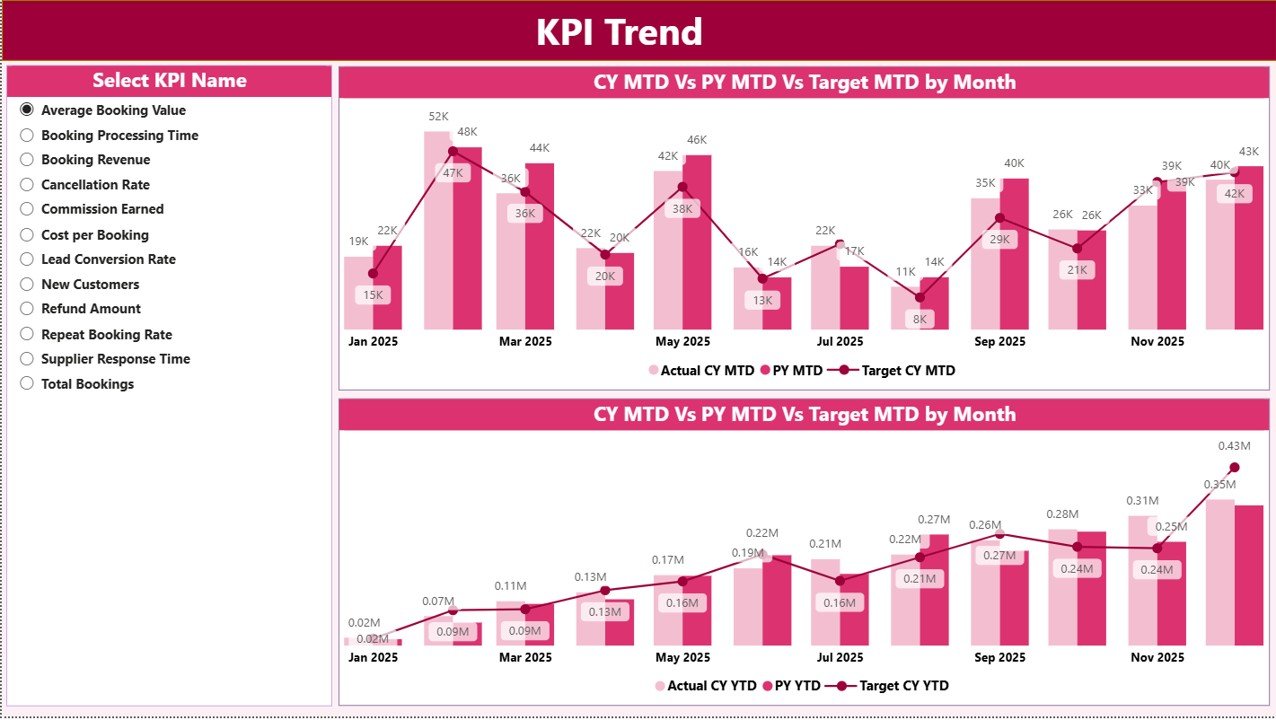
📈 KPI Trend Page
This page focuses on time-based KPI performance.
Visuals Included:
-
MTD Trend Combo Chart
-
YTD Trend Combo Chart
Each chart displays:
-
Current Year Actual
-
Previous Year Actual
-
Target values
Users select the KPI Name from a slicer, and charts update instantly making trend analysis clean and focused.
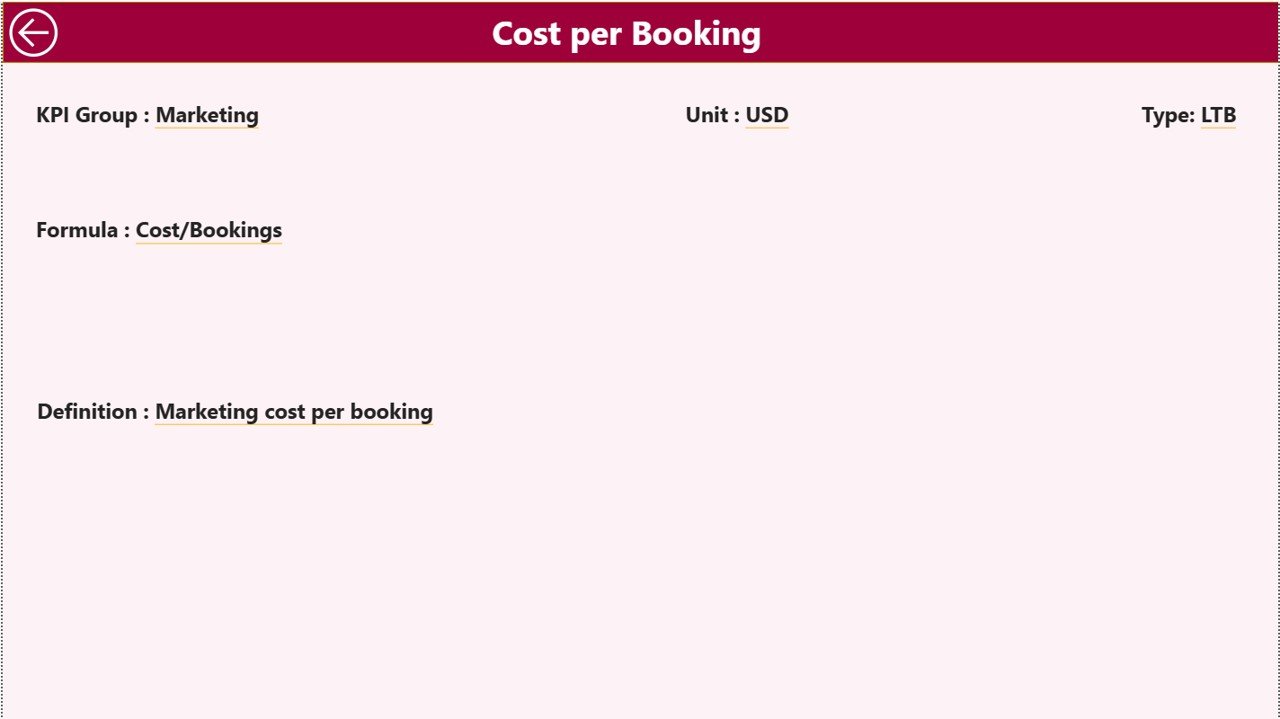
📘 KPI Definition Page (Drill-Through)
This hidden page stores KPI explanations.
Displayed Information:
-
KPI Formula
-
KPI Definition
-
KPI context
Users access it by right-clicking a KPI and using Drill-Through. A back button ensures smooth navigation.
🛠️ How to Use the Travel Agencies KPI Dashboard in Power BI
1️⃣ Enter actual KPI values in the Excel Input Actual sheet
2️⃣ Enter target values in the Input Target sheet
3️⃣ Maintain KPI definitions in the KPI Definition sheet
4️⃣ Load the Excel file into Power BI
5️⃣ Select Month and KPI Group using slicers
6️⃣ Review MTD and YTD performance instantly
7️⃣ Analyze trends and drill into KPI details
Because Power BI refreshes data quickly, users always see up-to-date insights.
👥 Who Can Benefit from This Travel Agencies KPI Dashboard
✈️ Travel Agency Owners
📊 Sales & Operations Managers
💼 Regional & Branch Heads
📈 Finance & Performance Teams
🏢 Small & Growing Travel Agencies
This dashboard scales easily as business complexity increases.
📘 Click here to read the Detailed blog post
▶️ Visit our YouTube channel to learn step-by-step video tutorials
👉 Youtube.com/@PKAnExcelExpert


