

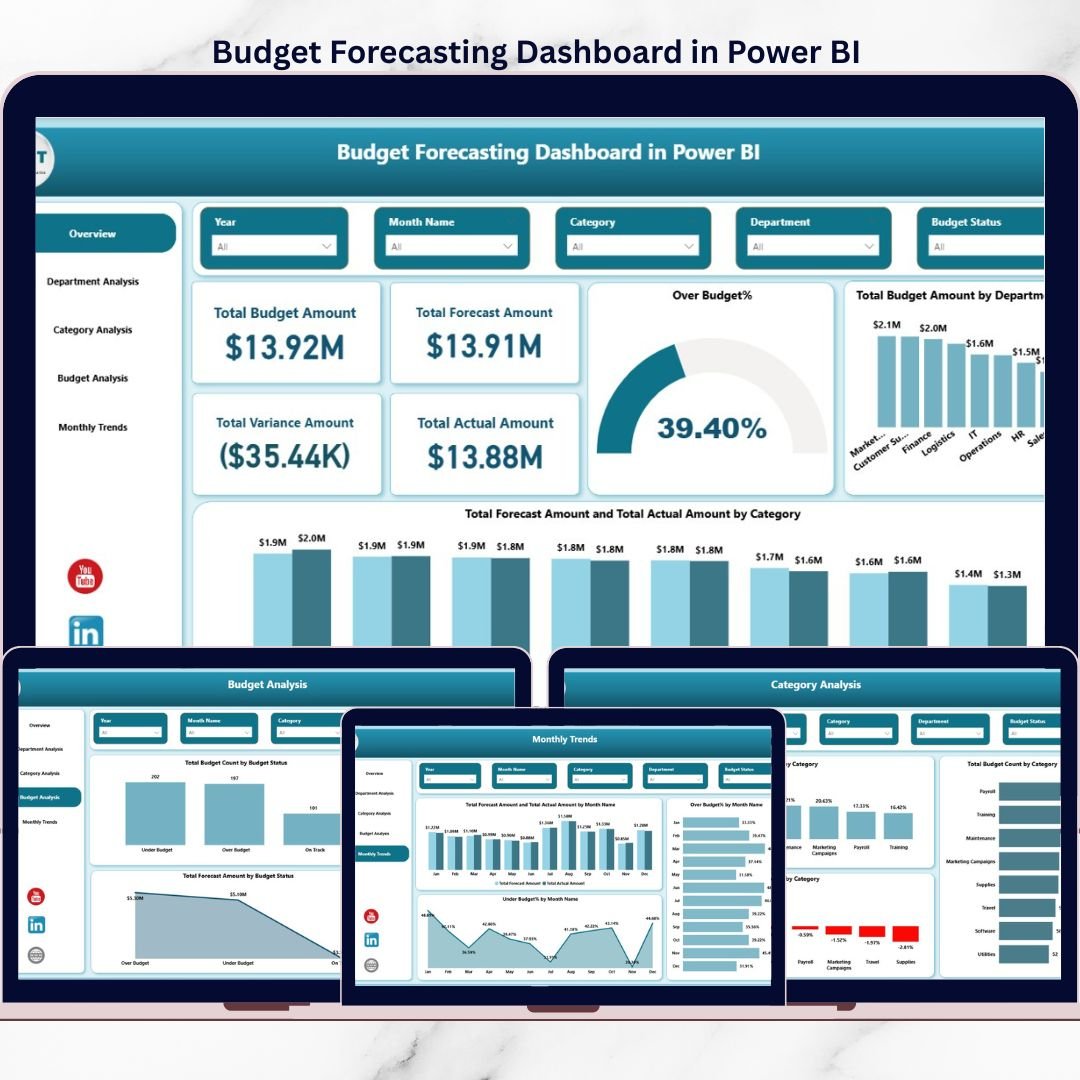

Budget planning should empower businesses, not slow them down. Yet many finance teams still struggle with scattered Excel files, manual calculations, and delayed reports. As a result, forecasting becomes inaccurate, overspending goes unnoticed, and leadership reacts too late.
That is exactly why the Budget Forecasting Dashboard in Power BI is a must-have solution for modern finance teams.
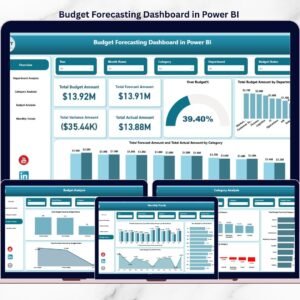
This ready-to-use Power BI dashboard transforms raw budget data into clear, interactive, and actionable insights. Instead of guessing where money is going, you get complete visibility into budgeted, forecasted, and actual performance—all in one place.
Designed for speed, clarity, and decision-making, this dashboard helps organizations move from reactive budgeting to proactive financial control.
## 🚀 Key Features of Budget Forecasting Dashboard in Power BI
📊 Real-Time Budget vs Forecast vs Actual Tracking
Instantly compare planned budgets, updated forecasts, and actual expenses without manual effort.
🏢 Department-Wise Financial Analysis
Identify which departments are overspending and which are managing budgets efficiently.
📂 Category-Level Cost Visibility
Track spending across categories like Marketing, IT, HR, Operations, and more.
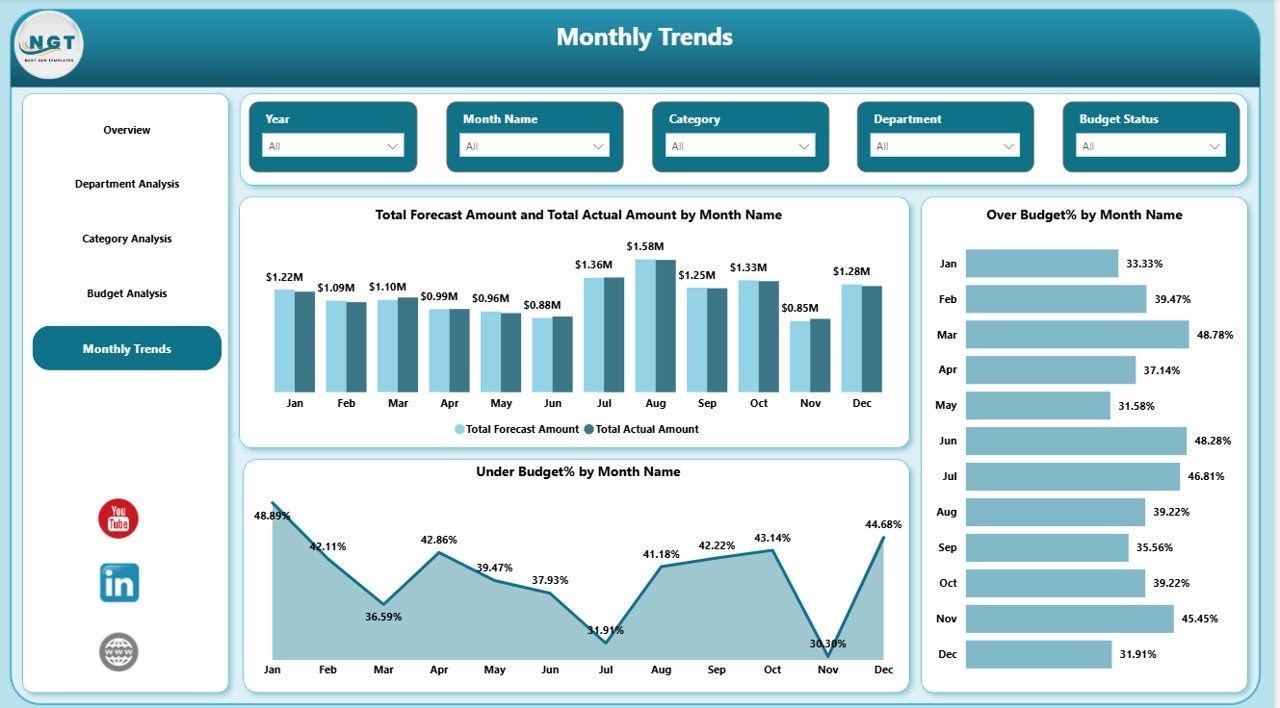
📅 Monthly Trend Analysis
Spot seasonal patterns, cost spikes, and recurring risks before they grow.
🚦 Budget Status Monitoring
Quickly identify on-track, under-budget, and over-budget items using visual indicators.
🎯 Interactive KPIs & Slicers
Filter insights instantly by department, category, or time period for deeper analysis.
## 📦 What’s Inside the Budget Forecasting Dashboard?
This digital product includes a professionally designed Power BI dashboard with 5 powerful analytical pages:
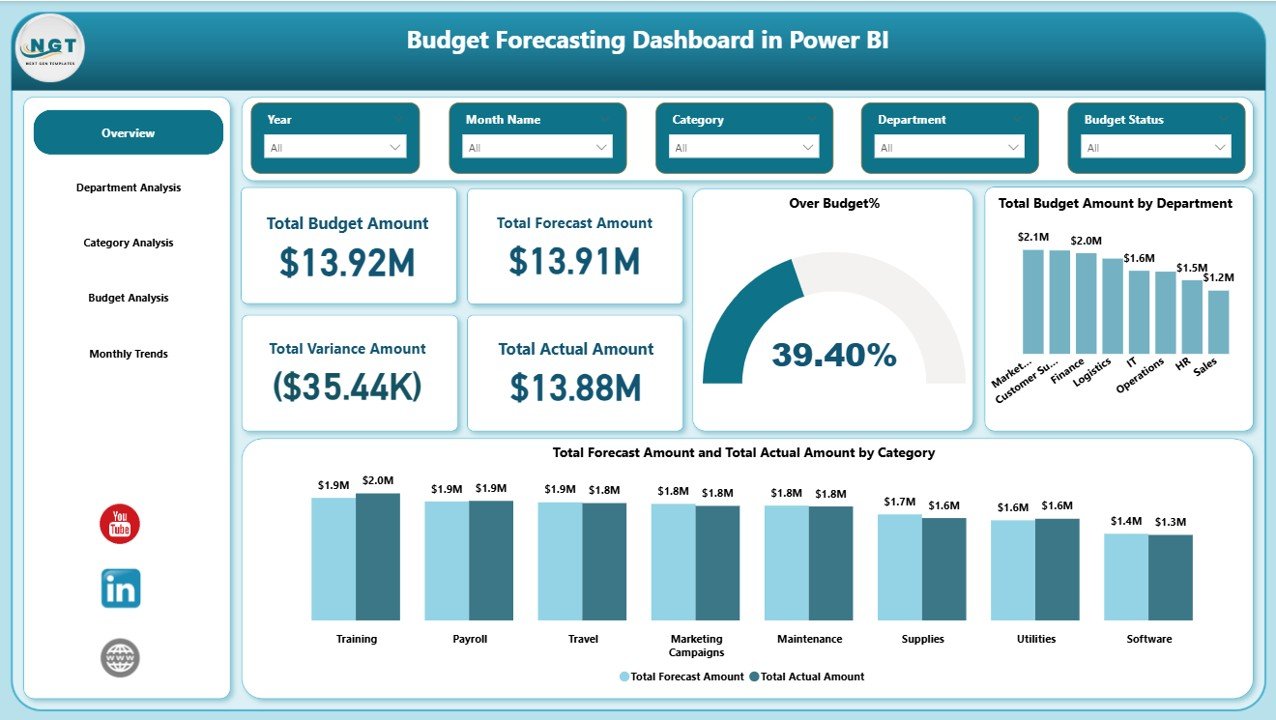
🔹 Overview Page
Displays Total Budget, Forecast, Actuals, Variance, and Over-Budget Percentage at a glance.
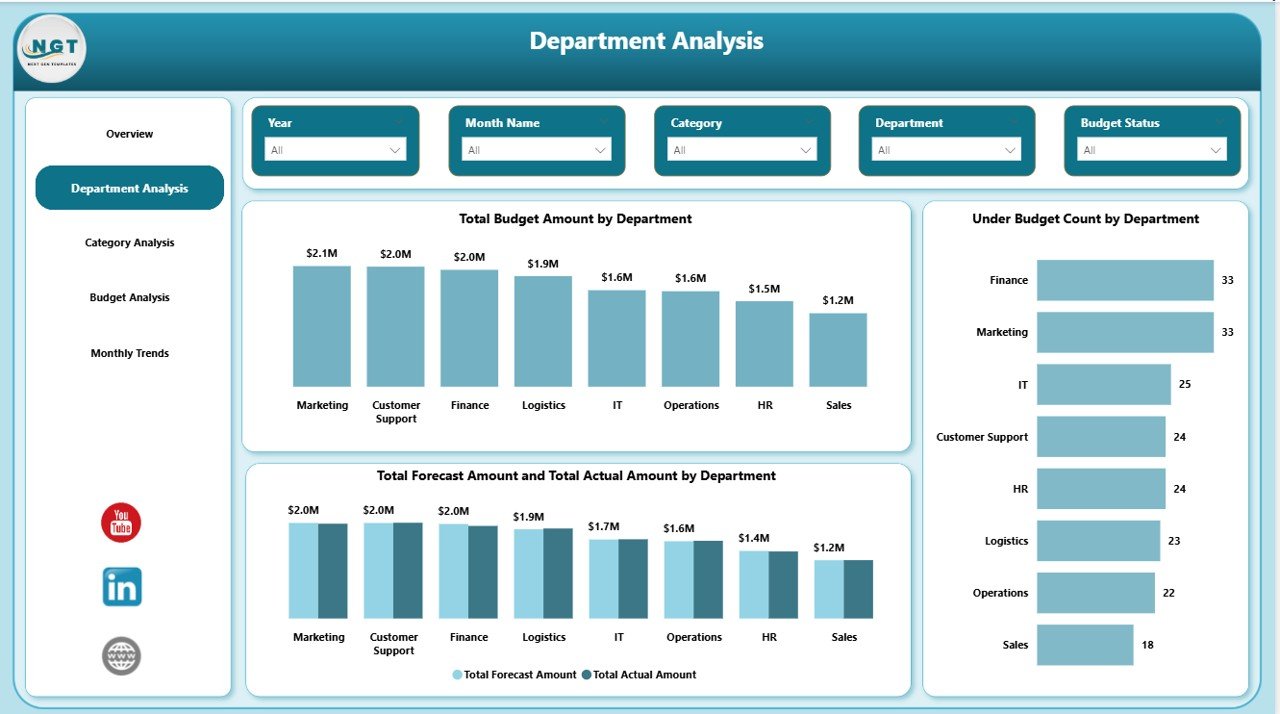
🔹 Department Analysis Page
Shows budget, forecast, and actual performance for each department, along with under-budget counts.
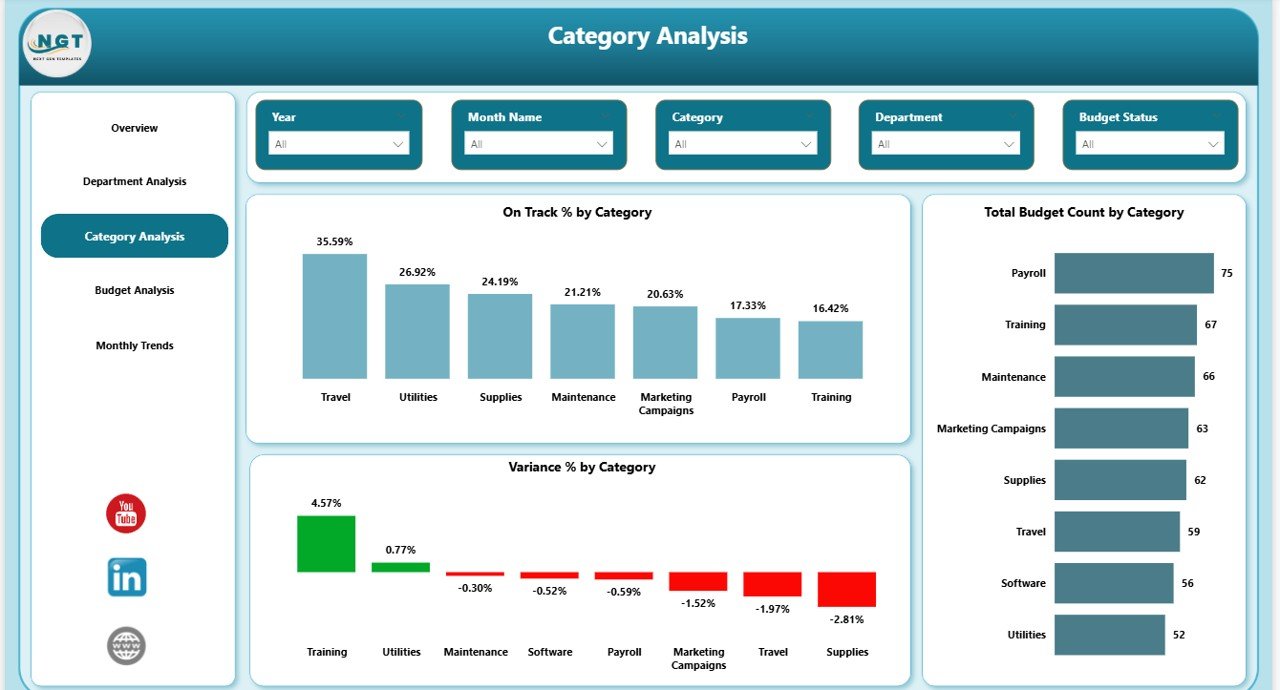
🔹 Category Analysis Page
Highlights on-track percentage, variance, and budget count by expense category.
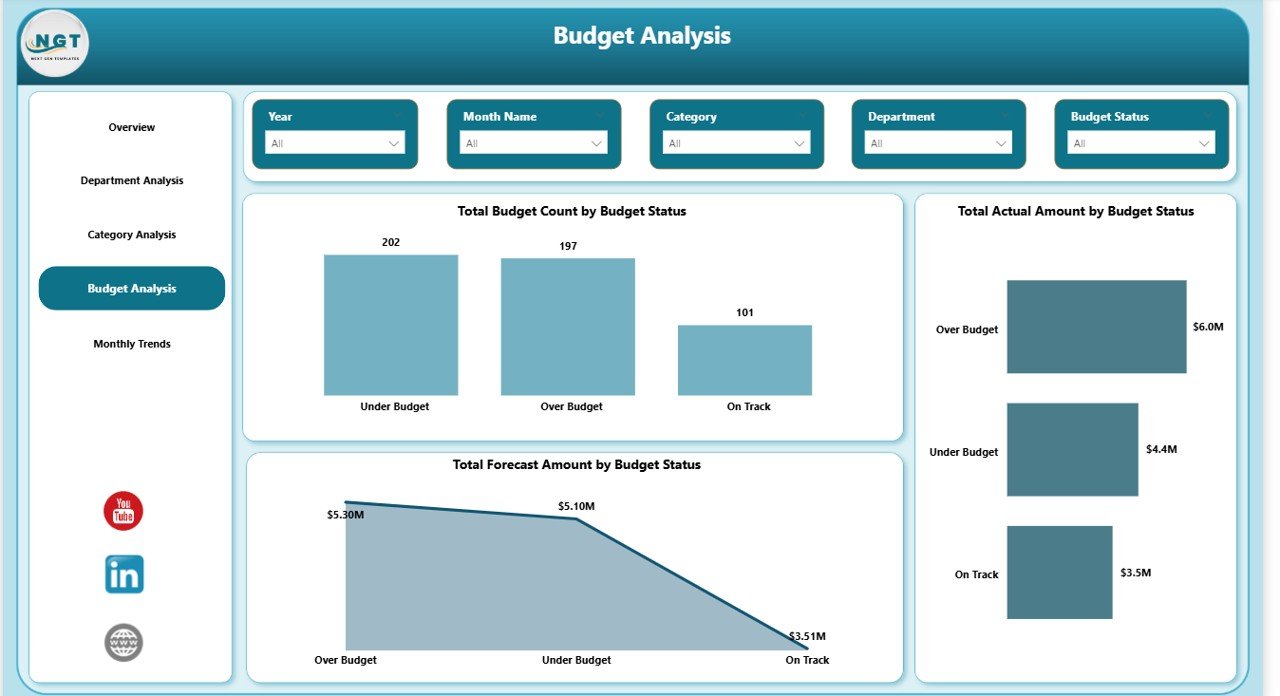
🔹 Budget Analysis Page
Groups budgets by status (on-track, over-budget, under-budget) to prioritize corrective actions.
🔹 Monthly Trends Page
Visualizes forecast vs actual trends, over-budget %, and under-budget % by month.
Each page is fully interactive and built to support fast, confident financial decisions.
## 🛠️ How to Use the Budget Forecasting Dashboard
Using this dashboard is simple and user-friendly—even for non-technical users:
1️⃣ Enter or connect your budget, forecast, and actual data (Excel or database).
2️⃣ Refresh the Power BI file.
3️⃣ Use slicers to filter by department, category, or month.
4️⃣ Analyze KPIs, trends, and variances instantly.
5️⃣ Take action before budgets go out of control.
No complex formulas. No manual reporting. Just insights.
## 👥 Who Can Benefit from This Budget Forecasting Dashboard?
This dashboard is ideal for:
💼 Finance Managers & Budget Analysts
📊 CFOs & Finance Directors
🏢 Department Heads
📈 Business Controllers
⚙️ Operations Managers
🏭 Small, Mid-Size & Large Enterprises
Whether you manage one department or multiple business units, this dashboard adapts to your needs.
## 🎯 Why This Dashboard Is a Game-Changer
✔ Improves forecasting accuracy
✔ Reduces financial surprises
✔ Enhances accountability
✔ Saves hours of manual reporting
✔ Supports data-driven leadership decisions
With this dashboard, finance teams shift from number reporting to strategic planning.
Click here to read the Detailed Blog Post
Watch the step-by-step video tutorial:
Learn the complete concept, benefits, best practices, and use cases in detail.
Visit our YouTube channel to learn step-by-step video tutorials
https://www.youtube.com/@PKAnExcelExpert
Compatibility and Requirements
- Built for Power BI Desktop, which is a free download from Microsoft: Get Power BI Desktop.
- Your budget, forecast and actual data can come from Excel or a database.
Frequently Asked Questions
What does the Overview page show?
Total Budget, Forecast, Actuals, Variance and Over-Budget Percentage at a glance.
How many pages are in the report?
Five: Overview, Department Analysis, Category Analysis, Budget Analysis and Monthly Trends.
Can I filter by department?
Yes. The slicers filter the report by department, category and month.
How are budget items grouped?
The Budget Analysis page groups items as on-track, over-budget or under-budget, so you can see which ones need action first.
Related Budget and Finance Templates
- Budget Forecasting Dashboard in Excel: the same topic for Excel users
- Budget Forecasting Dashboard in Google Sheets: a browser-based version
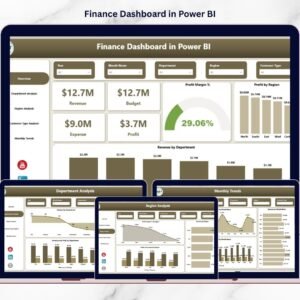
- Finance Dashboard in Power BI: a wider view of company finances
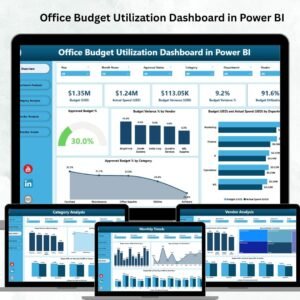
- Office Budget Utilization Dashboard in Power BI: track how office budgets are used
- Finance & Accounting Command Center: 8 finance templates in Excel, Power BI and Google Sheets
Browse all Power BI dashboards or the Excel financial tools.



























Reviews
There are no reviews yet.