

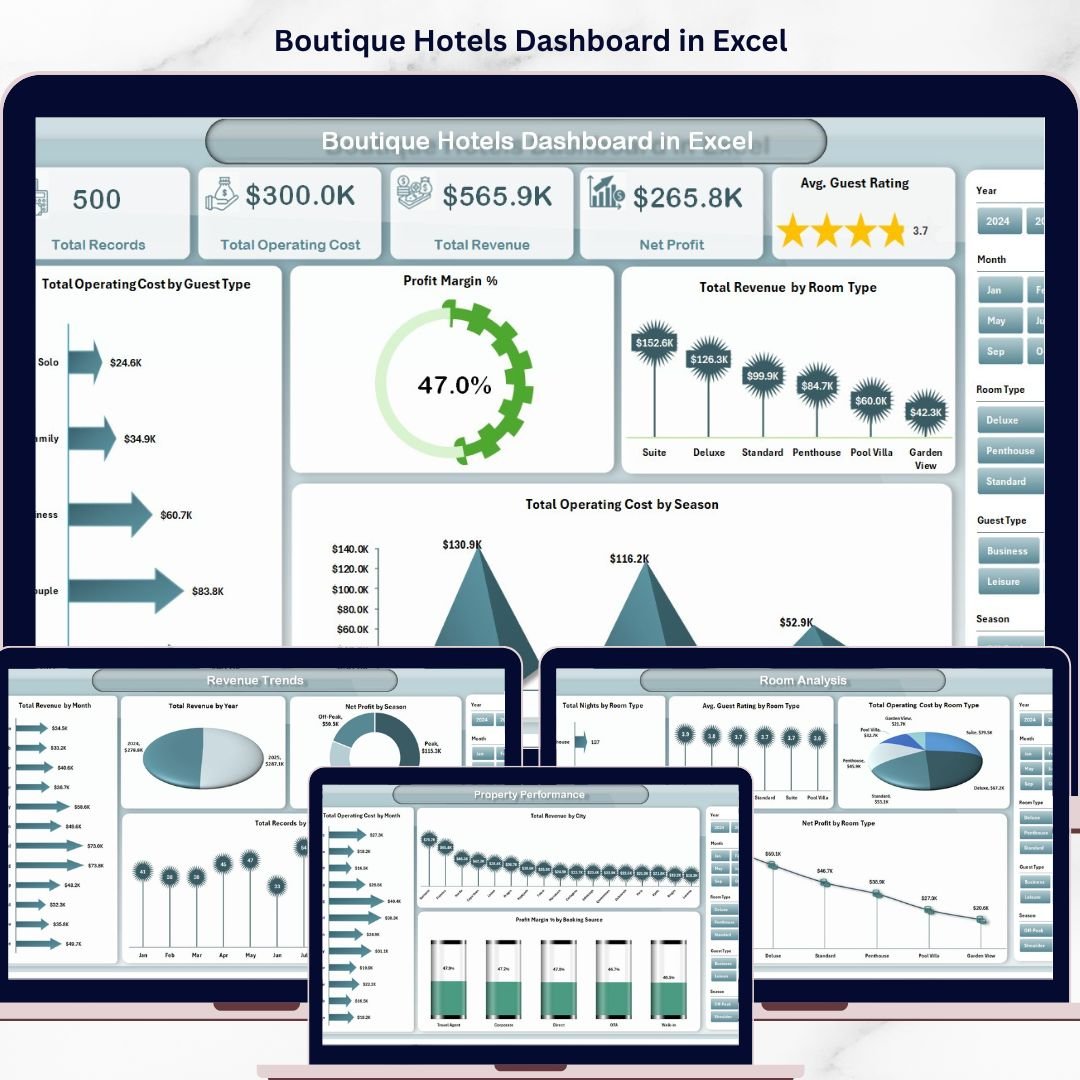



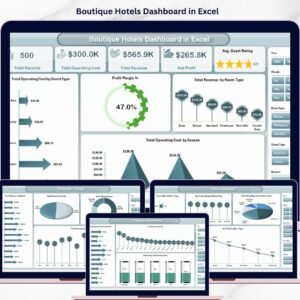
Boutique Hotels Dashboard in Excel is your all-in-one analytics powerhouse designed to help boutique hotel owners, resort managers, and hospitality professionals track every critical metric — from revenue and operating costs to guest ratings and seasonal trends — all inside a beautifully structured Excel workbook. Whether you run a cozy countryside inn, a luxury urban boutique, or a charming beachside property, this dashboard transforms your raw booking data into stunning visual insights that drive smarter business decisions instantly! 🏨
This ready-to-use template is packed with interactive charts, dynamic slicers, and pivot-powered analysis pages that make it incredibly easy to filter, compare, and explore your hotel performance data. Simply paste your data, hit Refresh All, and watch the entire dashboard come alive with actionable intelligence. It is one of the most comprehensive Excel Dashboard templates for the hospitality industry!
🔑 Key Features of Boutique Hotels Dashboard in Excel
📊 5 Interactive Dashboard Pages – Overview, Room Analysis, Guest Insights, Revenue Trends, and Property Performance pages give you a 360-degree view of your hotel operations.
🎛️ Dynamic Slicers & Filters – Instantly filter your dashboard by guest type, room type, season, booking source, city, and more with one click.
📈 Pivot-Powered Charts – All charts are connected to pivot tables in the Support Sheet, making the entire dashboard fully dynamic and auto-refreshable.
💰 Revenue & Profit Tracking – Monitor total revenue, operating costs, net profit, and profit margins across multiple dimensions.
⭐ Guest Rating Analysis – Track average guest satisfaction ratings by room type to identify your best-performing accommodations.
📅 Seasonal & Monthly Trends – Uncover revenue patterns across months, years, and seasons to optimize your pricing strategy.
🏙️ City-Wise Property Performance – Compare revenue and costs across different hotel locations.
🔄 One-Click Data Refresh – Update your data in the Data Sheet, click Refresh All in the Data tab, and every chart and pivot updates automatically.
📦 What’s Inside the Boutique Hotels Dashboard in Excel
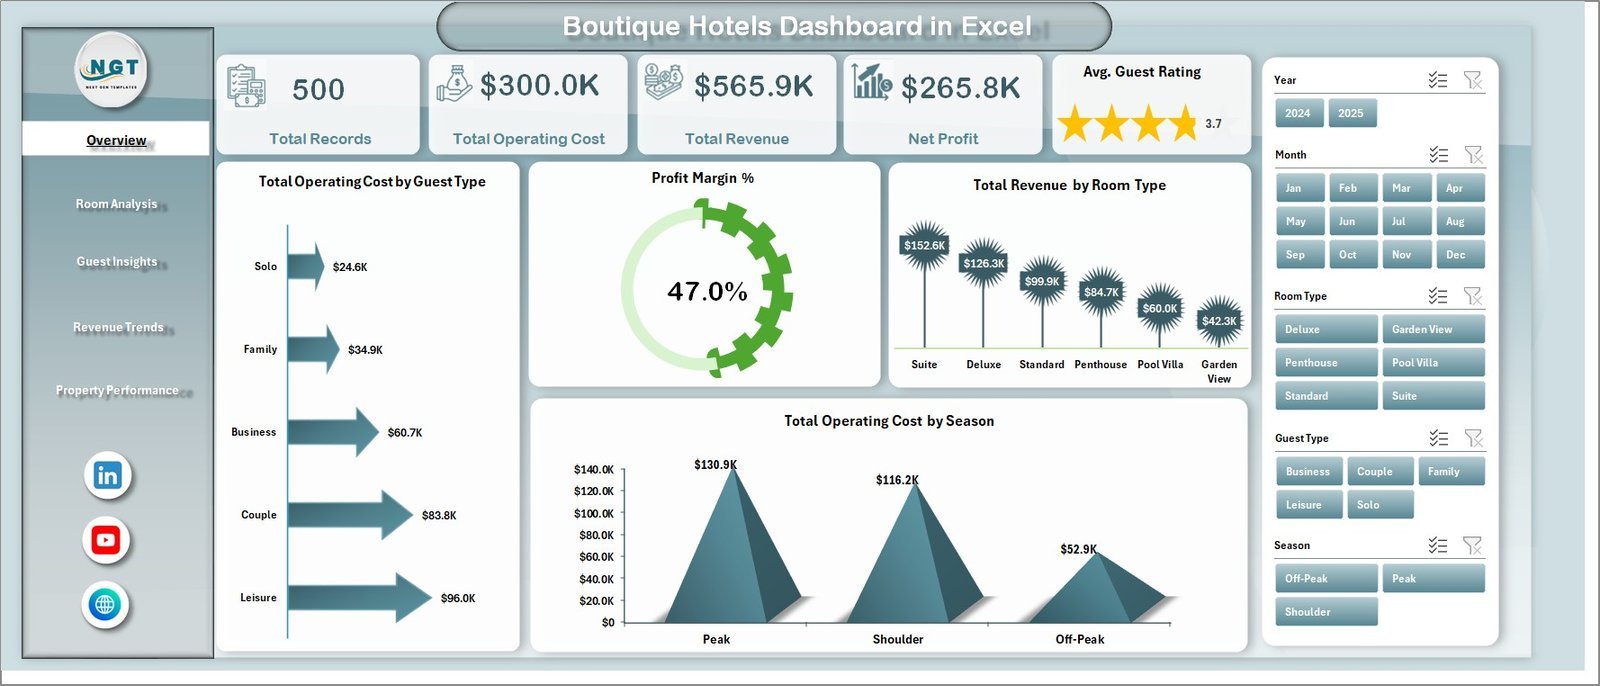
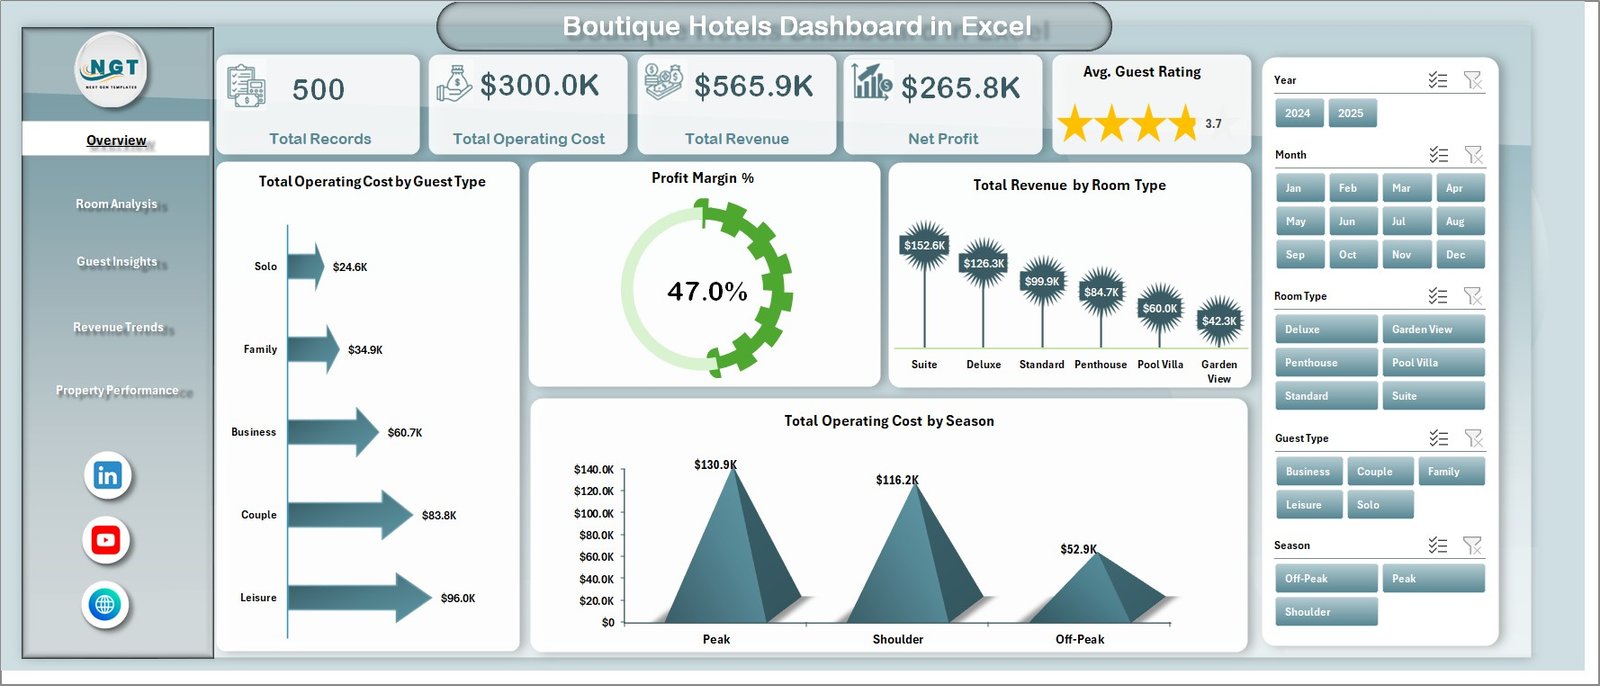
📌 Overview Page – Displays high-level KPI cards for Total Records, Total Operating Cost, Total Revenue, Net Profit, and Avg. Guest Rating. Includes charts showing Total Operating Cost by Guest Type, Profit Margin %, Total Revenue by Room Type, and Total Operating Cost by Season. Multiple slicers are available to filter data quickly.
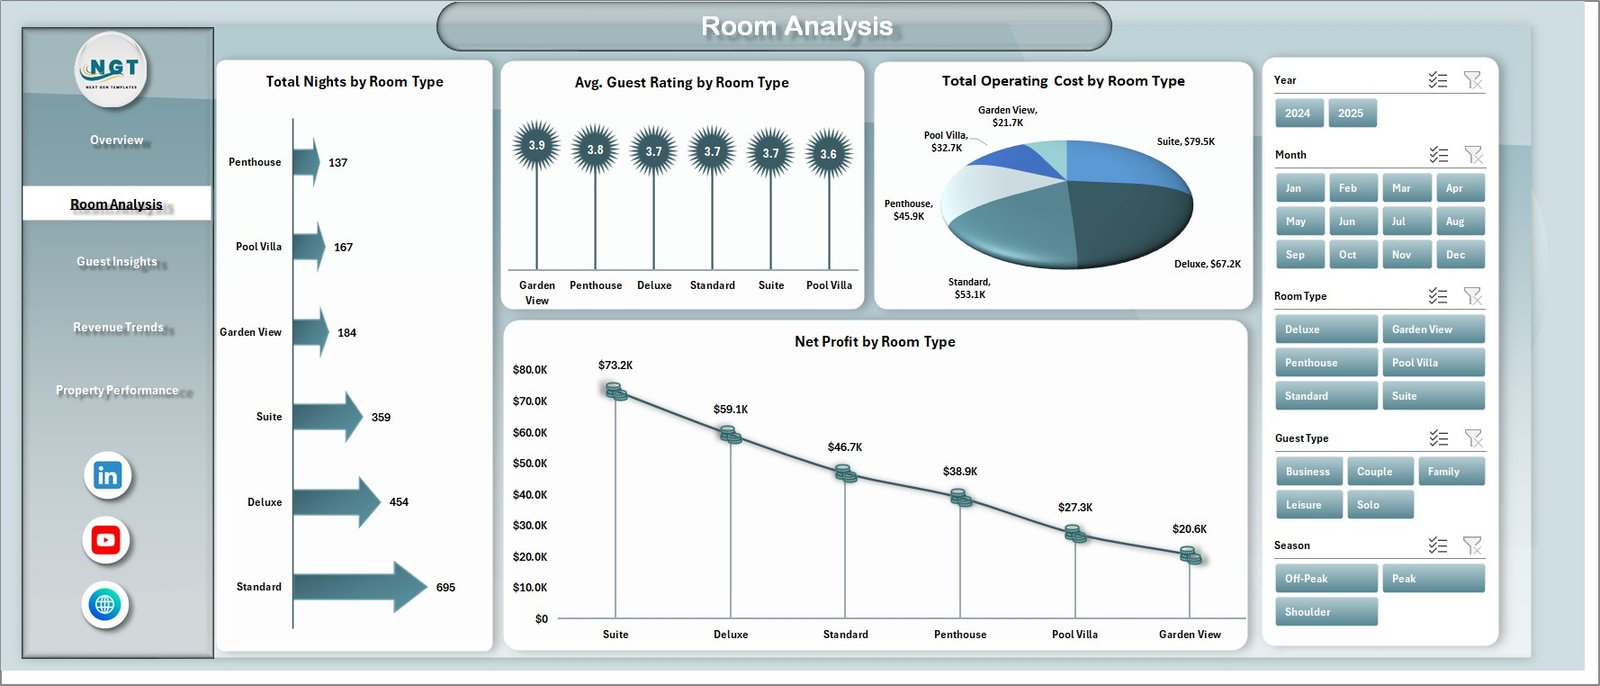
📌 Room Analysis Page – Deep-dive into room-level metrics with Total Nights by Room Type, Avg. Guest Rating by Room Type, Total Operating Cost by Room Type, and Net Profit by Room Type. Perfect for identifying your most profitable and highest-rated rooms.
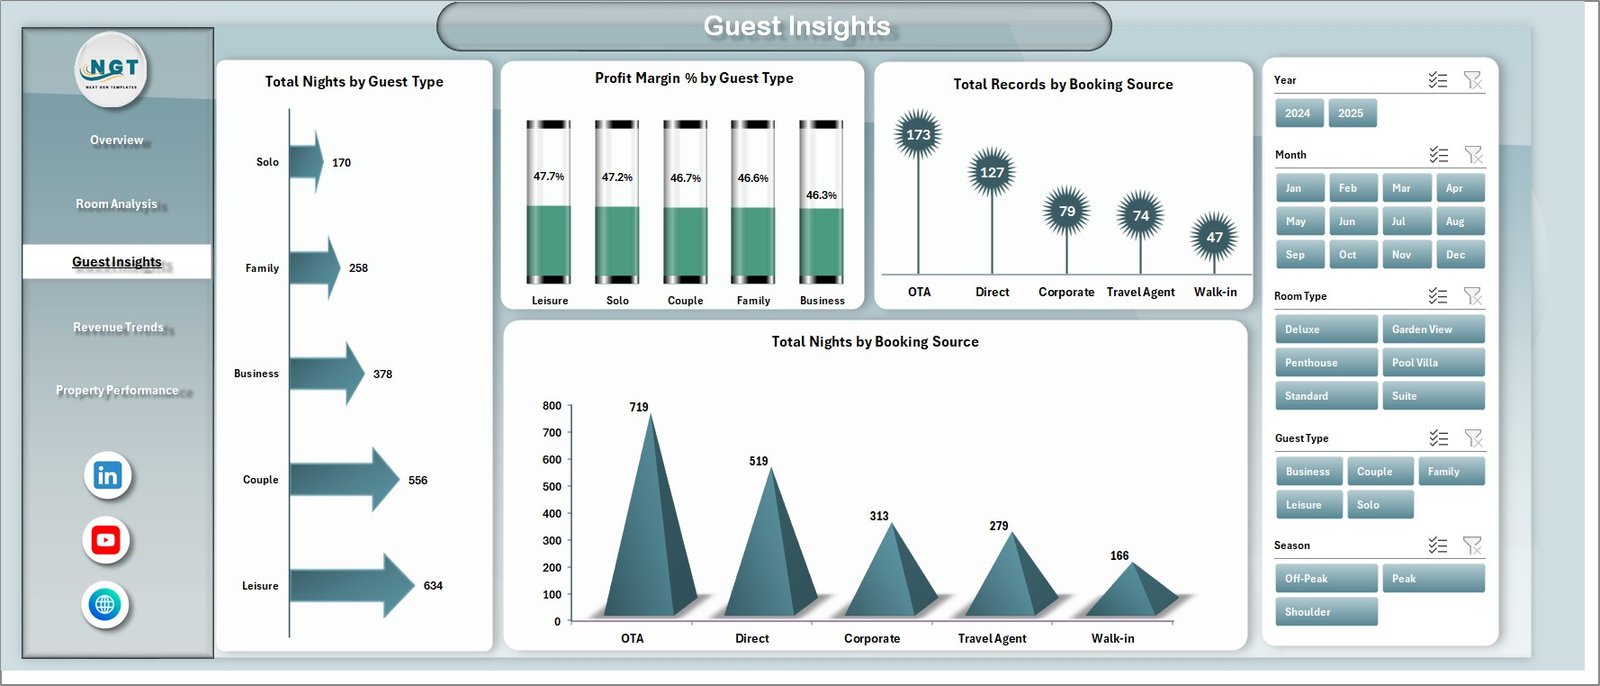
📌 Guest Insights Page – Understand your guest segments with Total Nights by Guest Type, Profit Margin % by Guest Type, Total Records by Booking Source, and Total Nights by Booking Source. Helps you optimize marketing spend by channel. Similar to insights you can find in the Hospitality Dashboard in HTML.
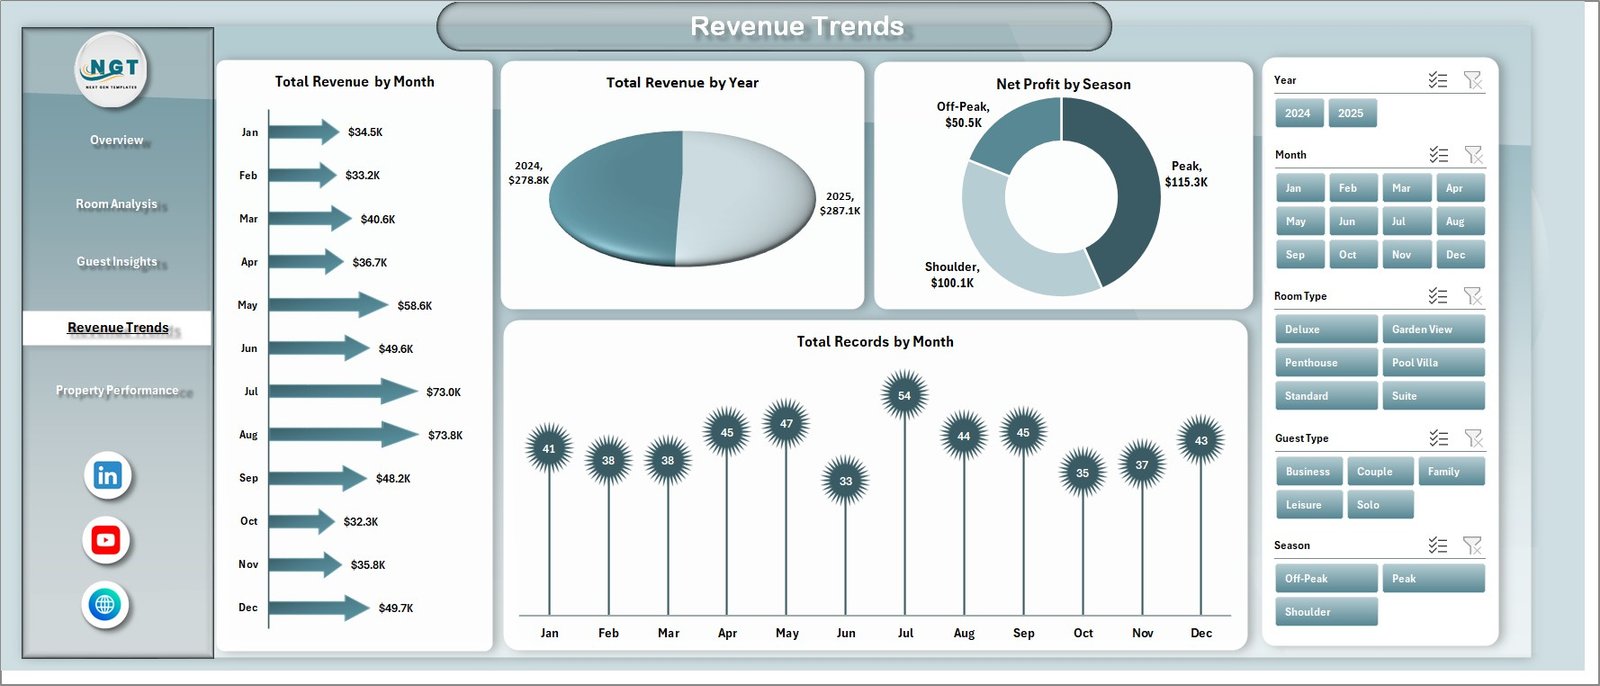
📌 Revenue Trends Page – Spot seasonal patterns with Total Revenue by Month, Total Revenue by Year, Net Profit by Season, and Total Records by Month. Essential for dynamic pricing and forecasting.
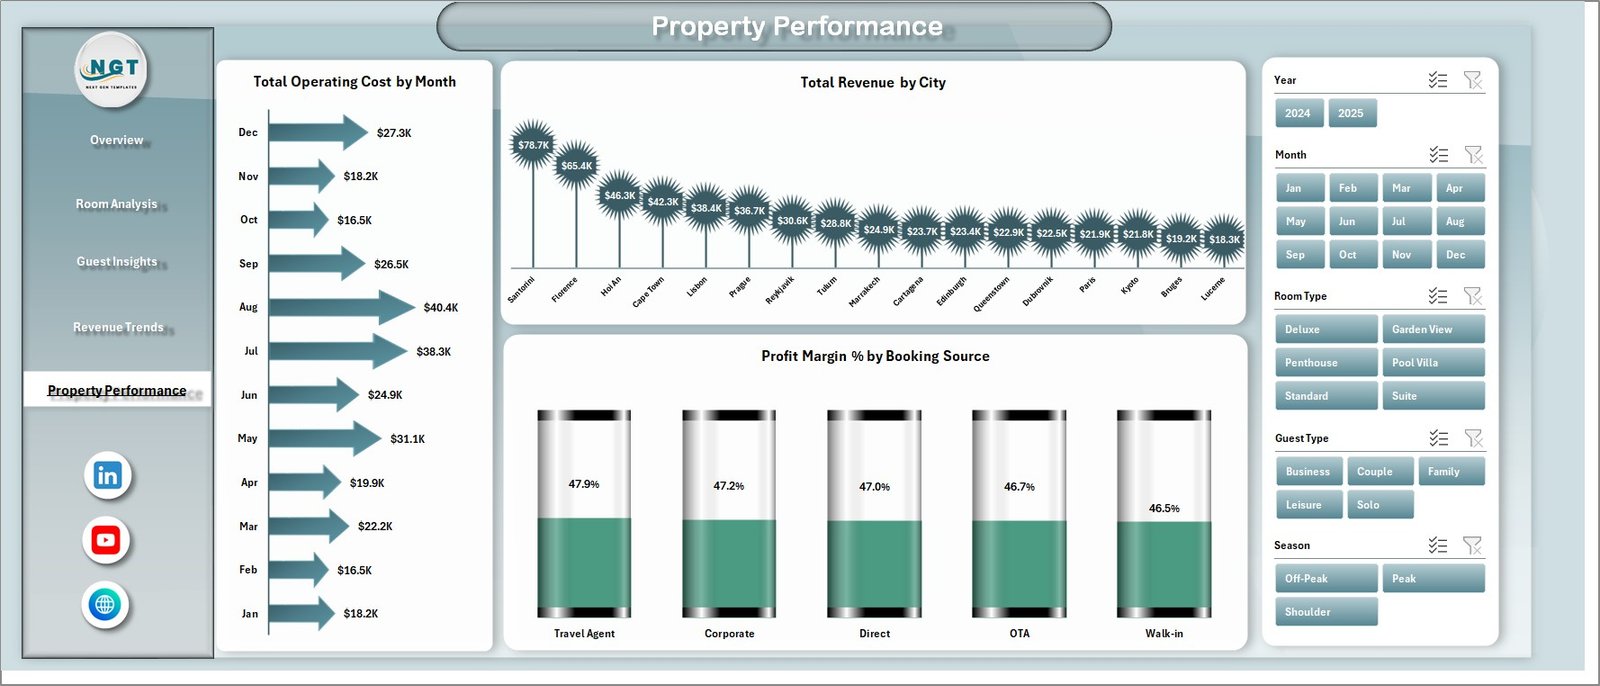
📌 Property Performance Page – Compare your locations with Total Operating Cost by Month, Total Revenue by City, and Profit Margin % by Booking Source. Great for multi-property portfolio management.
📌 Data Sheet – This is where you input your hotel booking records in the predefined format. Each row represents a booking with all relevant fields.
📌 Support Sheet – Contains all pivot tables that power the dashboard charts. After updating data, go to the Data tab in the Excel Ribbon and click Refresh All to update everything automatically. You can keep this sheet hidden.
⚙️ How to Use the Boutique Hotels Dashboard in Excel
1️⃣ Download and Open – Download the Excel file and open it. Enable editing and macros if prompted.
2️⃣ Enter Your Data – Go to the Data Sheet tab and paste your hotel booking data in the exact same column format.
3️⃣ Refresh the Dashboard – Navigate to the Data tab in the Excel Ribbon and click Refresh All. All pivots and charts will update automatically.
4️⃣ Explore the Pages – Browse through the Overview, Room Analysis, Guest Insights, Revenue Trends, and Property Performance pages.
5️⃣ Apply Filters – Use the slicers on each page to filter by guest type, room type, season, booking source, and more.
6️⃣ Make Decisions – Use the insights to optimize pricing, improve guest satisfaction, and boost profitability!
👥 Who Can Benefit from This Boutique Hotels Dashboard in Excel
🏨 Boutique Hotel Owners & Managers – Track performance of your unique property with precision.
🏢 Hospitality Consultants – Deliver professional analytics reports to your hotel clients.
📊 Revenue Managers – Monitor revenue trends, profit margins, and occupancy patterns across seasons.
🎓 Hospitality Students – Learn hotel data analysis with a professionally designed real-world dashboard.
🌍 Multi-Property Operators – Compare performance across cities and locations at a glance. Also check out the Backpacker Hostels Dashboard in Excel and the Hotel Chains KPI Dashboard in Power BI for related templates.
📖 Click here to read the Detailed Blog Post about Boutique Hotels Dashboard in Excel
🎥 Visit our YouTube channel to learn step-by-step video tutorials
👉 YouTube.com/@NextGenTemplates
Watch the step-by-step video tutorial:
YouTube


























Reviews
There are no reviews yet.