Managing apprenticeship programs in today’s fast-changing workforce environment can be overwhelming. Apprenticeship Programs Dashboard in Power BI Organizations invest heavily in training, development, and placements—but without the right tools, tracking performance, costs, and outcomes becomes complex.
Many HR teams and training managers still rely on disconnected reports and manual spreadsheets. As a result, they struggle to gain clear insights, monitor progress, and make timely decisions.
That’s exactly where the Apprenticeship Programs Dashboard in Power BI becomes a game-changing solution! 🚀
Apprenticeship Programs Dashboard in Power BI This powerful and ready-to-use dashboard allows you to monitor apprentices, analyze training performance, track costs, and evaluate placement outcomes—all in one interactive platform. Instead of dealing with scattered data, you get a centralized, visual, and real-time reporting system.
Moreover, this dashboard transforms complex data into easy-to-understand visuals, helping you make smarter, faster, and more accurate decisions. Whether you are managing a corporate training program, government initiative, or educational institution, this dashboard empowers you to optimize performance and improve outcomes. ⚡
📊 Key Features of Apprenticeship Programs Dashboard in Power BI
✨ All-in-One Dashboard – Track apprentices, costs, performance, and placements in one place.
👨🎓 Apprentice Monitoring – Keep track of total apprentices and their progress.
💰 Cost & Stipend Tracking – Analyze training expenses and stipend allocations.
📈 Performance Insights – Monitor performance scores and satisfaction levels.
🎯 Placement Analysis – Evaluate employment outcomes and placement success rates.
📍 Regional & Department Analysis – Compare performance across locations and departments.
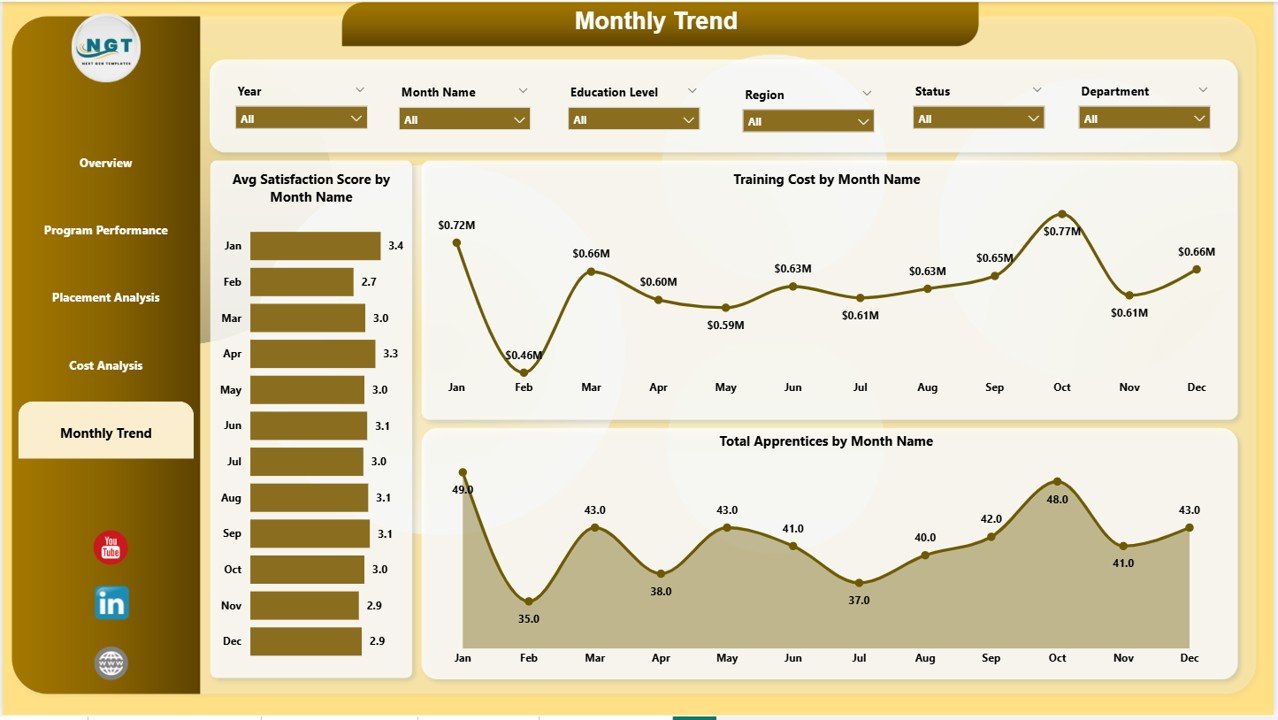
📅 Monthly Trends Tracking – Identify patterns and monitor progress over time.
⚡ Real-Time Data Updates – Make faster decisions with dynamic dashboards.
🎛️ Interactive Filters & Drill-Downs – Explore data deeply with slicers and visuals.
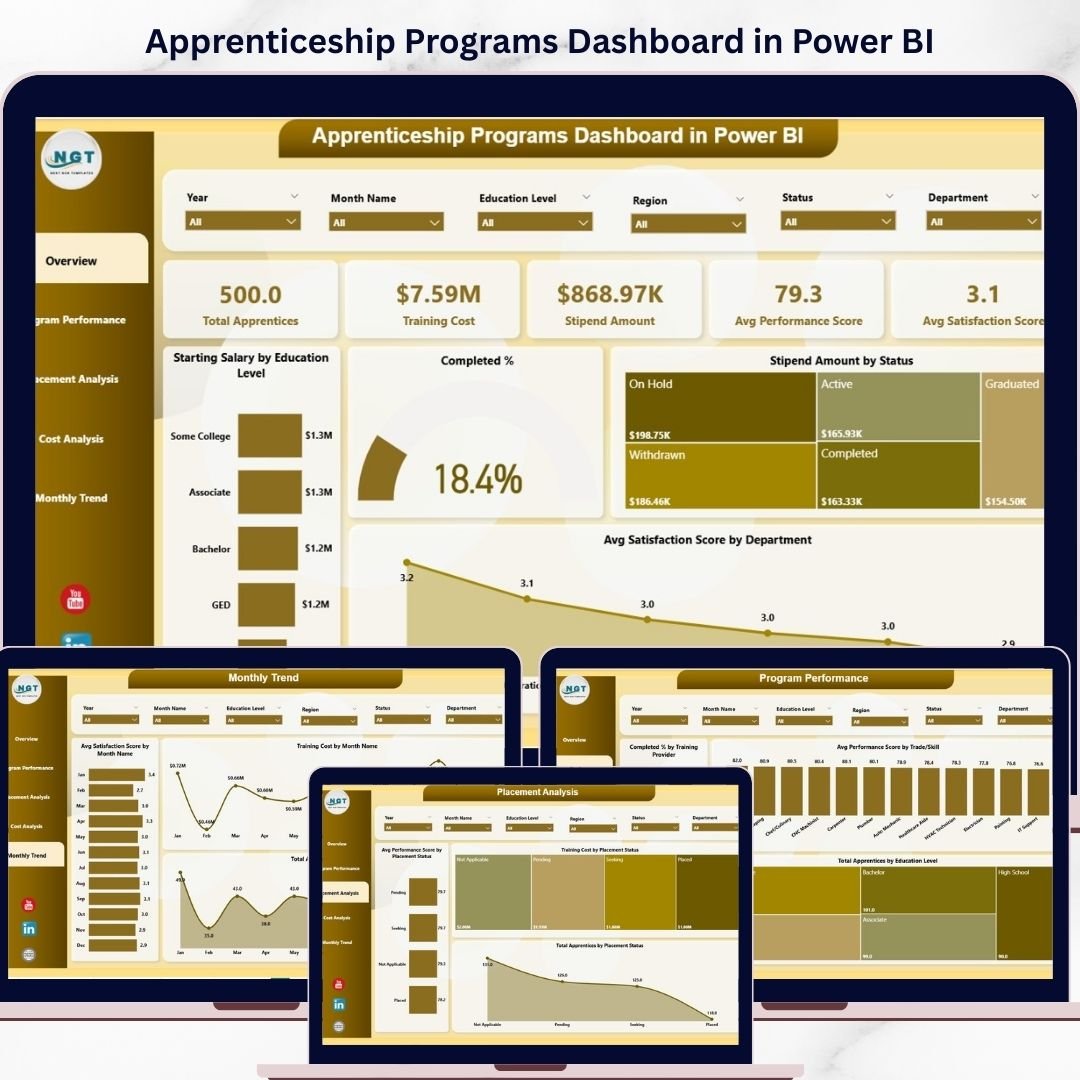
📂 What’s Inside the Apprenticeship Programs Dashboard in Power BI
This dashboard includes 5 powerful and interactive pages designed for complete analysis:
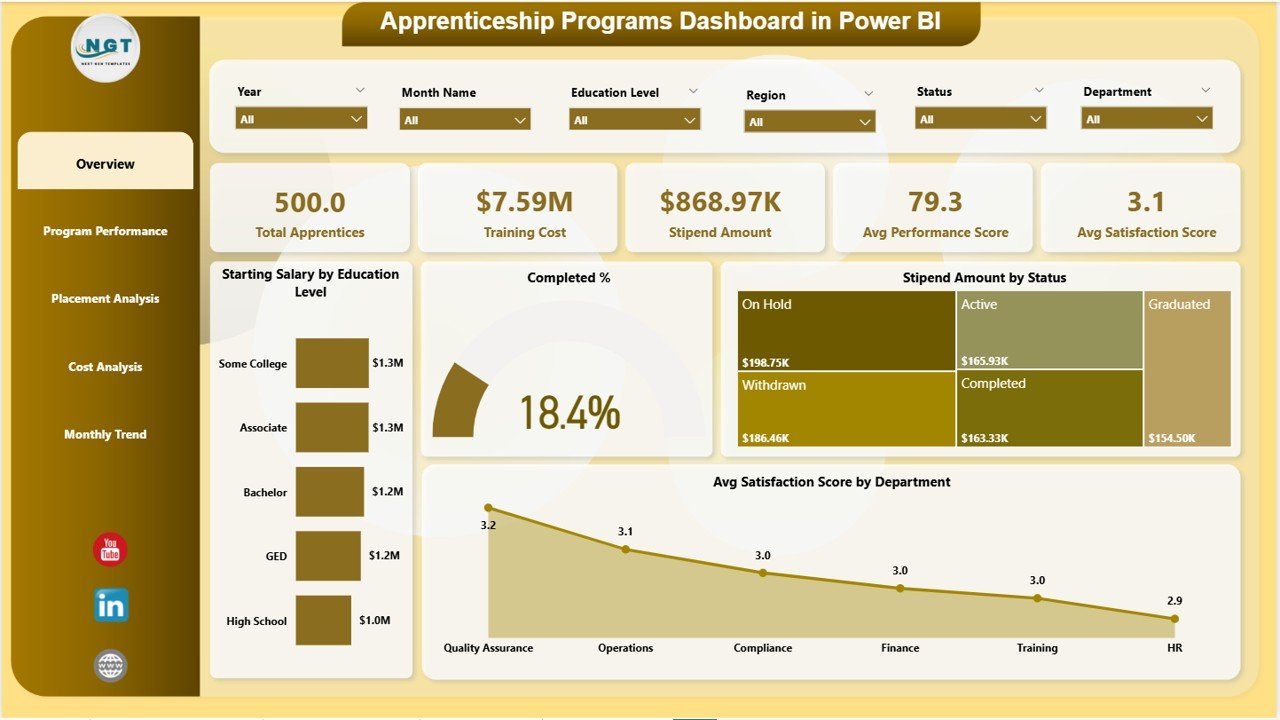
📊 Overview Page – Get a complete snapshot with KPI cards and performance charts.
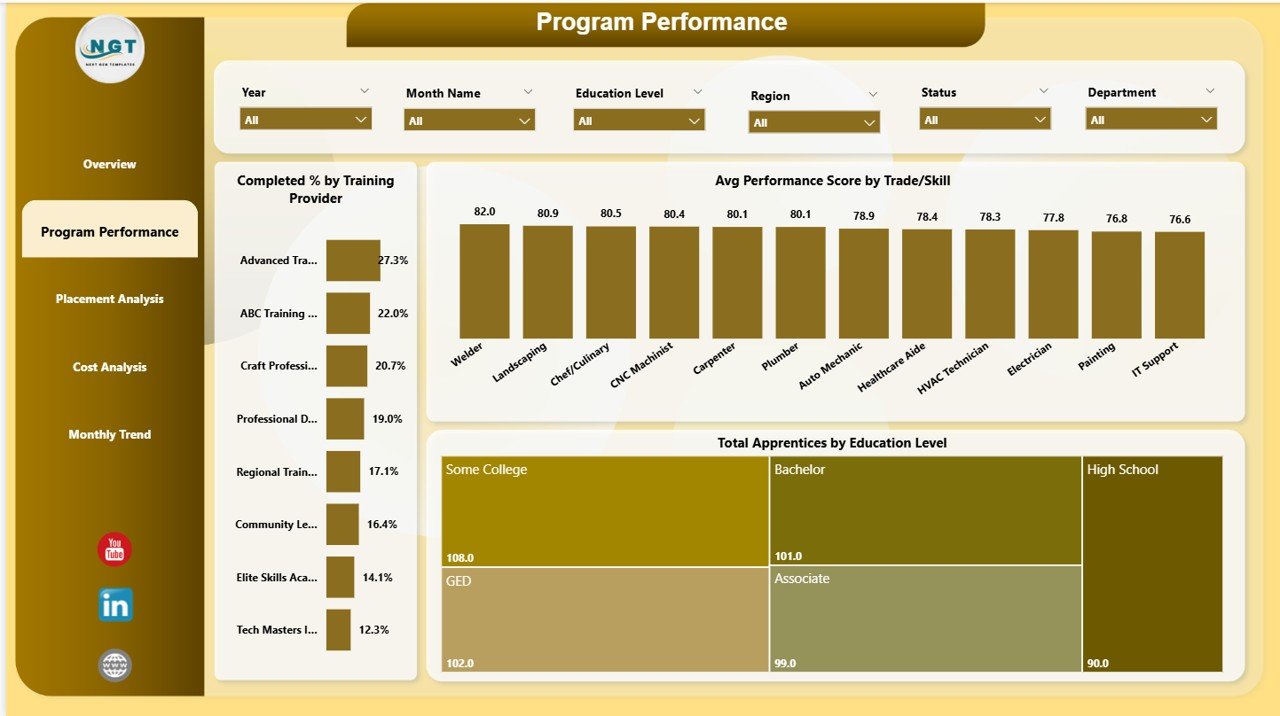
📈 Program Performance – Analyze training effectiveness and completion rates.
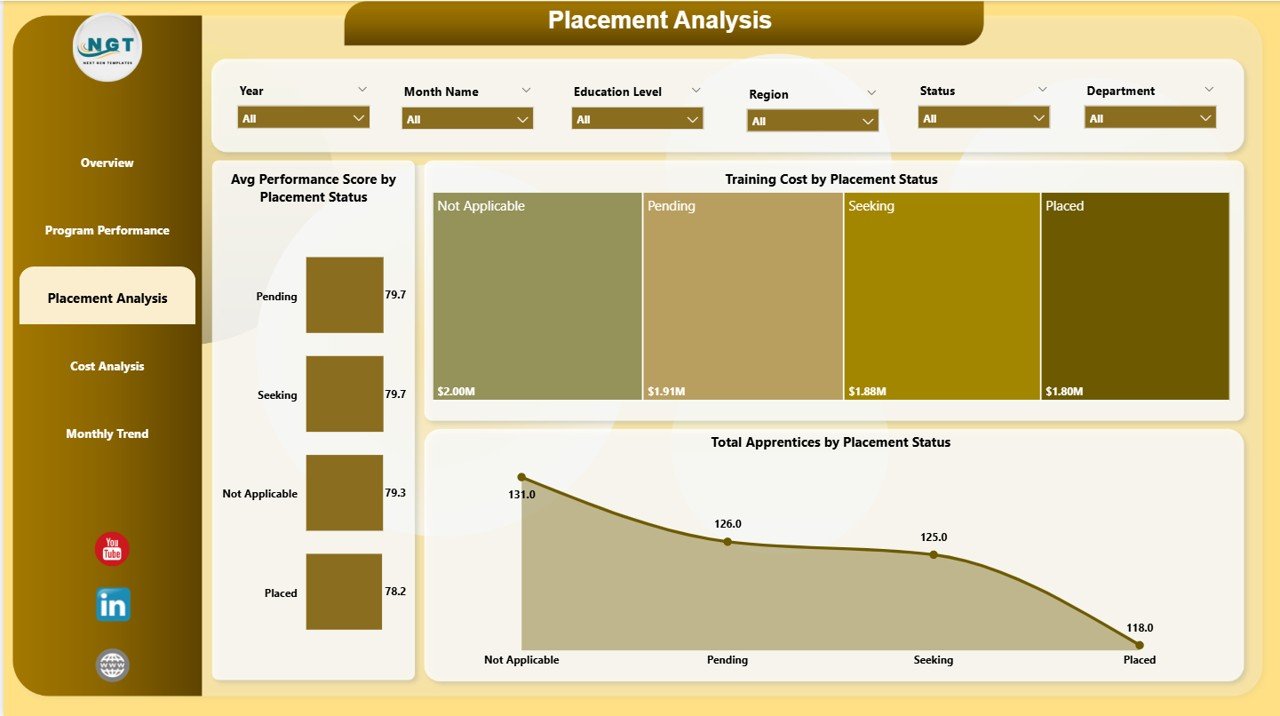
🎯 Placement Analysis – Evaluate job placements and identify risk areas.
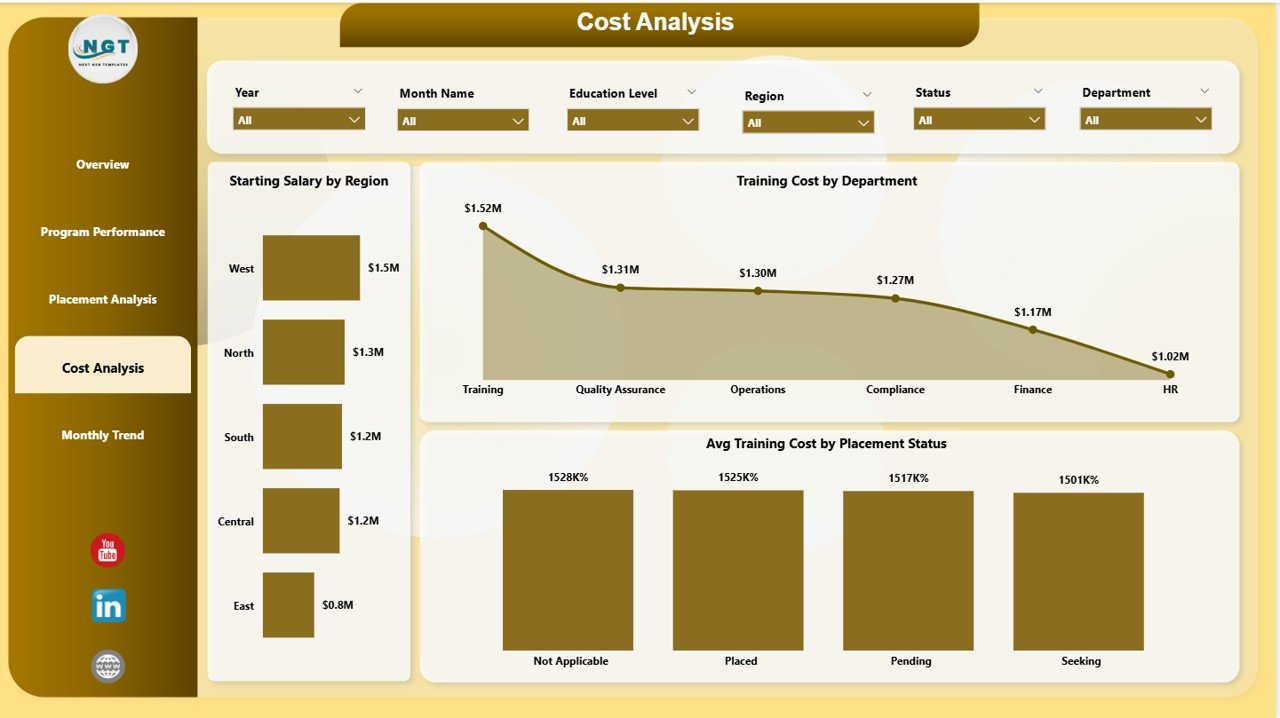
💰 Cost Analysis – Monitor training costs and optimize budget allocation.
📅 Monthly Trends – Track performance trends and growth over time.
Each page is designed to deliver clear, actionable insights for better decision-making. 🔍
⚙️ How to Use the Apprenticeship Programs Dashboard in Power BI
Using this dashboard is simple and efficient:
📥 Load Your Data – Import apprenticeship data into Power BI.
🔗 Connect Data Sources – Link datasets to the dashboard.
🎛️ Apply Filters (Slicers) – Analyze by region, department, or trade.
📊 Monitor KPI Cards – Track key metrics like cost, performance, and apprentices.
🔍 Explore Visuals – Drill down into charts for deeper insights.
📈 Track Monthly Trends – Monitor growth and identify patterns.
Within minutes, you can turn raw data into meaningful insights! ⚡
👥 Who Can Benefit from This Apprenticeship Programs Dashboard in Power BI
This dashboard is ideal for:
🏢 HR Managers – Track workforce development and training outcomes.
🎓 Training Coordinators – Monitor program effectiveness and certification rates.
🏫 Educational Institutions – Manage apprenticeship programs efficiently.
🏛️ Government Agencies – Track skill development initiatives.
🌍 Workforce Development Organizations – Improve training and placement success.
If you manage apprenticeship programs, this tool is essential! 🏆
📖 Click hare to read the Detailed blog post
🎥 Visit our YouTube channel to learn step-by-step video tutorials
👉 https://www.youtube.com/@PKAnExcelExpert


