

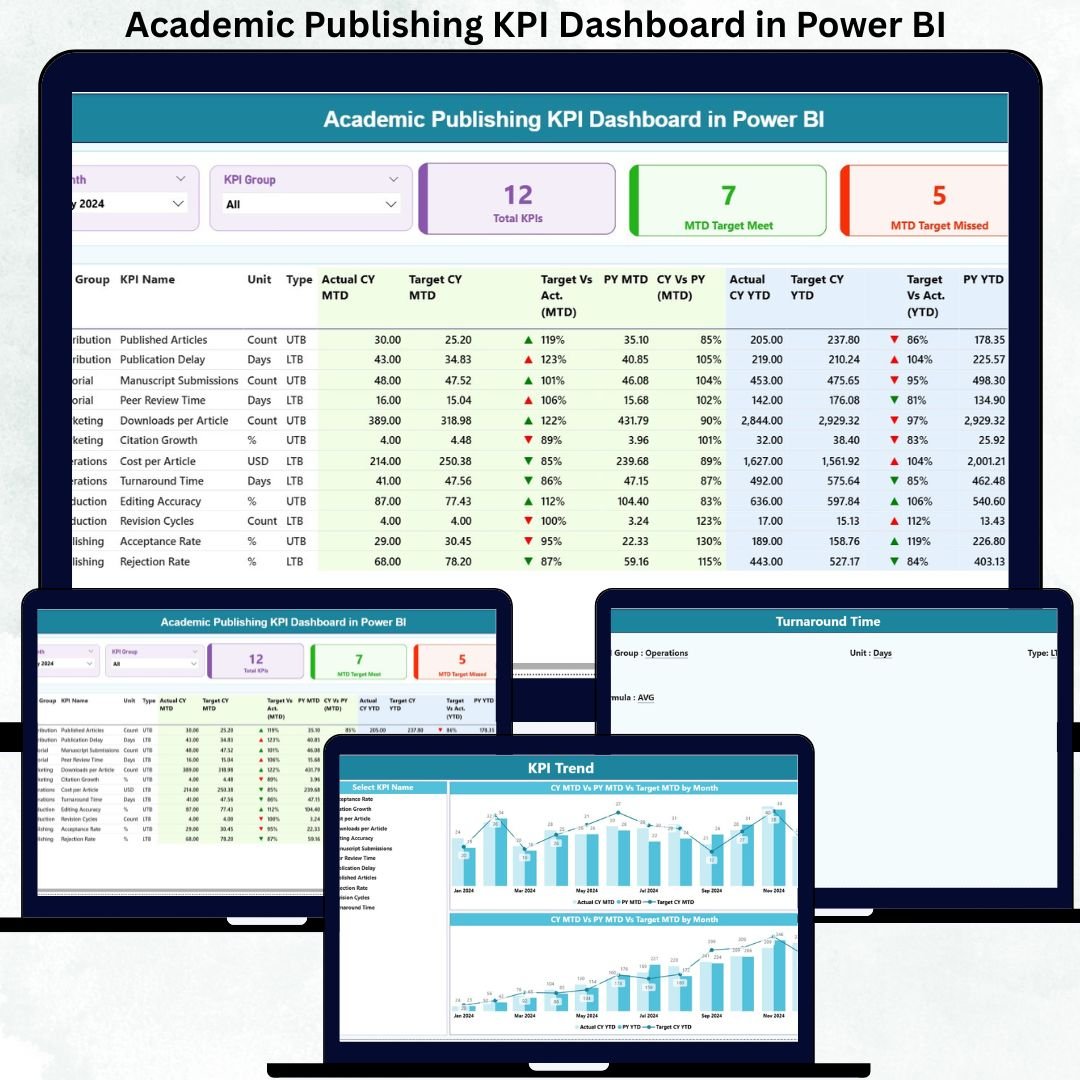

The academic publishing world is becoming more competitive every year. Journals receive thousands of submissions, authors expect quick responses, reviewers handle heavy workloads, and institutions demand transparency and measurable impact. But when teams depend on manual reporting, editorial delays increase, trends go unnoticed, and decision-makers lack clarity.
The Academic Publishing KPI Dashboard in Power BI transforms the entire editorial analytics process. It turns raw publishing data into clean visuals, instant comparisons, and real-time insights that help publishers improve efficiency, quality, and strategic direction. Academic Publishing KPI Dashboard in Power BI With automated refreshes, dynamic slicers, MTD/YTD performance tracking, and clear KPI definitions, this dashboard becomes the backbone of any modern publishing workflow. 🚀
Academic Publishing KPI Dashboard in Power BI Whether you’re tracking submission volume, acceptance trends, review turnaround, editorial workload, or production speed, this dashboard gives academic publishers the transparency and control they need to operate at world-class standards.
Key Features of the Academic Publishing KPI Dashboard in Power BI ✨
This dashboard offers everything an editorial team needs to streamline operations:
✨ Three Powerful Pages – Summary, KPI Trend & KPI Definition
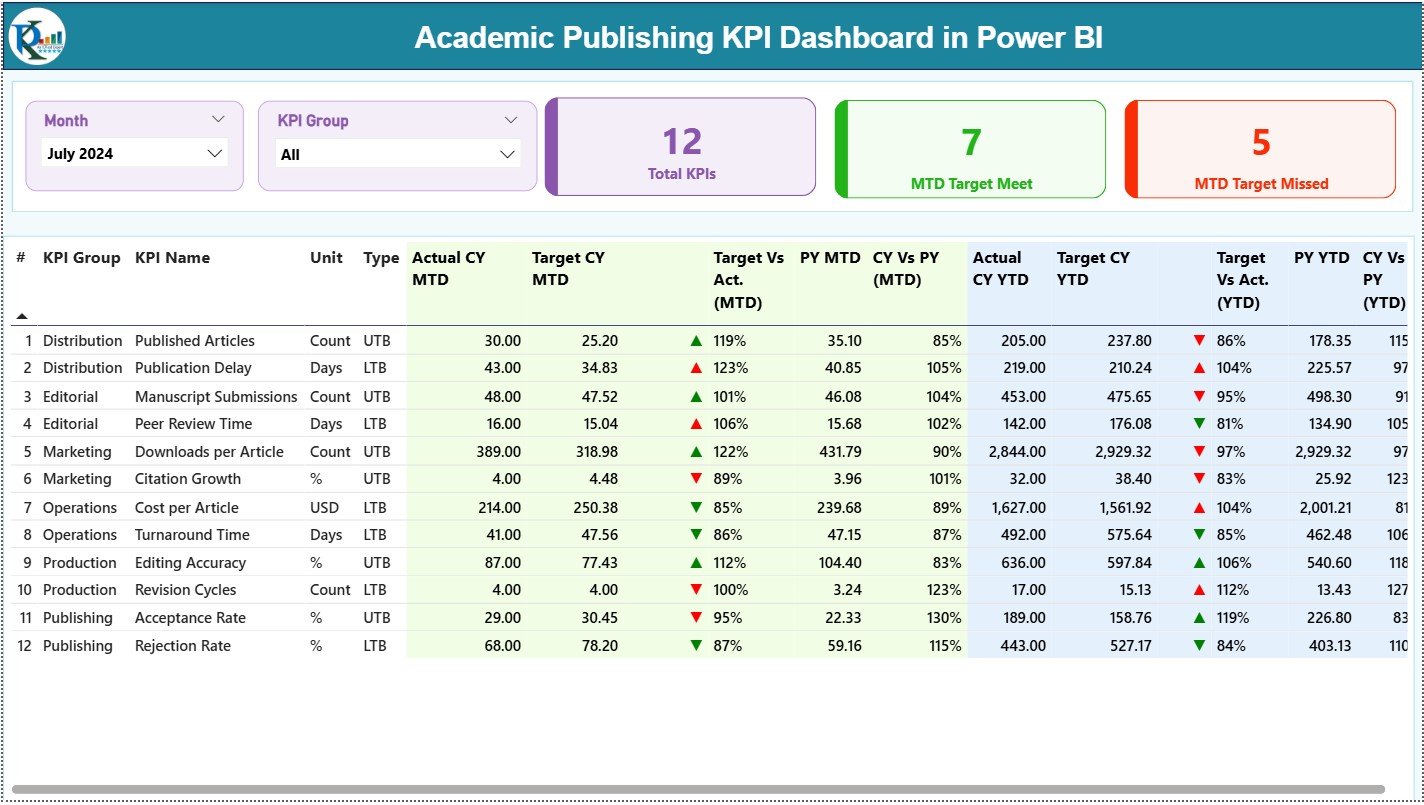
📊 Real-Time KPI Cards – Instantly view total KPIs, targets met, and targets missed
📅 Month & KPI Group Slicers – Analyze performance by month or department
📈 MTD & YTD Variance Tracking – Compare actuals with targets and previous year values
🔍 Detailed KPI Table – View all metrics including icons, trends, and percentage comparisons
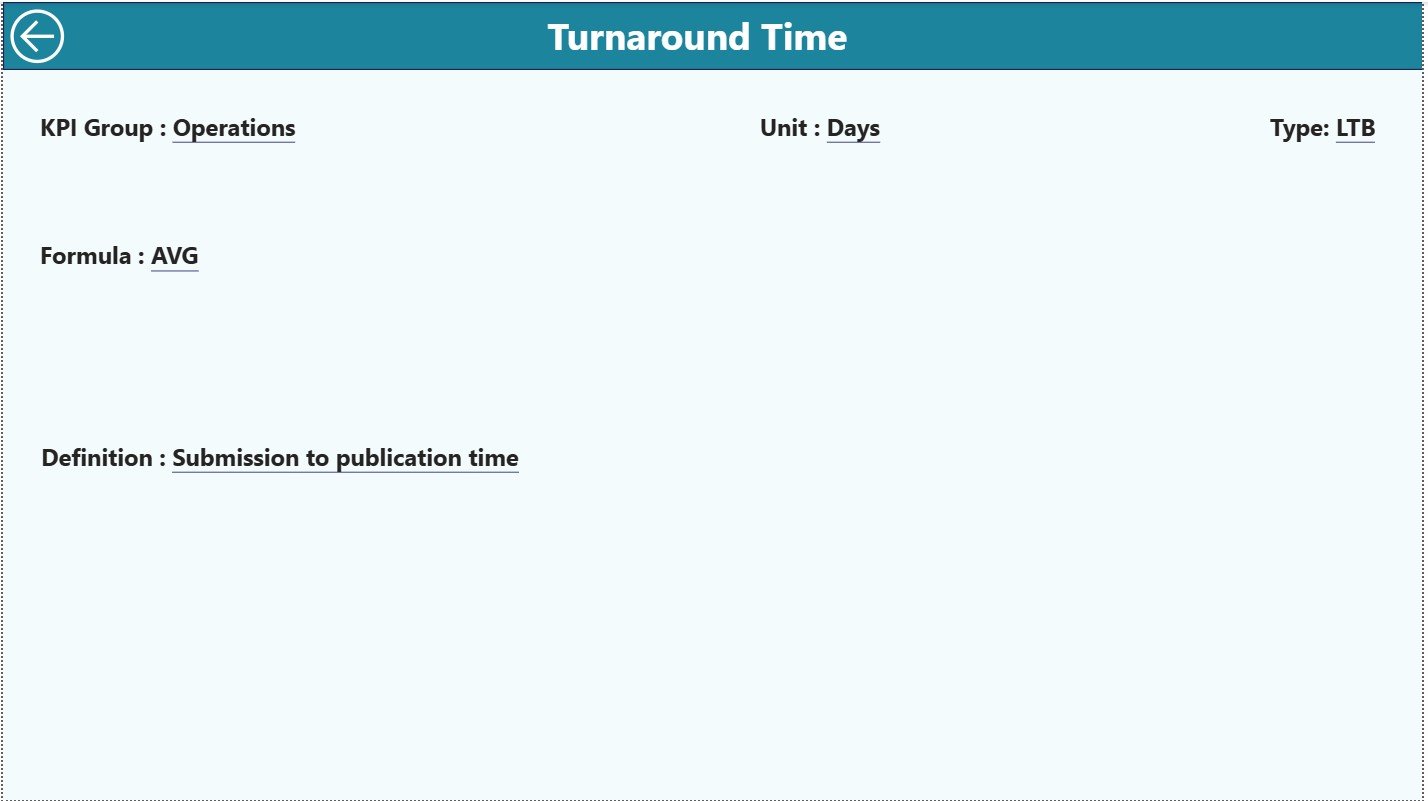
📘 Drill-Through KPI Definition Page – Understand formulas, units, and KPI logic clearly
💡 Excel-Based Data Source – Simple data entry with automated Power BI refresh
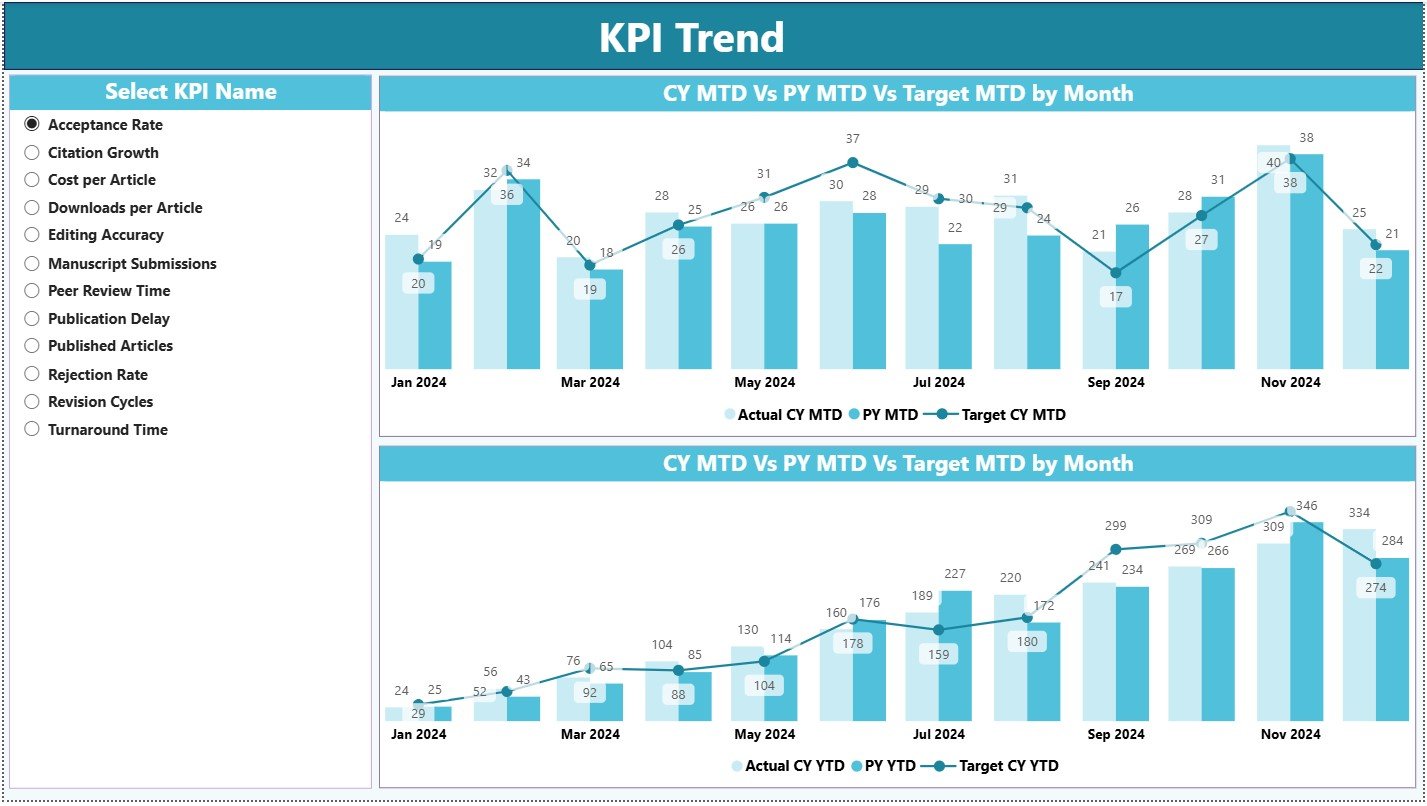
📉 Trend Lines for MTD/YTD – Identify delays, bottlenecks, and publication patterns
🖥️ Interactive Visuals – Designed for fast, accurate editorial decision-making
This dashboard is simple to use yet powerful enough to transform publishing workflows.
What’s Inside the Academic Publishing KPI Dashboard in Power BI 📂
You get a structured, easy-to-navigate reporting system built for academic teams:
📌 Summary Page – Central hub with KPI cards, slicers, and a detailed editorial KPI table
📌 KPI Trend Page – View monthly and yearly performance trends for any KPI
📌 KPI Definition Page – Drill-through page with formulas, definitions & KPI types
The Excel data model includes:
✔ Input Actual Sheet – Enter monthly MTD and YTD values
✔ Input Target Sheet – Store monthly MTD and YTD targets
✔ KPI Definition Sheet – Maintain KPI formulas, units, categories & types
Everything updates automatically once refreshed in Power BI.
How to Use the Academic Publishing KPI Dashboard in Power BI 🛠️
This dashboard is extremely user-friendly. Here’s how to use it:
1️⃣ Update the Excel sheets with actuals, targets, and KPI definitions
2️⃣ Load or refresh the Power BI file
3️⃣ Choose any month or KPI group using slicers
4️⃣ Review KPI cards to see overall editorial performance
5️⃣ Explore the table to analyze trends, icons, and comparisons
6️⃣ Drill into the KPI Definition page for formula clarity
7️⃣ Use the KPI Trend page for monthly & yearly insight visualization
In minutes, journals get accurate, board-ready insights without any manual effort. ⚡
Who Can Benefit from This Academic Publishing Dashboard? 👥
This dashboard is ideal for every team involved in the publishing lifecycle:
🎯 Editors-in-Chief – Track acceptance rate, review time & publication quality
📚 Editorial Teams – Monitor workflow efficiency and bottlenecks
📝 Peer Review Managers – Understand reviewer performance & delays
📊 Journal Managers – Improve planning and predict workload
📈 Academic Boards & Committees – Review KPIs easily in meetings
🏛️ University Presses & Publishers – Maintain consistent quality and growth
If your publishing team wants clarity, accuracy, and faster decisions—this dashboard is the perfect solution.
Click here to read the Detailed blog post
Visit our YouTube channel to learn step-by-step video tutorials
Watch the step-by-step video tutorial:
Compatibility and Requirements
- Works in Power BI Desktop, which is free to download. Microsoft explains how to get it in Get Power BI Desktop.
- The data source is an Excel workbook with the Input Actual, Input Target and KPI Definition sheets. You enter your figures there and refresh the report in Power BI.
Frequently Asked Questions
Which pages does the dashboard have?
Three pages: Summary, KPI Trend and KPI Definition. The Summary page has the KPI cards, the Month and KPI Group slicers and the detailed KPI table.
Where do I enter my data?
In the Excel data source. Put monthly MTD and YTD actuals in the Input Actual sheet, MTD and YTD targets in the Input Target sheet, and KPI formulas, units, categories and types in the KPI Definition sheet. Then refresh the report in Power BI.
Can I compare actuals with targets and last year?
Yes. The KPI table shows MTD and YTD actuals against targets and previous year values, with icons, trends and percentage comparisons.
How do I see how a KPI is calculated?
Drill through to the KPI Definition page. It lists the formula, unit and type for each KPI.
Is there an Excel version or a general publishing dashboard?
Yes. See the Academic Publishing KPI Dashboard in Excel and the Academic Publishing Dashboard in Power BI.
Related Publishing Templates
- Academic Publishing KPI Dashboard in Excel: the same KPI dashboard in Excel
- Academic Publishing Dashboard in Power BI: a broader Power BI dashboard for academic publishers
- Publishing Industry KPI Dashboard in Power BI: KPIs for the wider publishing industry
- Printing & Publishing KPI Dashboard in Power BI: KPIs for print and production teams
- Power BI Dashboard Mega Collection: 15 Power BI templates in one download
Browse all Power BI KPI dashboards.























Reviews
There are no reviews yet.