

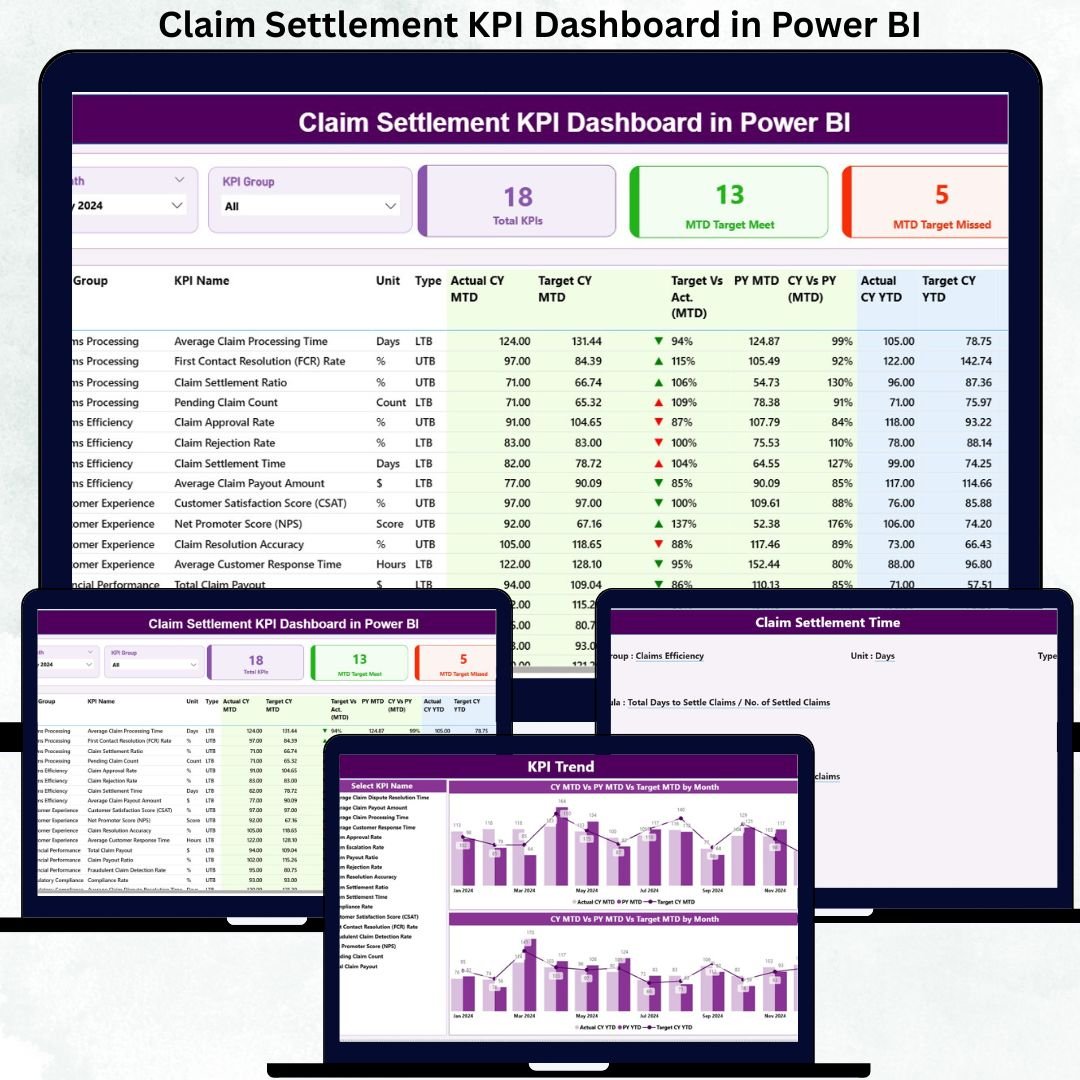

Insurance companies handle hundreds or thousands of claims every month—from health claims to motor, travel, property, and life insurance claims. Without a proper reporting system, claim teams struggle to track settlement timelines, understand monthly performance, identify delays, and improve customer satisfaction. Manual reports take too long to prepare and often hide important trends. That’s where the Claim Settlement KPI Dashboard in Power BI becomes a game-changing solution.
This ready-to-use dashboard converts raw claim data into clean and powerful visuals. With automated slicers, interactive pages, KPI cards, performance tables, and trend charts, claim teams get instant clarity on how well the settlement process is working. Since the dashboard uses an Excel file as the data source, analysts can update it easily—no coding or complex setup required. Whether you want to reduce claim aging, improve settlement timelines, or track SLA compliance, this dashboard gives you everything you need.
⚡ Key Features of Claim Settlement KPI Dashboard in Power BI
This dashboard includes three interactive pages, each designed to help insurance teams analyze performance quickly and accurately.
📊 Summary Page – Your Complete Performance Overview
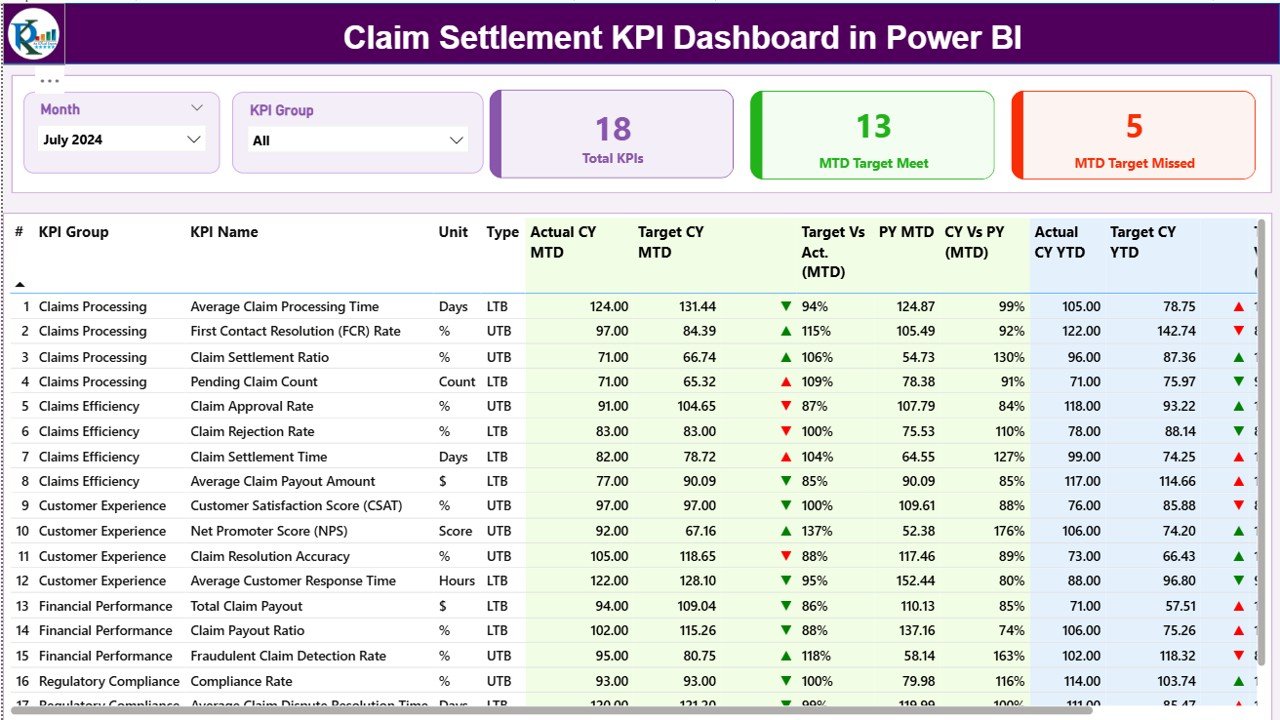
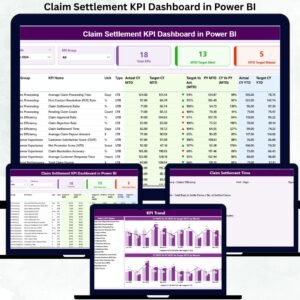
The Summary Page works as the main control panel of the dashboard. It includes:
📅 Month Selector – Review performance for any month
🗂 KPI Group Selector – Filter KPIs by category
📈 KPI Cards highlighting Total KPIs, MTD Target Met, and MTD Target Missed
📘 Detailed KPI Table showing:
KPI Name, Group, Unit & Type (LTB/UTB)
Actual vs Target (MTD & YTD)
Previous Year Comparison
Trend icons for instant interpretation
This page helps decision-makers understand whether claim teams are meeting targets, falling behind, or improving compared to last year.
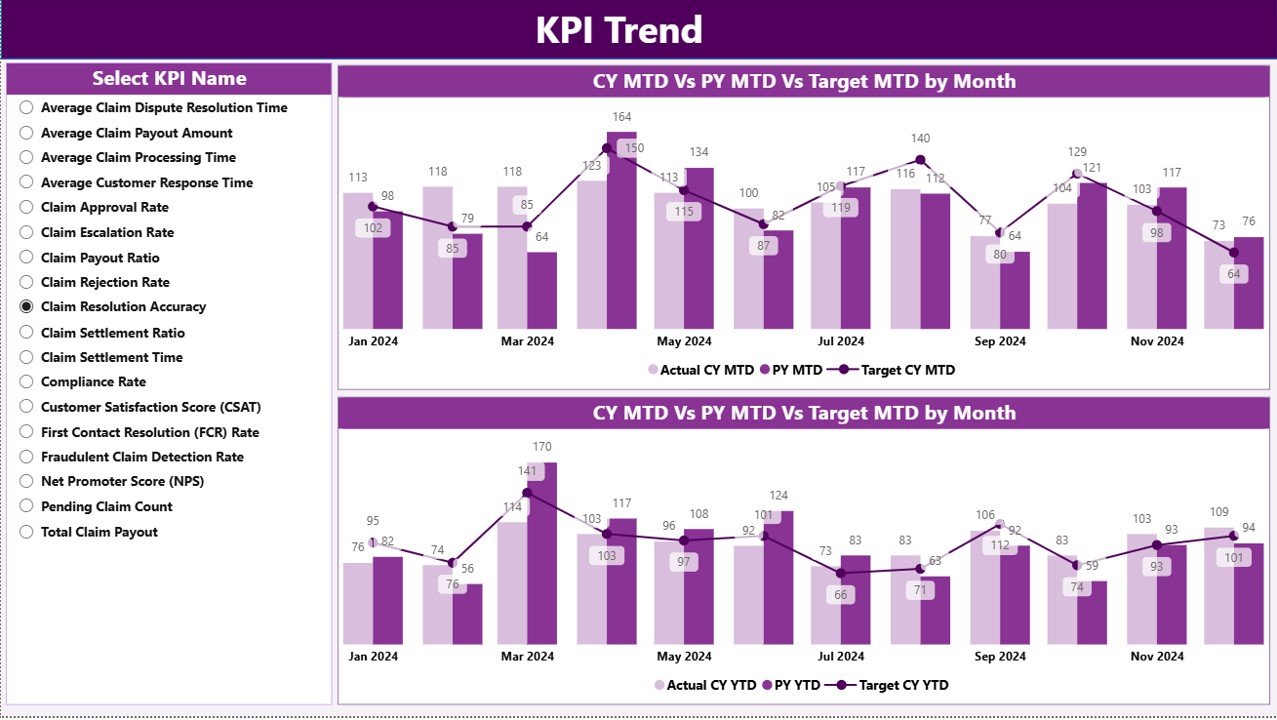
📈 KPI Trend Page – Visualizing Performance Over Time
This page includes two combo charts that show:
1️⃣ MTD Trends – Current Year, Previous Year & Target
2️⃣ YTD Trends – Current Year, Previous Year & Target
You can select any KPI from the slicer to update the charts.
Trend analysis helps organizations:
Detect seasonal patterns
Identify months with rising delays
View improvements or declines compared to last year
Review whether targets are realistic or need revision
This page is especially useful for monthly performance review meetings.
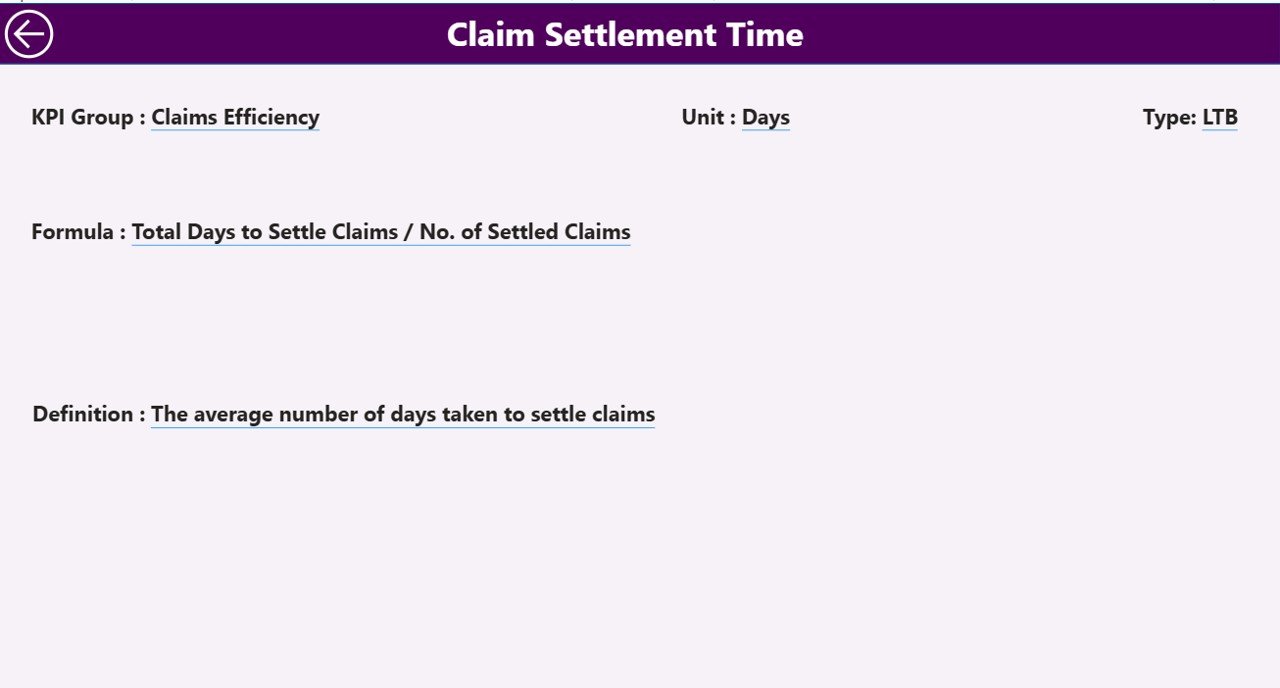
📝 KPI Definition Page (Drill-Through) – Full KPI Transparency
To build trust and clarity, this dashboard includes a drill-through page explaining each KPI in detail:
KPI Number
KPI Group
KPI Name
Unit
Formula
Definition
KPI Type (LTB or UTB)
Users click a KPI from the Summary Page to open this definition page instantly. This feature ensures complete alignment across claim teams, analysts, leadership, and auditors.
📦 What’s Inside the Claim Settlement KPI Dashboard in Power BI
When you download this digital product, you get:
📁 Fully automated Power BI (.pbix) dashboard
📊 Well-structured Excel data source with Actual, Target & KPI Definition sheets
🎛 Slicers for month and KPI group
📈 Trend charts for both MTD and YTD metrics
⚡ Conditional formatting & icons for fast interpretation
🧩 A clean, professional design ideal for monthly reviews
This dashboard requires no technical expertise—just update the Excel file and refresh Power BI.
🧭 How to Use the Claim Settlement Dashboard
Using this dashboard is simple and efficient:
1️⃣ Update Actual and Target values in the Excel file
2️⃣ Refresh Power BI
3️⃣ Select the reporting month
4️⃣ Explore Summary, Trend, and KPI Definition pages
5️⃣ Use insights to optimize workflows, reduce delays & improve SLAs
Anyone with basic Excel skills can maintain the entire dataset.
👥 Who Can Benefit from This Dashboard?
This tool is perfect for all insurance domains including health, motor, life, property, and travel.
Best suited for:
🧑💼 Claim Managers
📊 Insurance Analysts
📞 Customer Service Teams
🧾 Audit & Compliance Teams
🏢 Senior Leadership
If your goal is faster settlements, lower delays, and better customer satisfaction—this dashboard is essential.
### Click here to read the Detailed blog post
Visit our YouTube channel to learn step-by-step video tutorials
👉 Youtube.com/@PKAnExcelExpert
Watch the step-by-step video tutorial:
Compatibility and Requirements
- Works in Power BI Desktop, which is free. Microsoft explains how to get it in Get Power BI Desktop.
- The data source is an Excel file with Actual, Target and KPI Definition sheets. You update the numbers there and refresh Power BI.
Frequently Asked Questions
How many pages does the dashboard have?
Three: a Summary page, a KPI Trend page and a KPI Definition page that opens by drill-through.
How do I update the data?
Enter your Actual and Target values in the Excel file, then refresh Power BI. Select the reporting month and the KPI group on the Summary page.
What does the KPI Trend page show?
Two combo charts, one for MTD and one for YTD. Each shows the current year, the previous year and the target for the KPI you pick in the slicer.
What does the KPI Definition page contain?
KPI number, group, name, unit, formula, definition and type (LTB or UTB). Click a KPI on the Summary page to open it.
Is there an Excel or Google Sheets version?
Yes. See the Claim Settlement KPI Dashboard in Excel and the Claim Settlement KPI Dashboard in Google Sheets.
Related Insurance and Claims Templates
- Claim Settlement KPI Dashboard in Excel: the same KPIs in Excel
- Claim Settlement KPI Dashboard in Google Sheets: the Google Sheets edition
- Insurance Claim Dashboard in Power BI: a claims view in Power BI
- Insurance KPI Dashboard in Power BI: KPIs for the wider insurance business
- Power BI Dashboard Mega Collection: 15 Power BI templates in one download
Browse all Power BI KPI dashboards.




























Reviews
There are no reviews yet.