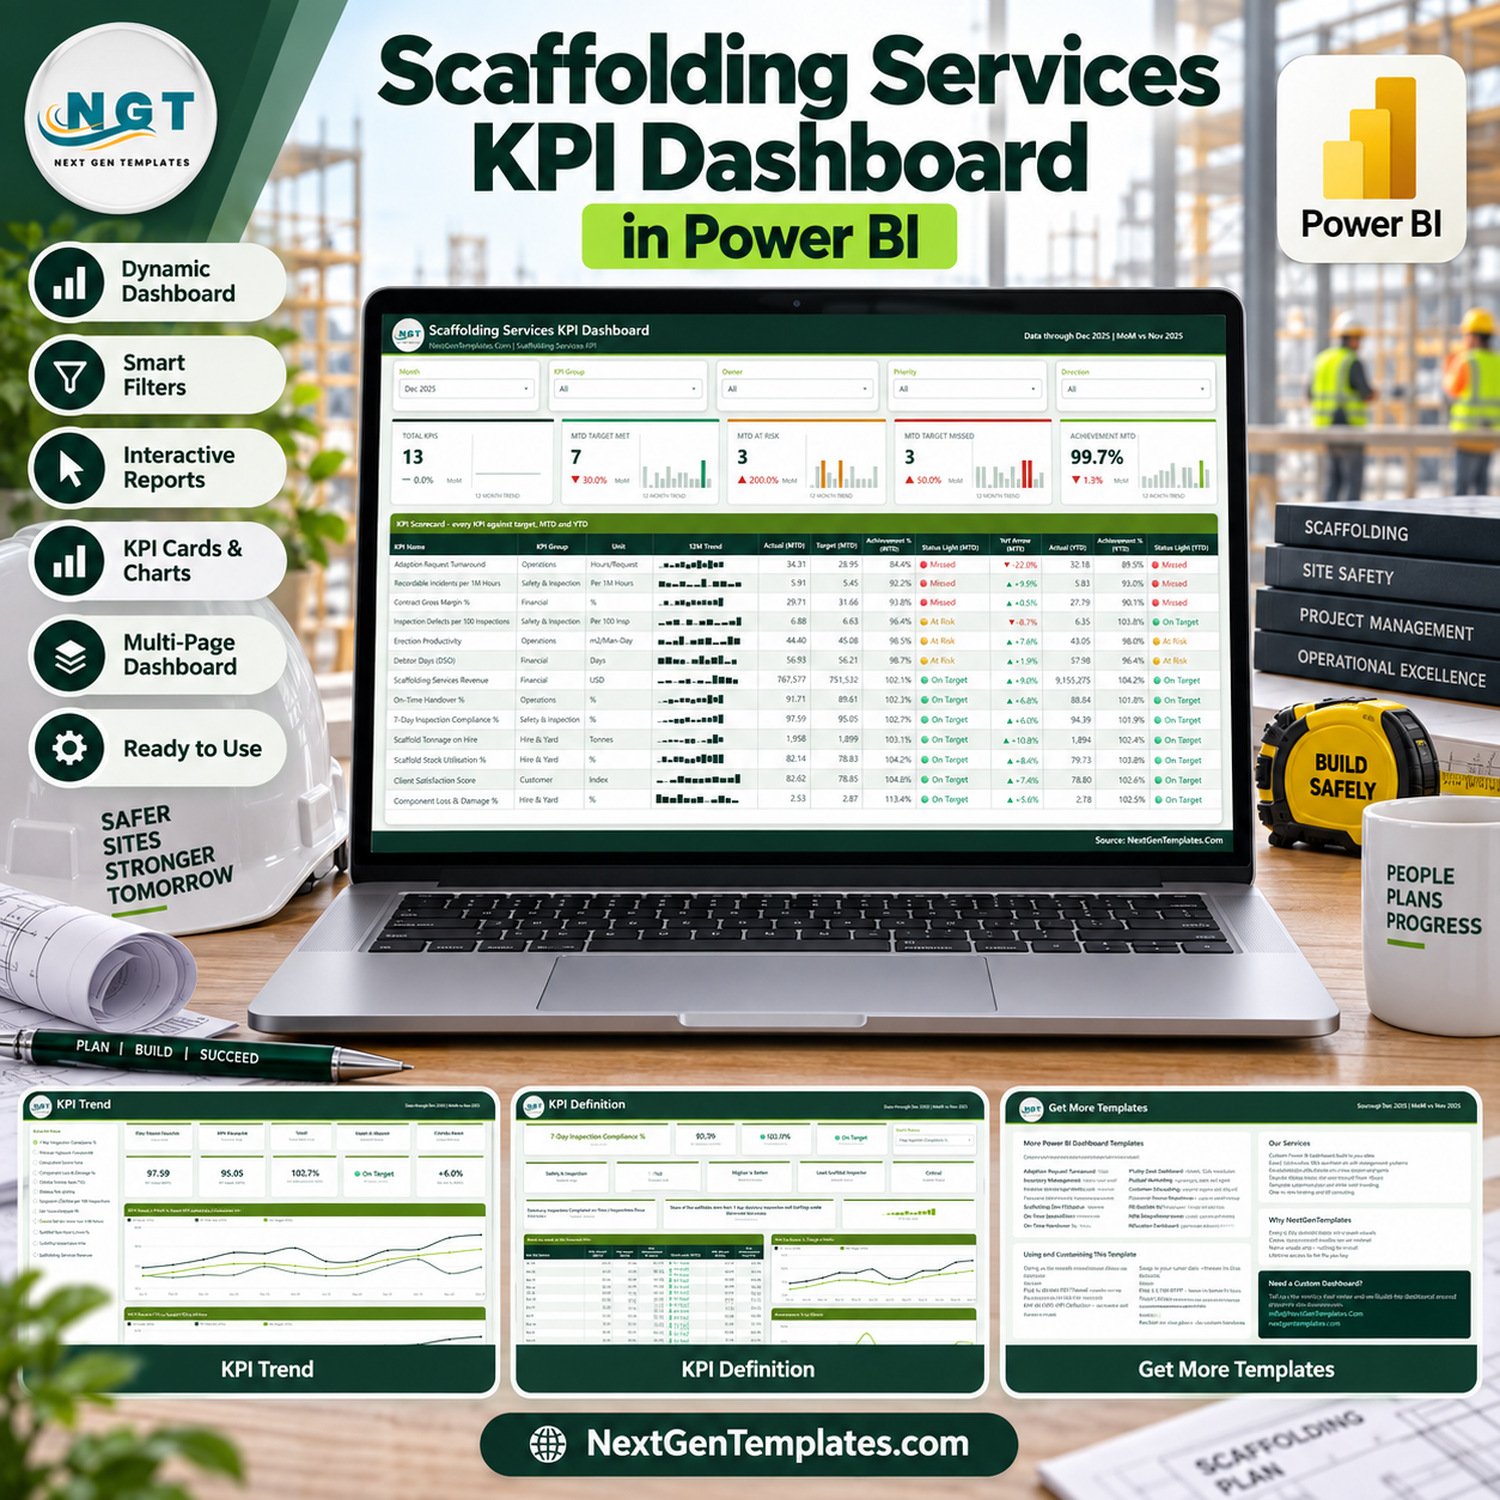
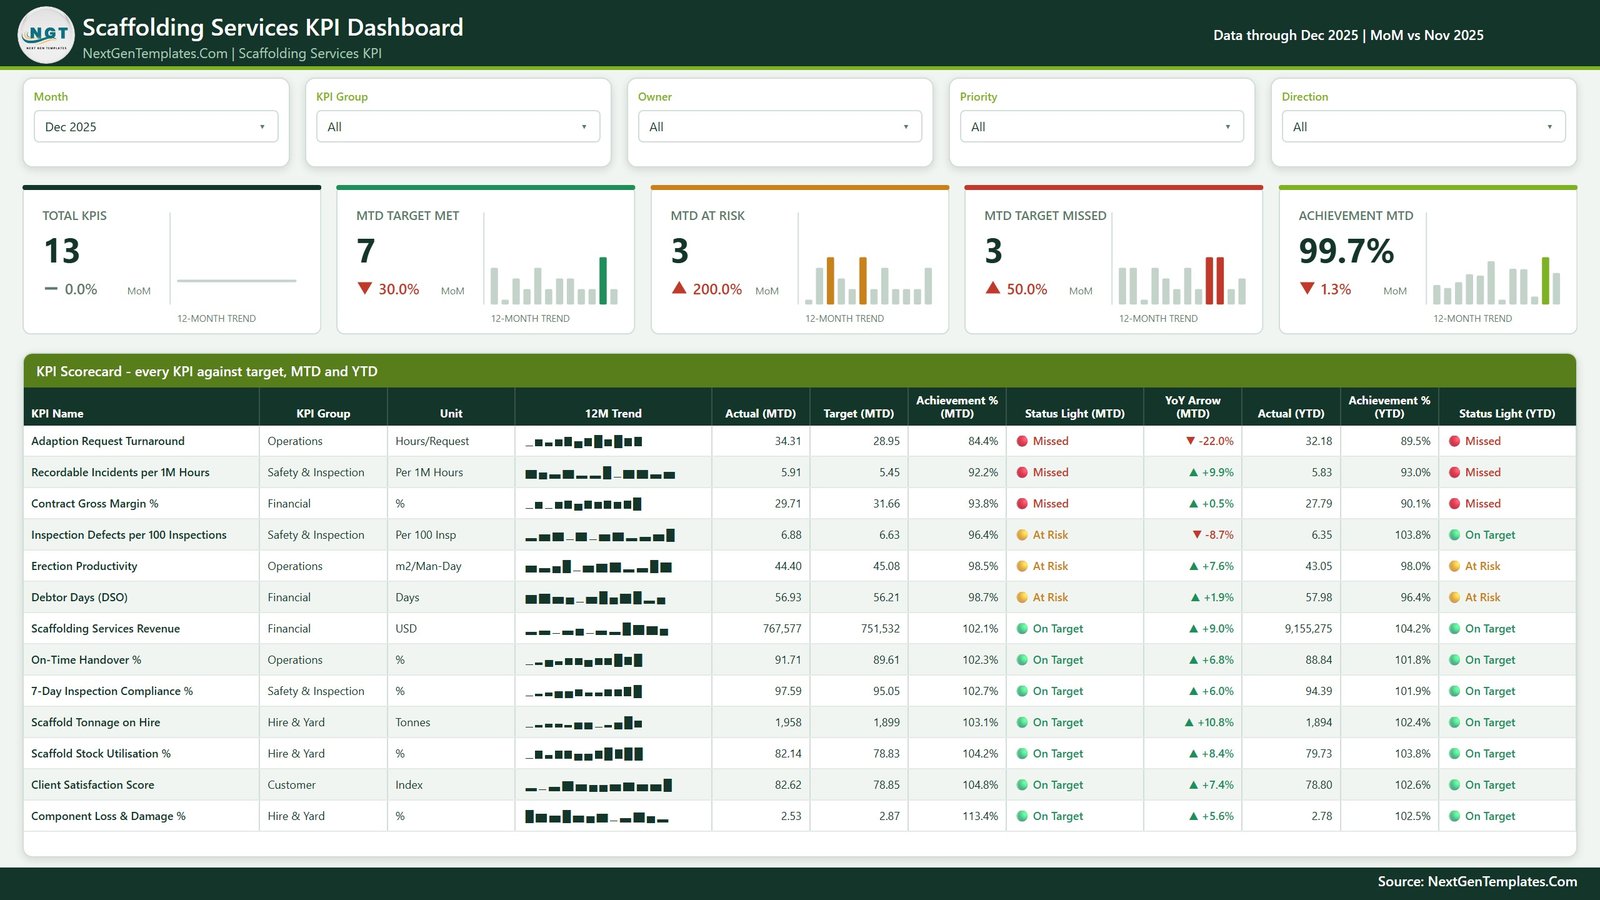
The Scaffolding Services KPI Dashboard in Power BI is a month-picker KPI scorecard for scaffold erection, hire and yard businesses. It scores 13 KPIs across 5 KPI groups, with MTD and YTD traffic lights and a 12-month sparkline per KPI, spread over 4 report pages. The December 2025 sample shows 7 KPIs On Target, 3 At Risk and 3 Missed, at 99.7% average MTD achievement.
This is the Power BI KPI Dashboard family: one scorecard page, a KPI Trend page, a KPI Definition page and a Get More Templates page. It is not one of our analytical Power BI dashboards, and it is a separate build from the Scaffolding Services KPI Scorecard in Google Sheets.
✅ Instant download · One-time payment · No subscription · No per-user fees · Lifetime access to the file
🔑 Key Features of the Scaffolding Services KPI Dashboard in Power BI
📅 Month picker with five slicers – Month, KPI Group, Owner, Priority and Direction filter every card and table on the scorecard. Pick any month and the MTD, YTD, traffic-light and month-on-month figures all move to that month.
🚦 Direction-aware traffic lights – 8 KPIs are higher-is-better and 5 are lower-is-better. Lower-is-better KPIs score Target ÷ Actual, so beating a Debtor Days or Component Loss & Damage target scores above 100%. On Target is 100% or more, At Risk is 95% to 100%, and Missed is below 95%.
📊 Five header cards with 12-month trends – Total KPIs, MTD Target Met, MTD At Risk, MTD Target Missed and Achievement MTD, each with a month-on-month change and a 12-month column trend.
🏗️ Scaffolding-specific KPIs – Scaffold Tonnage on Hire, Scaffold Stock Utilisation %, Component Loss & Damage %, Erection Productivity (m2 per man-day), Adaption Request Turnaround, On-Time Handover % and Debtor Days sit next to revenue, margin, safety and client satisfaction.
🔁 Fully data-driven – nothing in the report hard-codes a KPI. Rename, add or delete KPIs in the three input sheets of Data.xlsx, press Refresh, and the counts, scorecard, KPI list and charts follow.
📦 What’s Inside the Template
The download is a ZIP holding the .pbix report and its Data.xlsx source workbook. Data.xlsx has a Read Me sheet, a KPI Definition sheet (group, unit, formula, definition, UTB/LTB type, owner and priority), Input_ Target for 2025, and Input_ Actual for 2024 and 2025 so every prior-year and YoY figure has real rows behind it.
Page 1: KPI Scorecard
The main page. Five header cards and a 13-row scorecard with KPI Name, KPI Group, Unit, 12M Trend, Actual (MTD), Target (MTD), Achievement % (MTD), Status Light (MTD), YoY Arrow (MTD), Actual (YTD), Achievement % (YTD) and Status Light (YTD).
See it in the screenshot above.
Page 2: KPI Trend
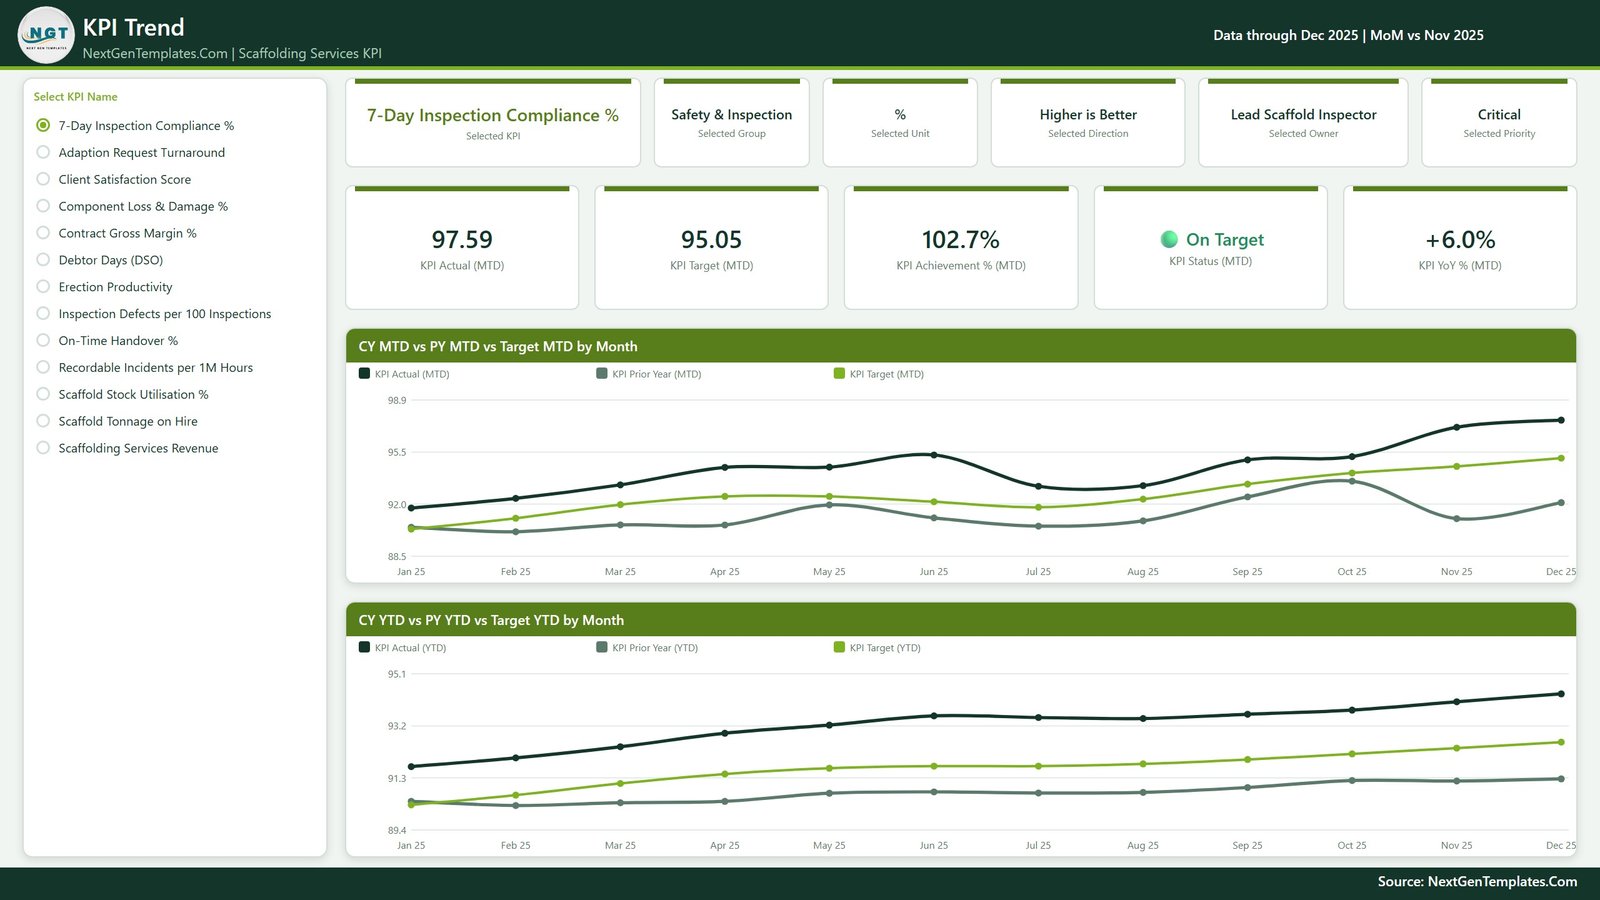
Choose one KPI from the list on the left and six context cards show its group, unit, direction, owner and priority, with five value cards for Actual, Target, Achievement %, Status and YoY %. Two charts follow: CY MTD vs PY MTD vs Target MTD by Month and CY YTD vs PY YTD vs Target YTD by Month.
Page 3: KPI Definition
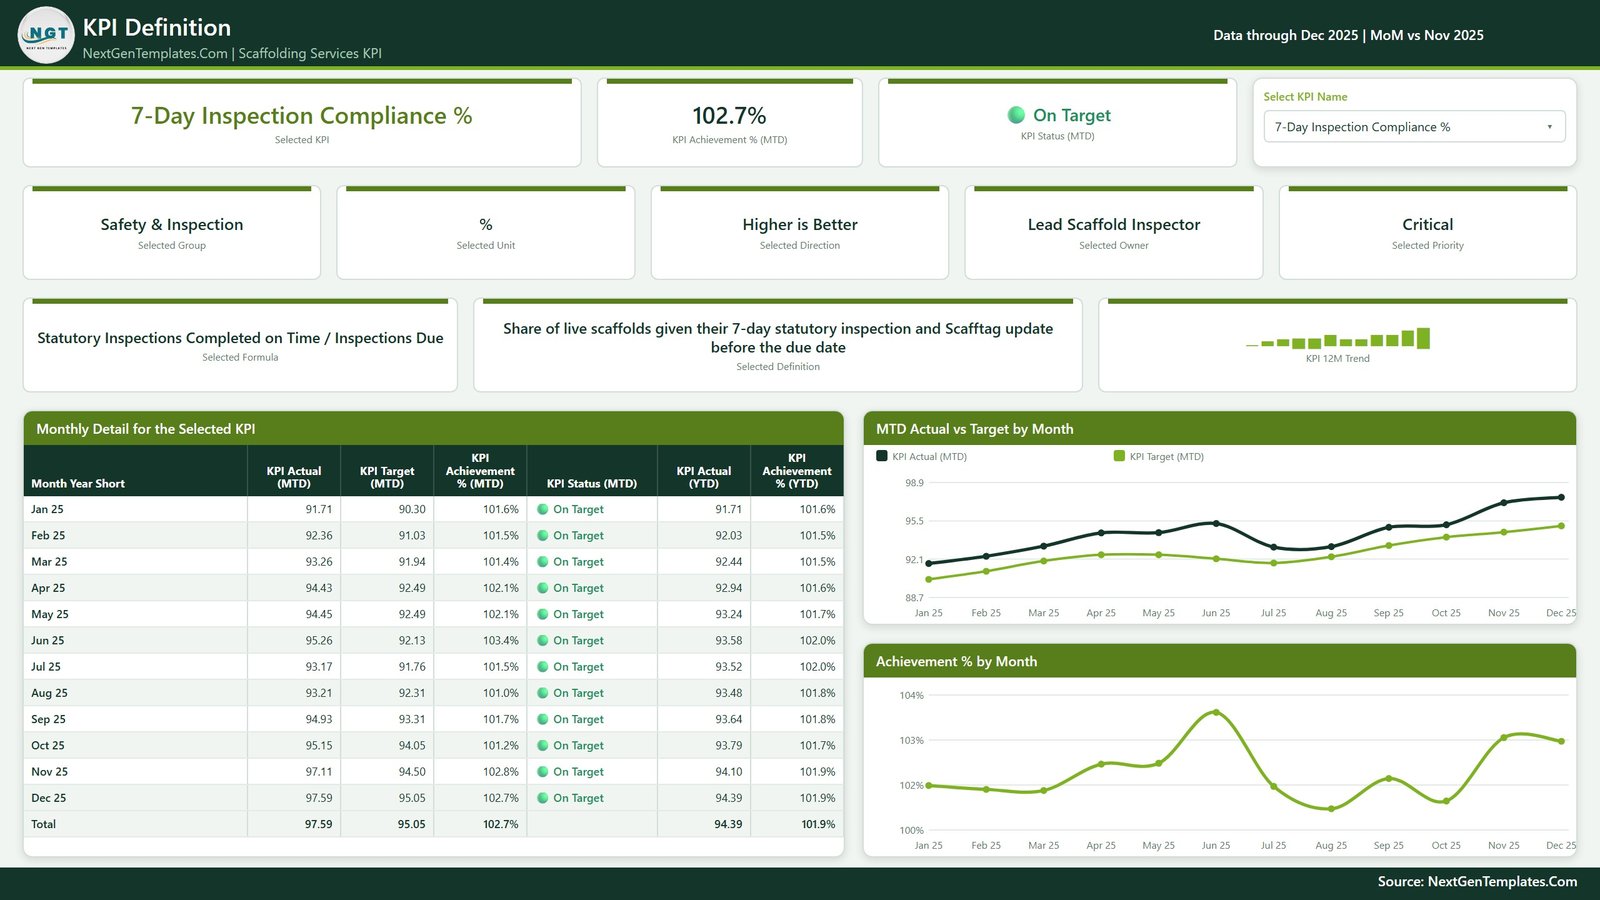
The same KPI selector, synced, shows the selected KPI’s formula, definition and 12-month trend, plus a Monthly Detail for the Selected KPI table and two charts: MTD Actual vs Target by Month and Achievement % by Month.
Page 4: Get More Templates
A reference page with tips on changing the month, swapping in your own data and recolouring the theme, plus links to more Power BI templates.

The 13 KPIs by group
- 💰 Financial: Scaffolding Services Revenue, Contract Gross Margin %, Debtor Days (DSO)
- 🏭 Hire & Yard: Scaffold Stock Utilisation %, Scaffold Tonnage on Hire, Component Loss & Damage %
- ⚙️ Operations: Erection Productivity, On-Time Handover %, Adaption Request Turnaround
- 🦺 Safety & Inspection: 7-Day Inspection Compliance %, Inspection Defects per 100 Inspections, Recordable Incidents per 1M Hours
- 🤝 Customer: Client Satisfaction Score
📊 This Template vs. Tableau / Qlik vs. Construction SaaS Reporting
| Feature | This Power BI KPI scorecard | Tableau / Qlik build | Construction SaaS (e.g. Procore analytics) |
|---|---|---|---|
| Cost | ✅ $12.99 one-time | Per-user licences plus build time | Recurring subscription, usually quote-based |
| Platform | Power BI Desktop (free, Windows) | Tableau or Qlik client | Vendor web app |
| Setup | ✅ Open the .pbix and explore at once | Design from a blank canvas | Onboarding and data integration |
| Scaffolding KPIs built in | ✅ 13, with formulas and definitions | None until you build them | Generic project metrics |
| Direction-aware traffic lights | ✅ Yes, UTB and LTB | Custom calculation needed | Varies by vendor |
| Customisable KPIs | ✅ Edit three sheets, then Refresh | Yes, with development | Limited to vendor fields |
| Share with a team | Needs a Power BI service licence | Server or cloud licence | ✅ Built in |
| Mobile access | Via Power BI service apps once published | Via vendor apps | ✅ Usually included |
| Year-1 cost at 5 users | ✅ $12.99 for the file (sharing licences separate) | Five annual licences | Five seats or a site quote |
For scaffolding firms that want a monthly KPI scorecard without a new software contract, this template sits in the sweet spot.
👥 Who This Template Is For — and Who It’s Not For
✅ This template is built for:
- Owners and commercial directors of scaffolding contractors who review a monthly KPI pack
- Hire desk and yard managers tracking tonnage on hire, stock utilisation and loss & damage
- Power BI users who want a ready KPI model they can rename for their own depot or region
❌ This template is NOT for:
- Teams looking for inspection, scaffold tagging or compliance software. This is a reporting template, and it carries no regulatory, certification or load-rating function
- Mac-only users with no Windows machine for Power BI Desktop
- Firms that need daily, job-level or live-feed reporting rather than monthly KPI values
⚙️ How to Use the Template
- Unzip the download and keep Data.xlsx in the same folder as the .pbix file.
- Open the .pbix in Power BI Desktop. If the refresh asks for the file, use Home > Transform data > Data source settings > Change Source.
- Edit KPI Definition in Data.xlsx: one row per KPI, with Type set to UTB or LTB.
- Type monthly MTD and YTD values into Input_ Target and Input_ Actual (the current and prior year).
- Press Home > Refresh, then pick a month on the KPI Scorecard page.
💼 Real-World Use Cases
A commercial director at a regional scaffolding contractor opens the scorecard on the first Monday of the month, filters Priority to Critical, and walks the board through the five Critical KPIs. The December sample flags Contract Gross Margin % as Missed at 93.8%.
A yard manager filters KPI Group to Hire & Yard and uses the KPI Trend page to compare Scaffold Stock Utilisation % against last year, month by month, before planning stock purchases.
A contracts manager filters Owner to their own name and checks Adaption Request Turnaround and Erection Productivity. In the sample both sit below target, so the next site meeting starts there.
❓ Frequently Asked Questions
What KPIs does this scaffolding KPI dashboard track?
It tracks 13 KPIs in five groups: Financial, Hire & Yard, Operations, Safety & Inspection and Customer. They include Scaffold Tonnage on Hire, Scaffold Stock Utilisation %, Component Loss & Damage %, Erection Productivity, On-Time Handover %, Recordable Incidents per 1M Hours and Client Satisfaction Score.
Do I need a paid Power BI licence?
No. Power BI Desktop is free from Microsoft and is all you need to open, edit and refresh the .pbix. You only need a Power BI service licence if you want to publish the report and share it online with colleagues.
Are YTD values calculated automatically?
No. YTD values are typed into Data.xlsx alongside MTD, not calculated by the report. The Read Me explains the rule: sum additive KPIs such as revenue and tonnage, and average rates, days and indexes such as percentages.
Does it check scaffold inspections or compliance?
No. It reports the monthly KPI values you enter, including inspection-related KPIs, but it does not record inspections, issue tags or check any regulation. The shipped figures are fictional sample data.
How long does setup take?
You can explore the sample report as soon as it opens. Moving to your own figures means editing the KPI Definition sheet, pasting monthly values into two input sheets and pressing Refresh. The work depends on how quickly you can pull your monthly numbers.
How does it compare with a construction SaaS subscription?
This template is a one-time $12.99 file focused on a monthly KPI scorecard. Construction SaaS platforms add job management and mobile field apps, but charge a recurring subscription. If you only need the scorecard, the template covers it without a contract.
👤 About the Author
Built by PK, a Microsoft Certified Professional with 15+ years of Excel, Google Sheets and Power BI experience and the founder of NextGenTemplates. Tutorials are on YouTube at @PKAnExcelExpert and @NextGenTemplates. Every template is hand-built and tested before release.
🔗 Explore Related Templates
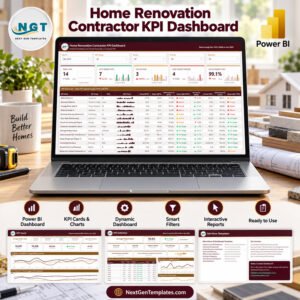
📈 Home Renovation Contractor KPI Dashboard in Power BI – the same four-page KPI scorecard for renovation contractors.
🧱 Concrete Contractor KPI Dashboard in Power BI and Masonry Contractor KPI Dashboard in Power BI – sibling trades on the same model.
🏗️ Crane Rental KPI Scorecard in Google Sheets – for access and lifting hire businesses that work in Sheets.
🗂️ Browse all Power BI KPI Dashboard templates or the full Power BI template catalogue.
🔄 Also available as a separate build: Scaffolding Services KPI Scorecard in Google Sheets. Excel and Google Sheets KPI dashboard editions of this topic are in preparation.
📖 Click here to read the detailed blog post
🎥 Visit our YouTube channel for step-by-step video tutorials
👉 YouTube.com/@PKAnExcelExpert
📅 Last updated: September 2026