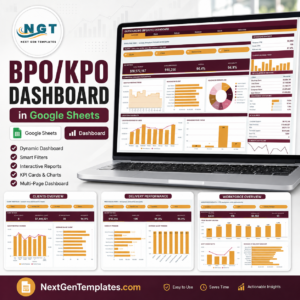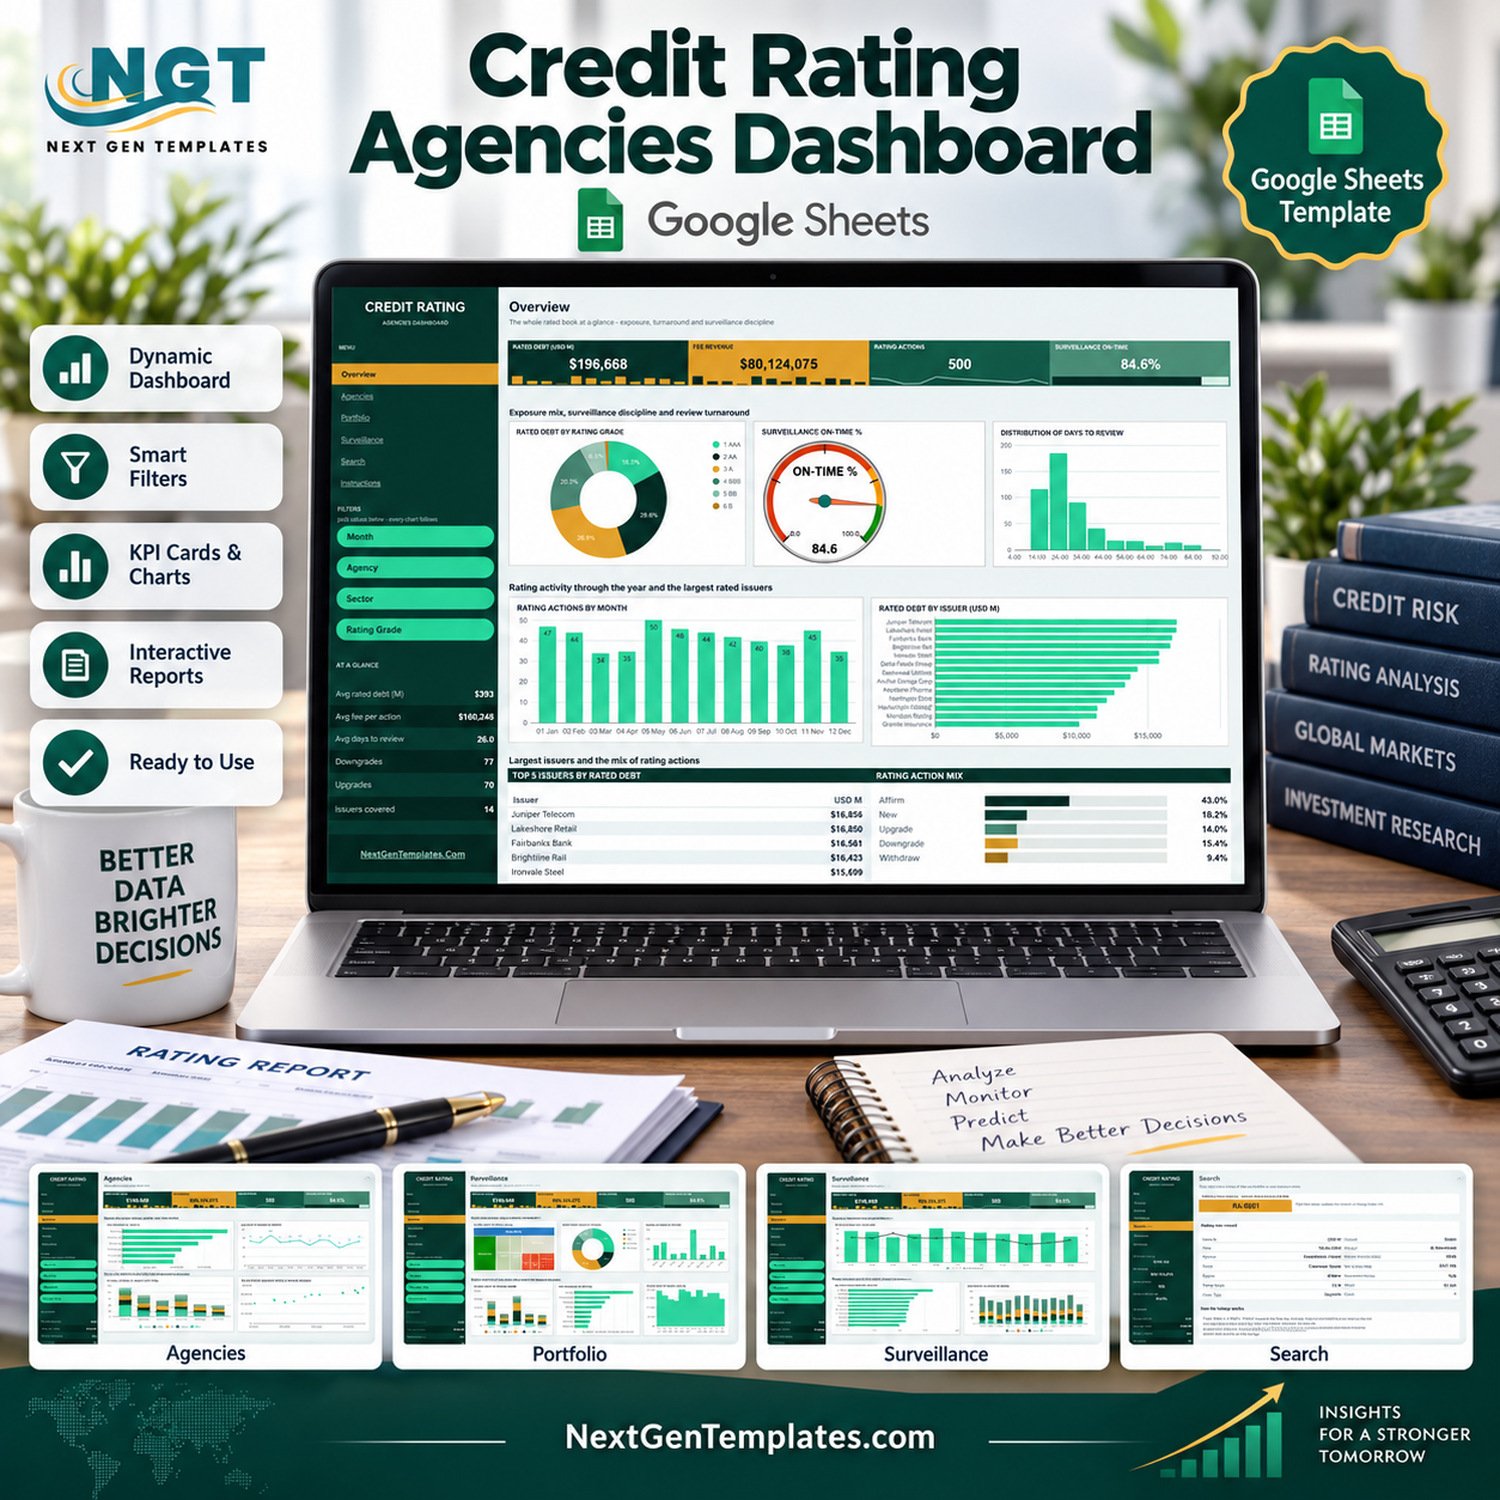
The Credit Rating Agencies Dashboard in Google Sheets turns a log of rating actions into a six-page report: 500 sample rating actions, 4 headline KPI tiles, 18 charts and 15 slicers, all driven by native Google Sheets pivot tables. The sample book covers 6 fictional agencies, 14 fictional issuers, 8 sectors, 5 regions, a 6-grade rating scale and 10 analysts across twelve months, and the pivots already read 1,000 data rows. Make your copy, paste your own rating actions over the sample rows and every chart redraws itself.
🌍 Join 8,400+ teams in 40+ countries using NextGenTemplates to replace paid SaaS tools with one-time-purchase Excel, Google Sheets, Power BI and HTML templates.
✅ Instant download · One-time payment · No subscription · No per-user fees · Lifetime access
🔑 Key Features of the Credit Rating Agencies Dashboard in Google Sheets
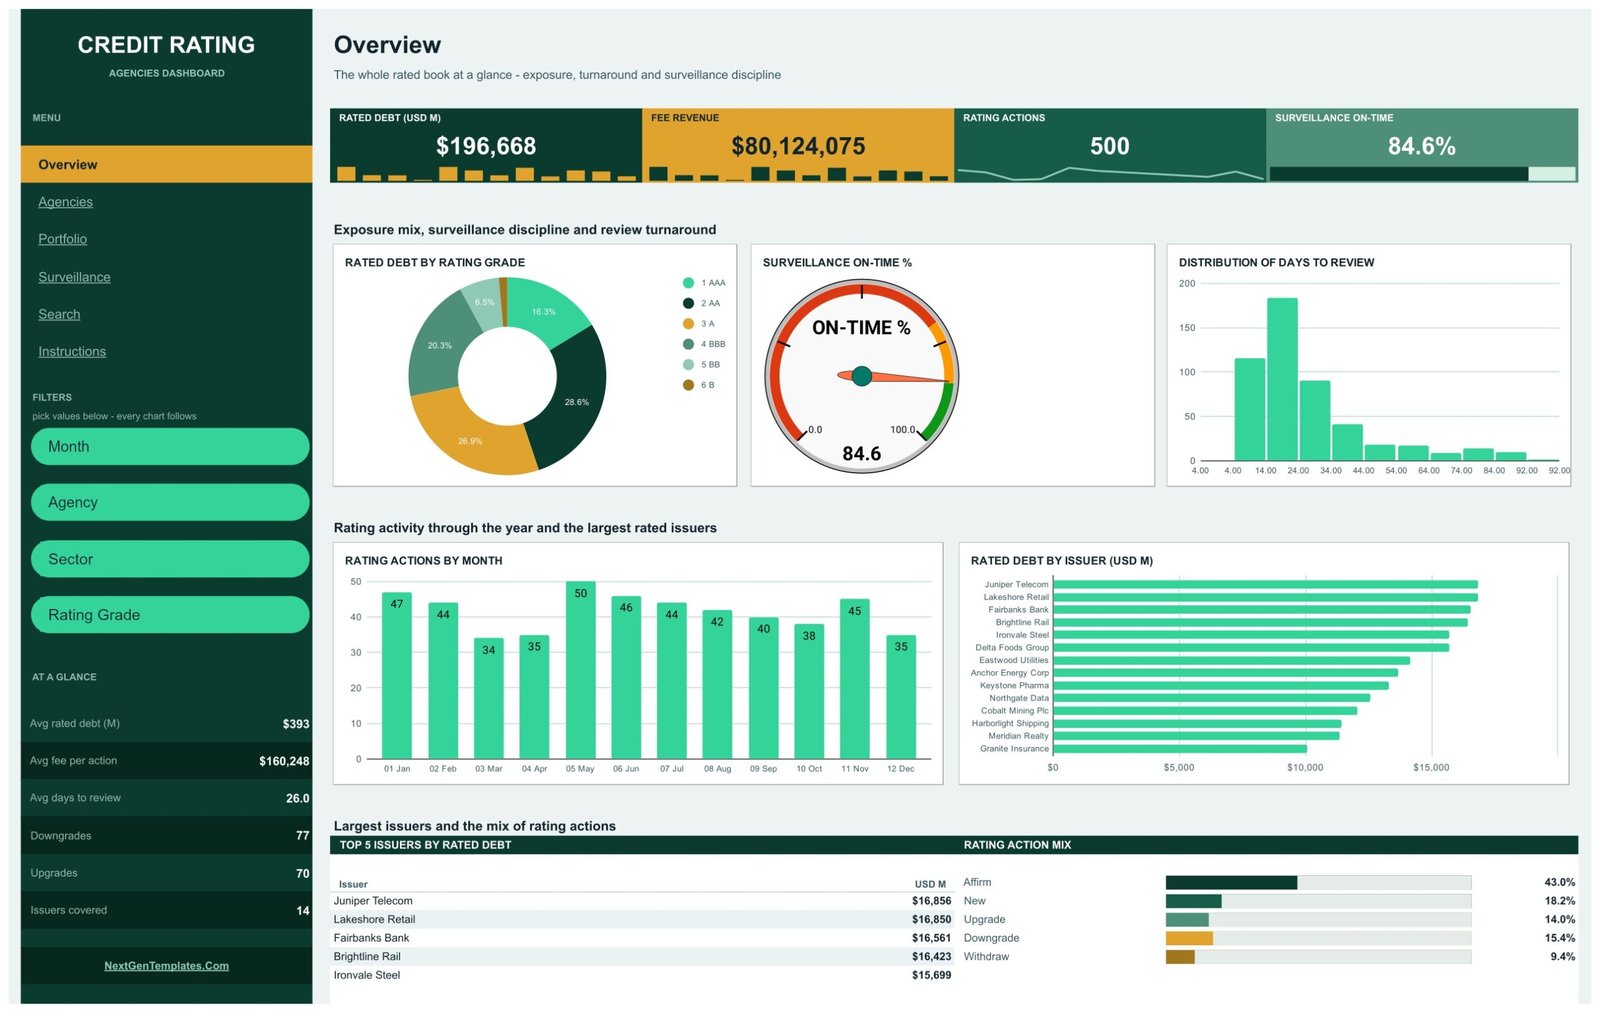
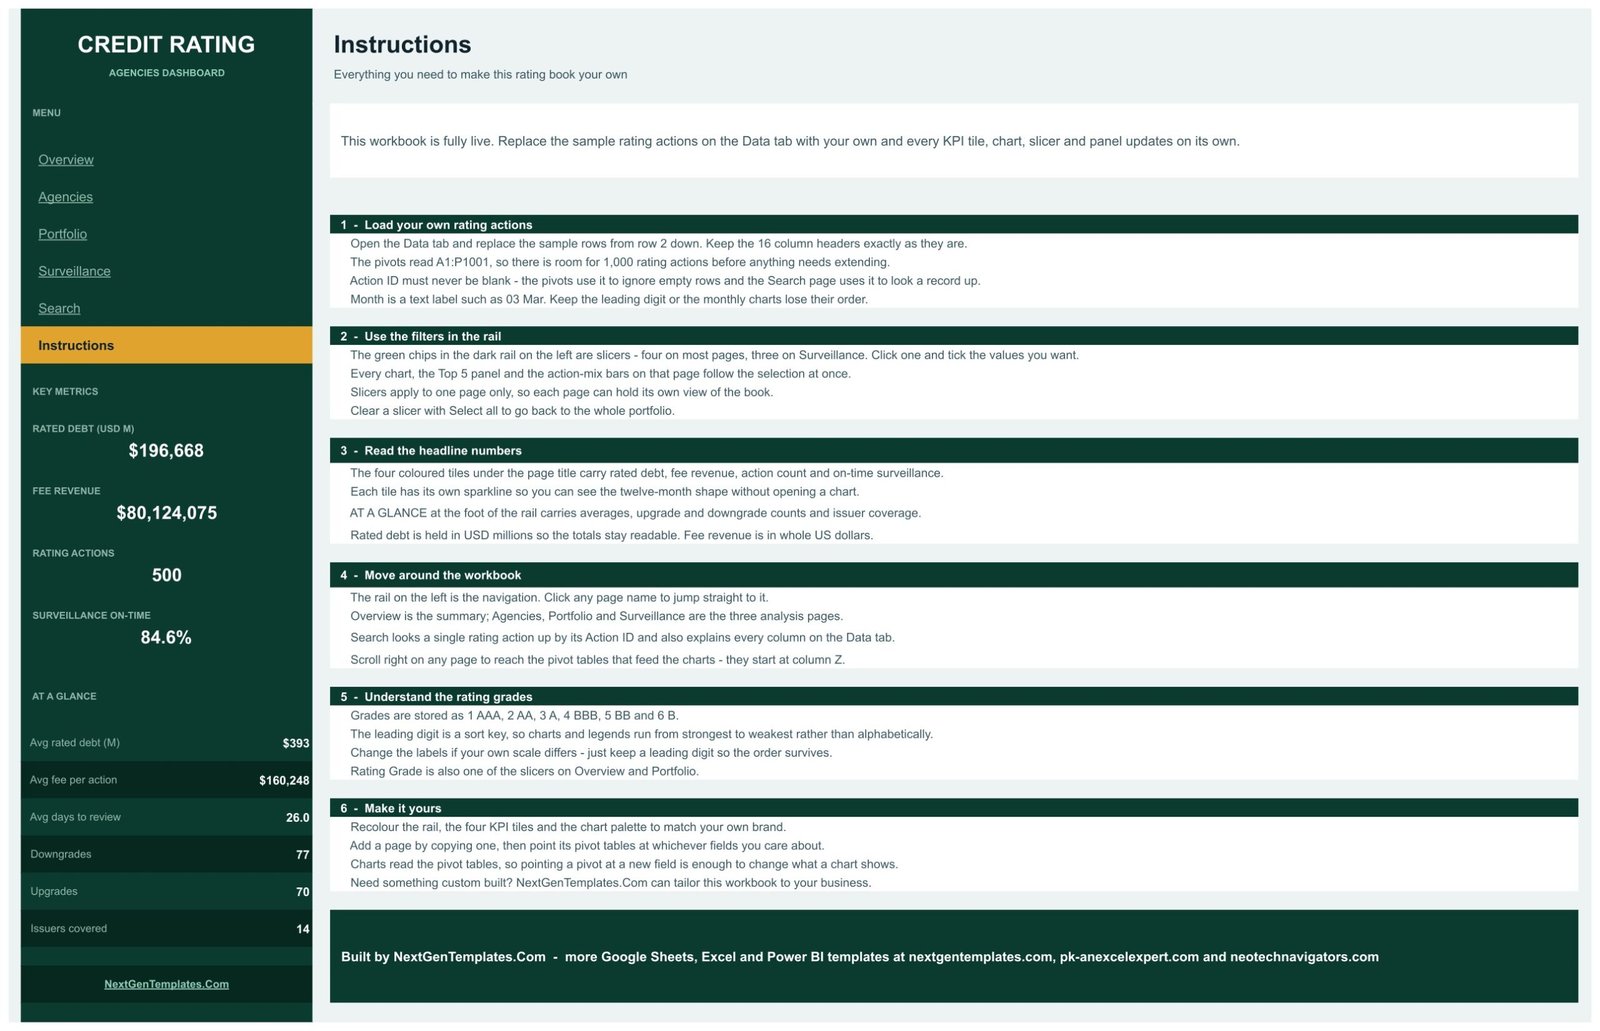
🔹 Four headline tiles on every page. Rated Debt (USD M) reads $196,668 in the sample, Fee Revenue $80,124,075, Rating Actions 500 and Surveillance On-Time 84.6%. Each tile carries its own twelve-month sparkline or progress bar, so the shape of the year is visible before you open a chart.
🔹 Exposure, fees and turnaround in one workbook. Rated debt is cut by rating grade, issuer, sector, region and month; fee revenue by agency and sector; review turnaround by month and by analyst. The three questions a ratings desk asks every month sit on four linked pages.
🔹 Fifteen slicers in a dark left rail. Overview filters by Month, Agency, Sector and Rating Grade; Agencies by Agency, Action Type, Month and Region; Portfolio by Sector, Region, Rating Grade and Outlook; Surveillance by Agency, Analyst and On-Time. Slicers apply per page, so each page can hold its own view.
🔹 An AT A GLANCE strip. Average rated debt per action ($393M), average fee per action ($160,248), average days to review (26.0), downgrades (77), upgrades (70) and issuers covered (14) sit at the foot of the rail on every analysis page.
🔹 A rating-action Search page. Type an Action ID such as RA-0001 and read the full 16-field record. Every field is an INDEX / MATCH wrapped in IFERROR, so an unknown ID reads “Not found” instead of an error.
🧾 What This Template Does, and What It Deliberately Does Not Do
This is a reporting template for rating-action data you already keep. It summarises what was rated, by whom, for how much fee and how quickly. It is not a credit rating model or methodology, it produces no credit opinion, and it gives no investment advice. It is not an NRSRO or credit rating agency compliance system and makes no SEC, ESMA or SEBI regulatory claim. The Surveillance On-Time field is a Yes / No value you enter; the workbook does not run a review calendar for you. Every agency, issuer and analyst name in the sample (Apex Ratings, Dominion Credit, Juniper Telecom and so on) is a fictional label, and the grades are a simplified six-step sample scale.
📦 What’s Inside the Credit Rating Agencies Dashboard in Google Sheets
Page 1: Overview, exposure mix, surveillance and turnaround
Overview shows the four headline tiles, then Rated Debt by Rating Grade (2 AA holds 28.6% of the sample book), a Surveillance On-Time % gauge at 84.6, a Distribution of Days to Review histogram, Rating Actions by Month and Rated Debt by Issuer. A Top 5 Issuers by Rated Debt panel (Juniper Telecom leads at $16,856M) and the Rating Action Mix bars close the page.
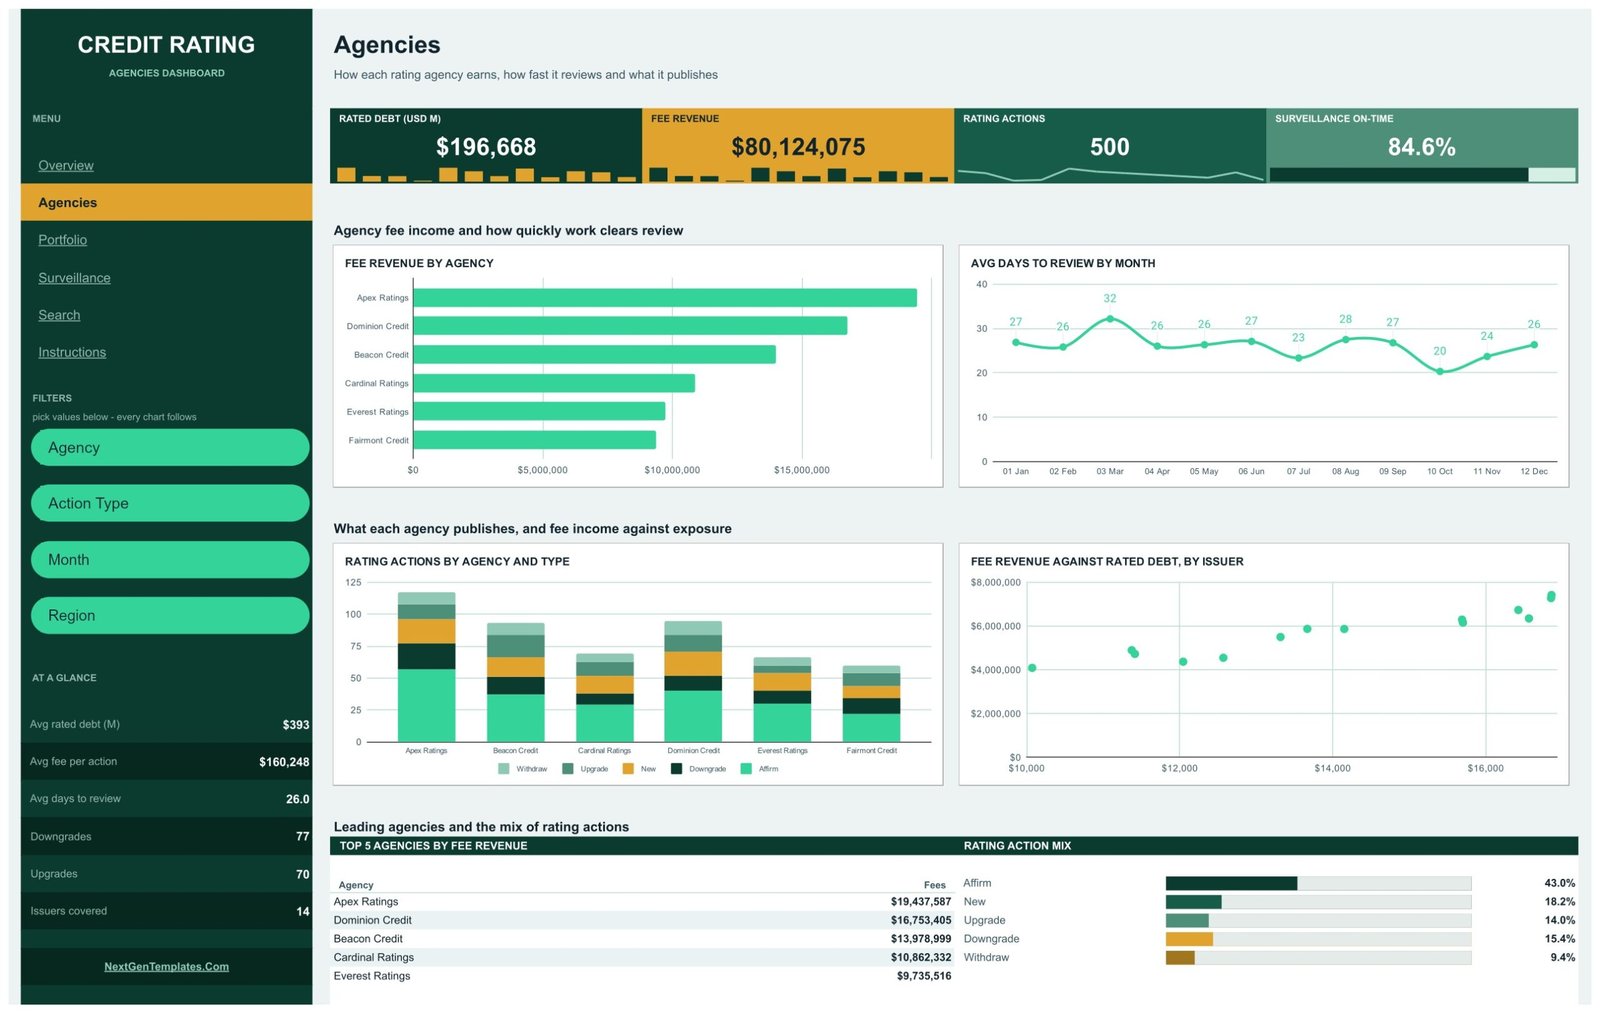
Page 2: Agencies, fee income and review speed
Agencies compares the six sample agencies: Fee Revenue by Agency, Avg Days to Review by Month, Rating Actions by Agency and Type (stacked by New, Upgrade, Downgrade, Affirm and Withdraw) and Fee Revenue against Rated Debt by Issuer. The Top 5 Agencies by Fee Revenue panel shows Apex Ratings first at $19,437,587.
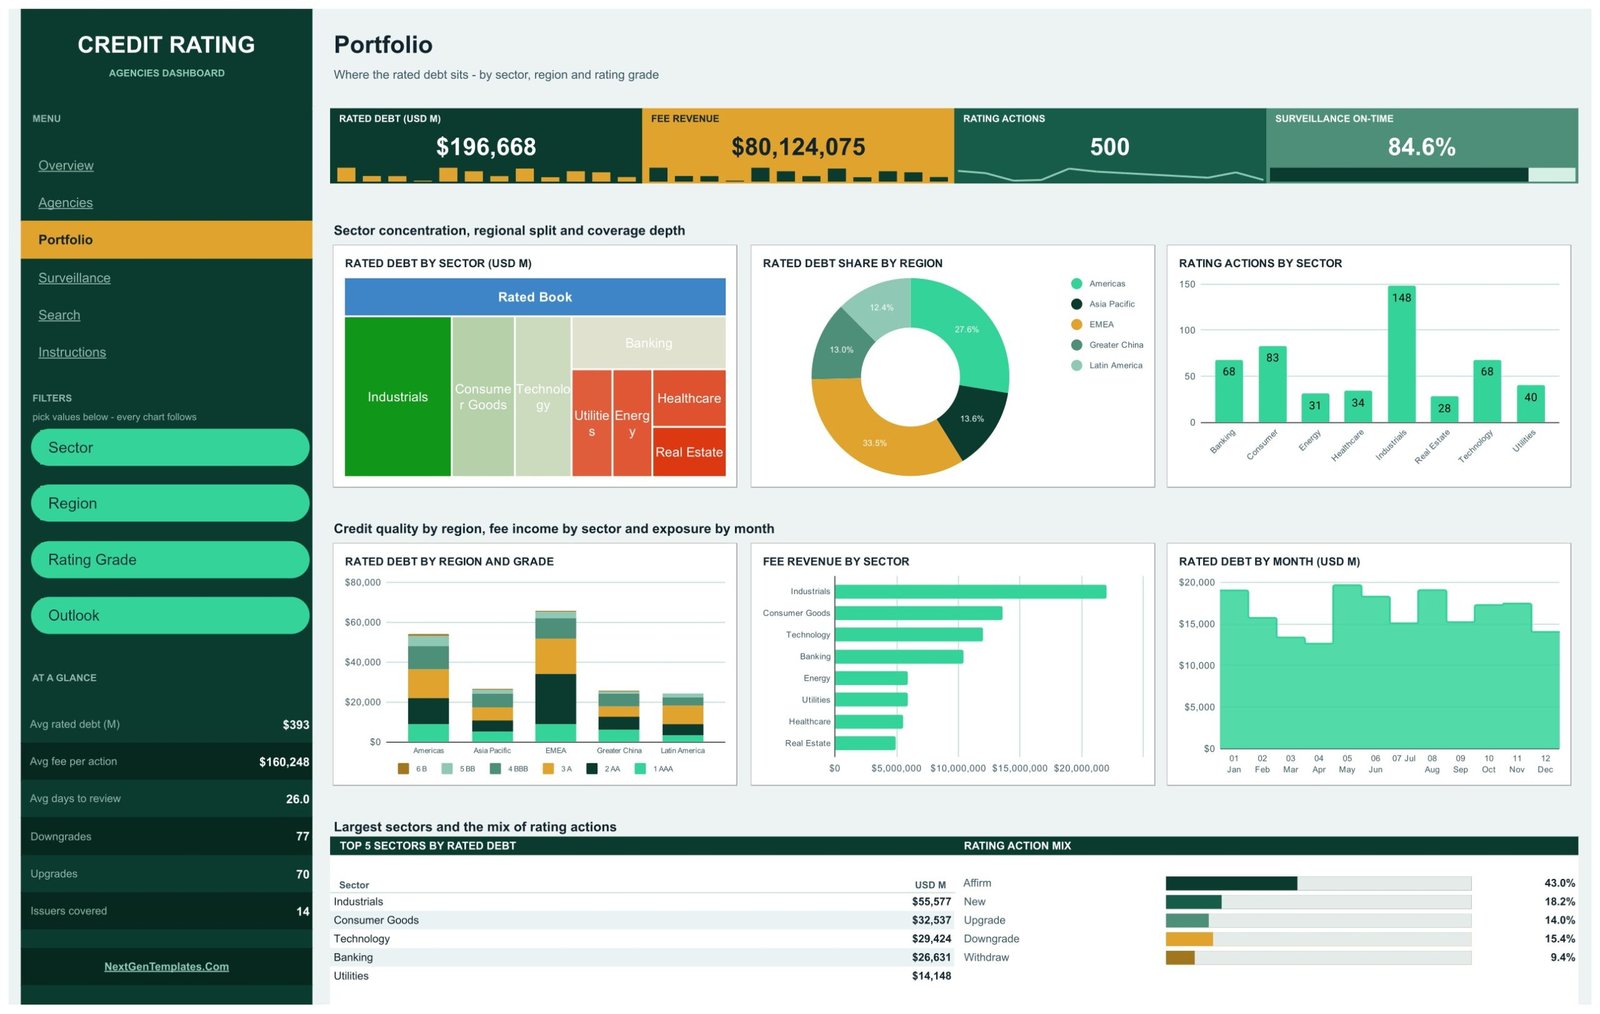
Page 3: Portfolio, sector, region and grade
Portfolio shows where the rated debt sits: Rated Debt by Sector, Rated Debt Share by Region (EMEA 33.5%, Americas 27.6%), Rating Actions by Sector (Industrials 148), Rated Debt by Region and Grade, Fee Revenue by Sector and Rated Debt by Month, plus a Top 5 Sectors by Rated Debt panel.
Page 4: Surveillance, workload and outlooks
Surveillance pairs workload with turnaround: Rating Actions and Avg Days to Review by Month on one combo chart, Avg Days to Review by Analyst across 10 analysts, and Outlooks Published by Month split into Stable, Positive, Negative and Developing. The lower panel repeats the Top 5 Agencies by Fee Revenue table from the Agencies page.

Page 5: Search, look up any rating action by ID
Search pulls one rating action straight from the Data tab: date, agency, issuer, sector, region, rating grade, action type, outlook, analyst, rated debt, fee revenue, days to review, on-time flag and month. Below it, a column guide explains what every Data tab field means.

Page 6: Instructions, the user guide inside the file
Six numbered steps cover loading your own rating actions, using the slicers, reading the headline numbers, moving around the workbook, understanding the 1 AAA to 6 B grade labels and recolouring or extending the file.
📊 Google Sheets Dashboard vs. an Excel Dashboard vs. a Paid BI Suite, Where This Fits
| Feature | This Google Sheets dashboard | Microsoft Excel dashboard | Power BI Pro / Tableau Creator |
|---|---|---|---|
| Cost | $9.99 one-time ✅ | $13.99 one-time + Microsoft 365 | $14-75 / user / month |
| Platform | Google Sheets, browser only ✅ | Desktop Excel | Desktop authoring + service |
| Setup time | Under 10 minutes ✅ | Under 15 minutes | Days: model, publish, licence |
| Real-time team collaboration | Built in ✅ | Only via OneDrive co-authoring | Yes, per seat |
| Mobile access | Google Sheets app ✅ | Excel mobile, limited slicers | Vendor app, per seat |
| Share with a link | Any Google account ✅ | File send or OneDrive link | Viewers need a licence |
| Year-1 cost at 5 users | $9.99 ✅ | $13.99 + 5 Microsoft 365 seats | $840-4,500 |
| Rating-action record lookup | Search page, no add-ons ✅ | Needs a lookup sheet | Drillthrough page |
| Row capacity out of the box | 1,000 rating actions | Excel row limit | Millions ✅ |
For a ratings team that wants its action log summarised without paying per-seat BI licences, this Google Sheets dashboard sits in the sweet spot.
👥 Who This Template Is For, and Who It’s Not For
✅ Built for:
- Team leads at boutique or regional rating firms who already log rating actions in a spreadsheet and want a monthly management pack
- Credit research and fixed-income operations teams summarising the rating actions they track on the issuers they follow
- Finance lecturers and trainers who need realistic, clearly fictional rating-action data to teach with
❌ Not for:
- Anyone looking for a rating model, scoring methodology or a source of real credit opinions
- Registered agencies needing regulatory record-keeping, audit trails or SEC / ESMA / SEBI reporting
- Books far beyond 1,000 actions a year or live market-data feeds; a database-backed BI tool fits better
⚙️ How to Use the Dashboard
- Open the PDF in your download and click the link to make your own copy in Google Drive.
- Open the Data tab and replace the sample rows from row 2 down, keeping the 16 column headers exactly as they are.
- Give every row an Action ID; the pivots use it to ignore empty rows and Search uses it to find a record.
- Keep the Month label format such as 03 Mar, with its leading digit, so the monthly charts stay in order.
- Pick values in the slicers on each page, and clear them with Select all to return to the whole book.
💼 Real-World Use Cases
Maya leads a six-analyst ratings desk at a regional firm. She pastes the month’s actions in, filters Surveillance by analyst and brings Avg Days to Review by Analyst to her team meeting, instead of building a pivot by hand every month.
Daniel runs credit research operations at an insurer. He logs the rating actions published on the issuers his team follows and uses Portfolio to show committee members how that exposure splits by sector, region and grade. The decisions stay with the committee; the dashboard only organises the record.
Priya teaches a fixed-income module. The fictional agencies and issuers let her students practise reading upgrades, downgrades and outlooks without touching anyone’s real credit history.
❓ Frequently Asked Questions
What does the Credit Rating Agencies Dashboard in Google Sheets track?
It tracks rated debt in USD millions, fee revenue, rating action counts and the share of surveillance reviews completed on time, then cuts them by agency, issuer, sector, region, rating grade, action type, outlook, analyst and month across 18 charts on four analysis pages.
Are the agencies, issuers and ratings real?
No. Every agency, issuer and analyst name in the sample is fictional, and the six grades are sample labels. Nothing in the file is a credit opinion or investment advice. Replace the sample rows with your own records.
Is this a rating model or a regulatory compliance system?
No. It is a reporting template. It does not calculate ratings, apply a methodology, keep regulatory records or satisfy NRSRO or credit rating agency rules under the SEC, ESMA or SEBI. It summarises rating actions you have already recorded.
Do the headline tiles follow the slicers?
The built-in Instructions page says every chart, the Top 5 panel and the action-mix bars on a page follow that page’s slicers. It does not list the four headline tiles or the AT A GLANCE figures, so check those after filtering rather than assuming they move.
How is it different from the Credit Rating Agencies KPI Dashboard?
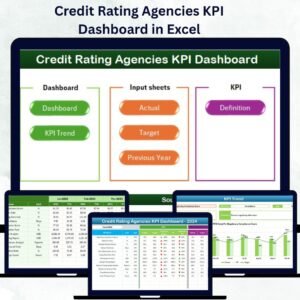
The KPI Dashboard editions are month-picker scorecards with targets and traffic lights. This Google Sheets dashboard is an analytical workbook built on a rating-action log, with pivot charts, slicers and a Search page.
How long does setup take, and how many actions can it hold?
Most users are running in under 10 minutes: make a copy, paste rows, done. The pivots read A1:P1001, so the file holds 1,000 rating actions before any range needs extending.
👤 About the Author
Built by PK, a Microsoft Certified Professional with 15+ years of Excel, Google Sheets and Power BI experience. Founder of NextGenTemplates, reaching 300K+ subscribers across YouTube channels (@PKAnExcelExpert, @NextGenTemplates, @NeoTechNavigators). Every template is hand-built and tested before release.
🔗 Explore Related Templates
Browse the full range of Google Sheets Dashboards and the wider Google Sheets template library. Google’s own guide to slicers in Google Sheets explains the filters this workbook uses.
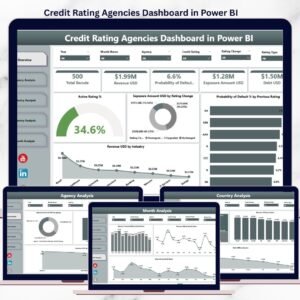
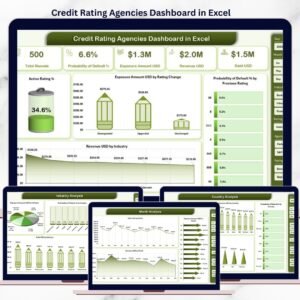
Same subject, other platforms: the Credit Rating Agencies Dashboard in Excel and the Credit Rating Agencies Dashboard in Power BI are separate builds with their own layouts and sample data, not ports of this file.
Different family, same subject: the Credit Rating Agencies KPI Dashboard in Excel and the Credit Rating Agencies KPI Dashboard in Power BI are month-picker scorecards with traffic lights.
Pair it with the Investor Relations Dashboard in Google Sheets, the Banking Dashboard in Google Sheets or the Credit Recovery Agencies Dashboard in Excel.
📖 Click here to read the Detailed Blog Post
🎥 Visit our YouTube channel for step-by-step video tutorials
👉 YouTube.com/@NextGenTemplates
Watch the step-by-step video Demo:
📅 Last updated: September 2026