

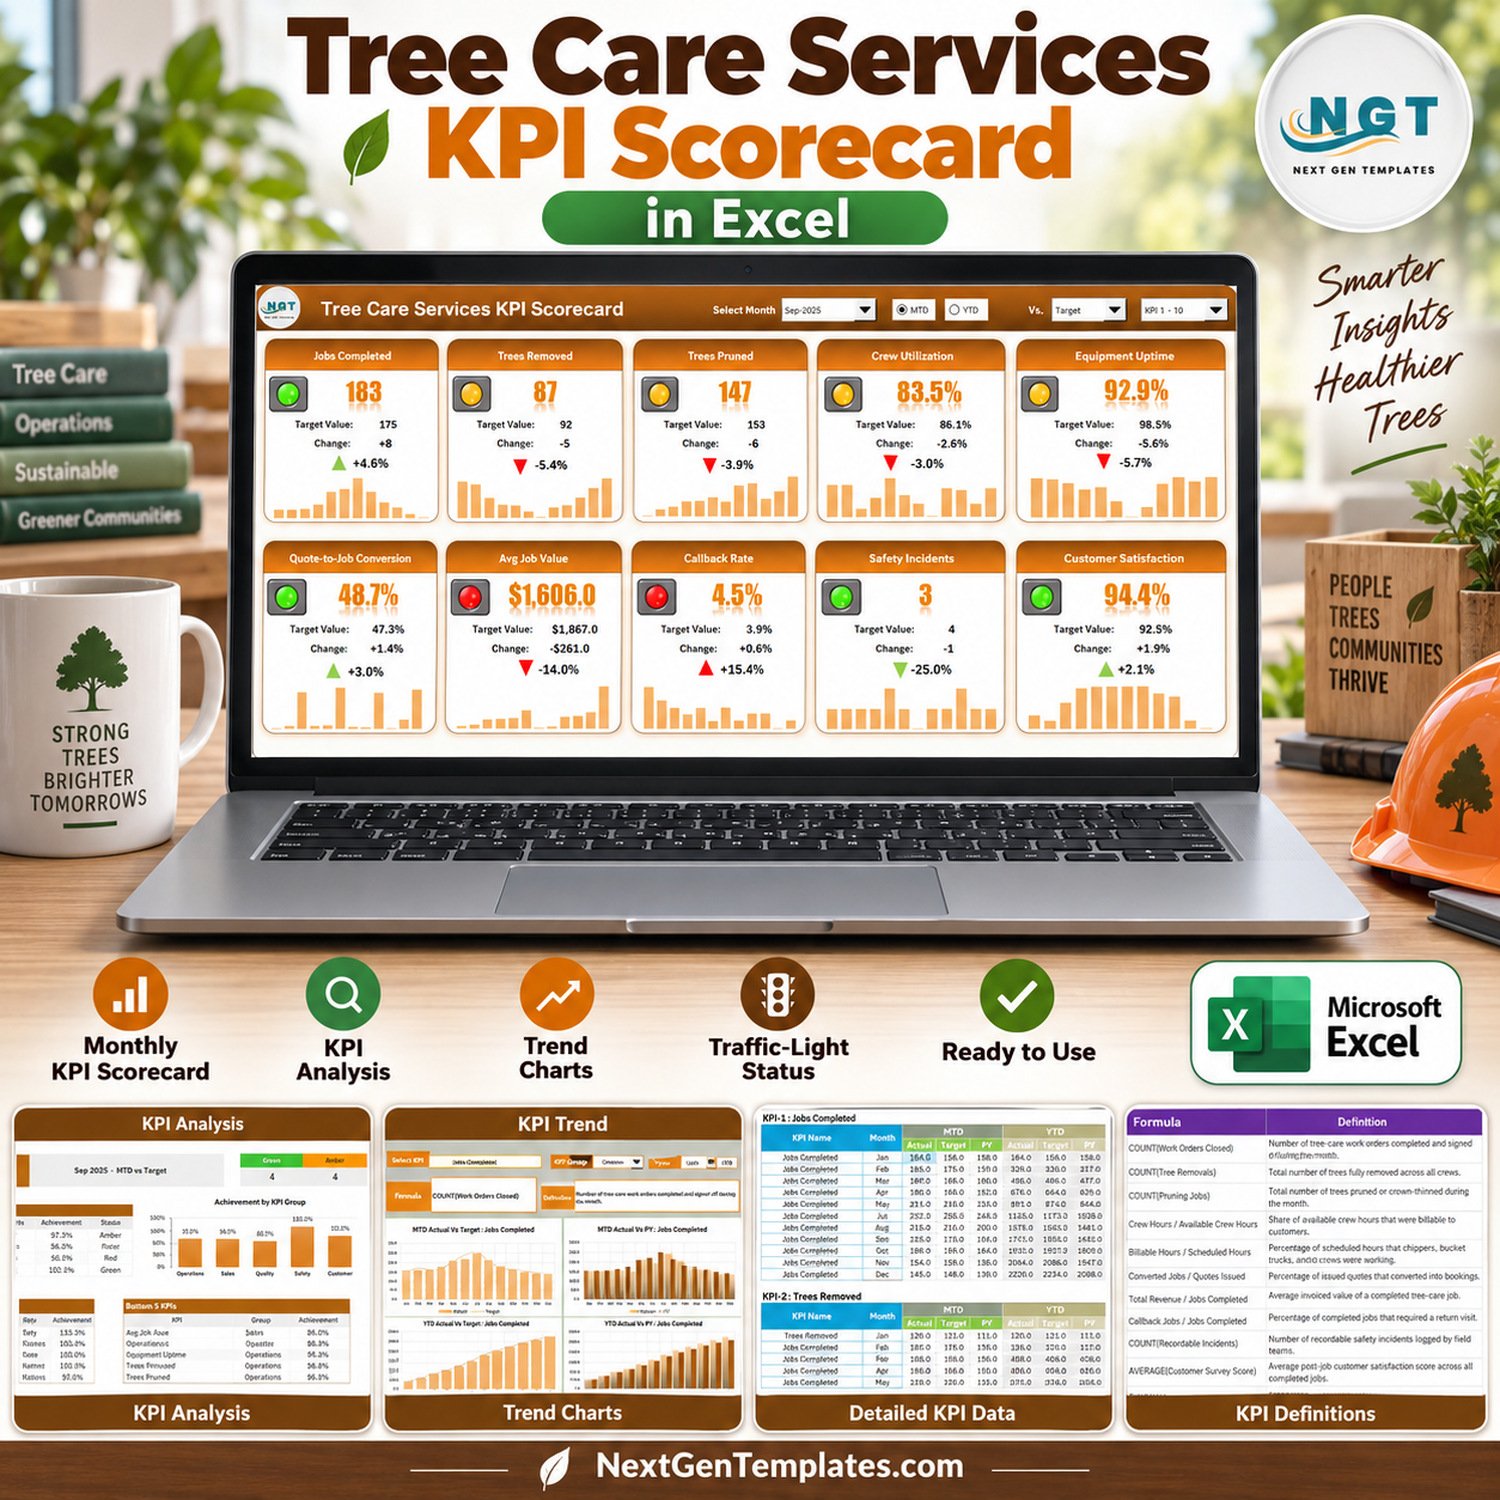
The Tree Care Services KPI Scorecard in Excel is a monthly review workbook for arborist and tree service businesses. It puts 10 tree-care KPIs on one tile wall: Jobs Completed, Trees Removed, Trees Pruned, Crew Utilization, Equipment Uptime, Quote-to-Job Conversion, Avg Job Value, Callback Rate, Safety Incidents and Customer Satisfaction. The file has 9 visible sheets, room for 20 KPIs and a full 2025 sample year. In the September 2025 sample, 4 KPIs read green, 4 amber and 2 red, so you can see how the traffic lights behave before you type a single number. Built by PK, a Microsoft Certified Professional with 15+ years of spreadsheet experience. One-time download, no subscription, no macros.
This listing is the KPI scorecard edition: ten cards on one page, a KPI Analysis page and a single-KPI trend page. It is a separate product from the Tree Care Services KPI Dashboard in Excel, which comes from our KPI dashboard family and carries 15 KPIs over 10 pages. Choose this scorecard when a short monthly card view is what your review meeting needs.
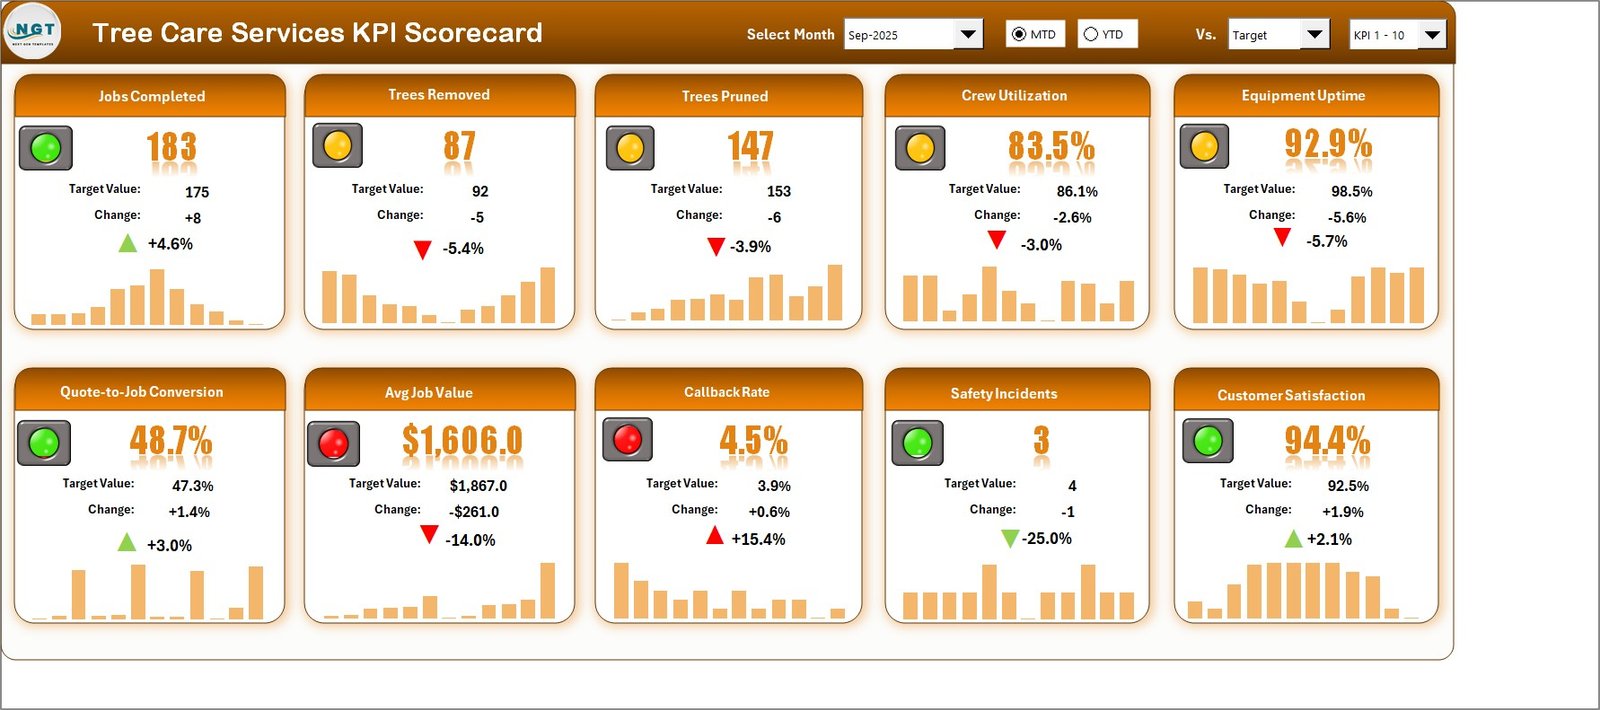
Scorecard sheet – September 2025 sample, MTD vs Target
Key Features of Tree Care Services KPI Scorecard in Excel
- Ten tree-care KPIs in five groups: Operations (5), Sales (2), Quality (1), Safety (1) and Customer (1).
- Scorecard tile wall: every card shows the actual value, the comparison value, the change, the percentage change with an arrow, a traffic light and a 12-month sparkline.
- Four header controls: Select Month, MTD or YTD, Vs. Target / PY / Prior Month, and a KPI set picker for KPI 1-10 or KPI 11-20.
- Direction-aware status: 8 KPIs are upper-the-better and 2 are lower-the-better (Callback Rate and Safety Incidents), so fewer incidents turn green, not red.
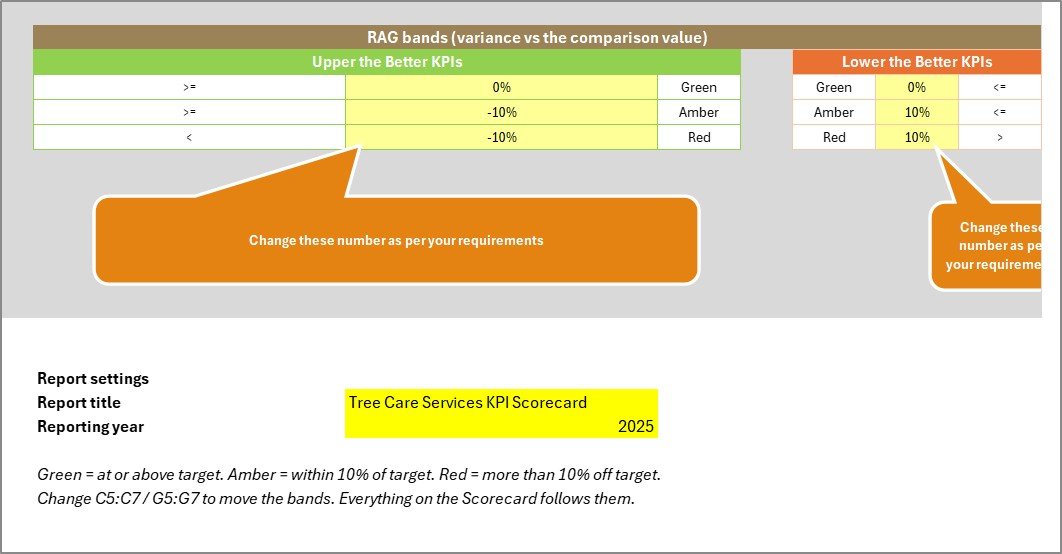
- Editable RAG bands: Color Settings holds the green, amber and red thresholds for both directions, and the status formulas read them directly.
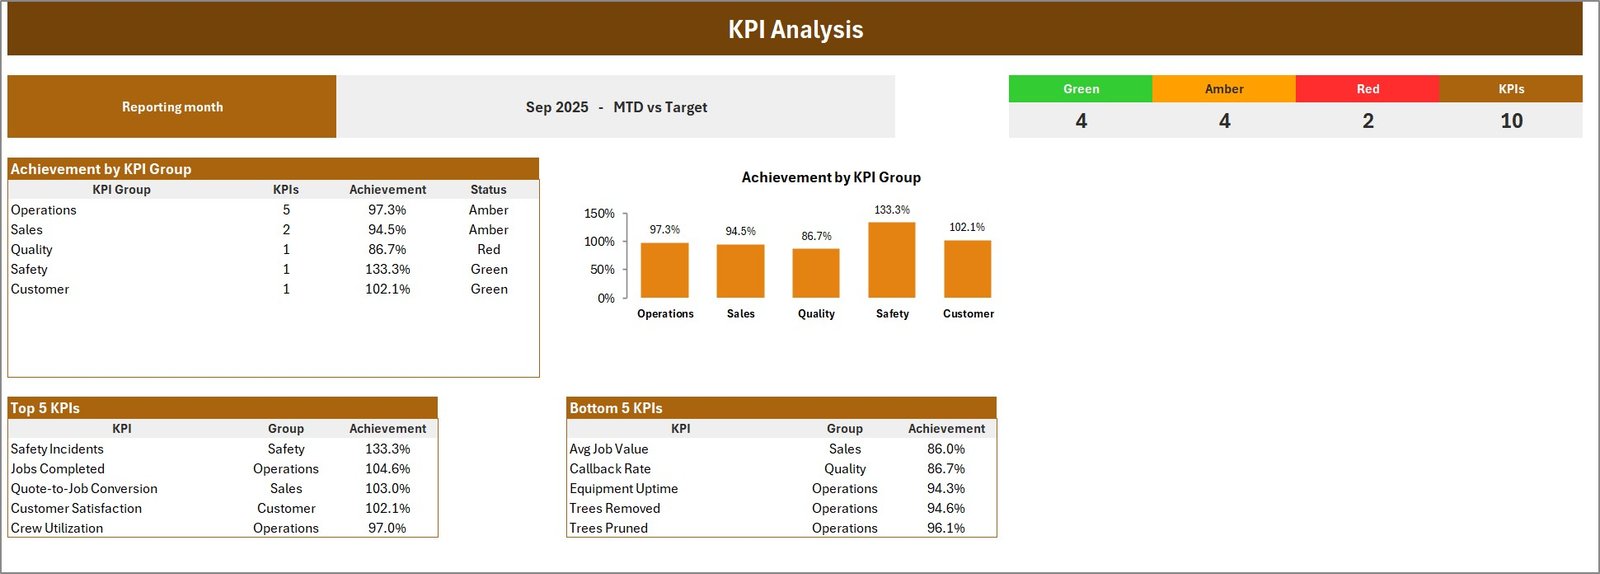
- KPI Analysis page: green, amber and red counts, achievement by KPI group with a chart, plus Top 5 and Bottom 5 KPI tables.
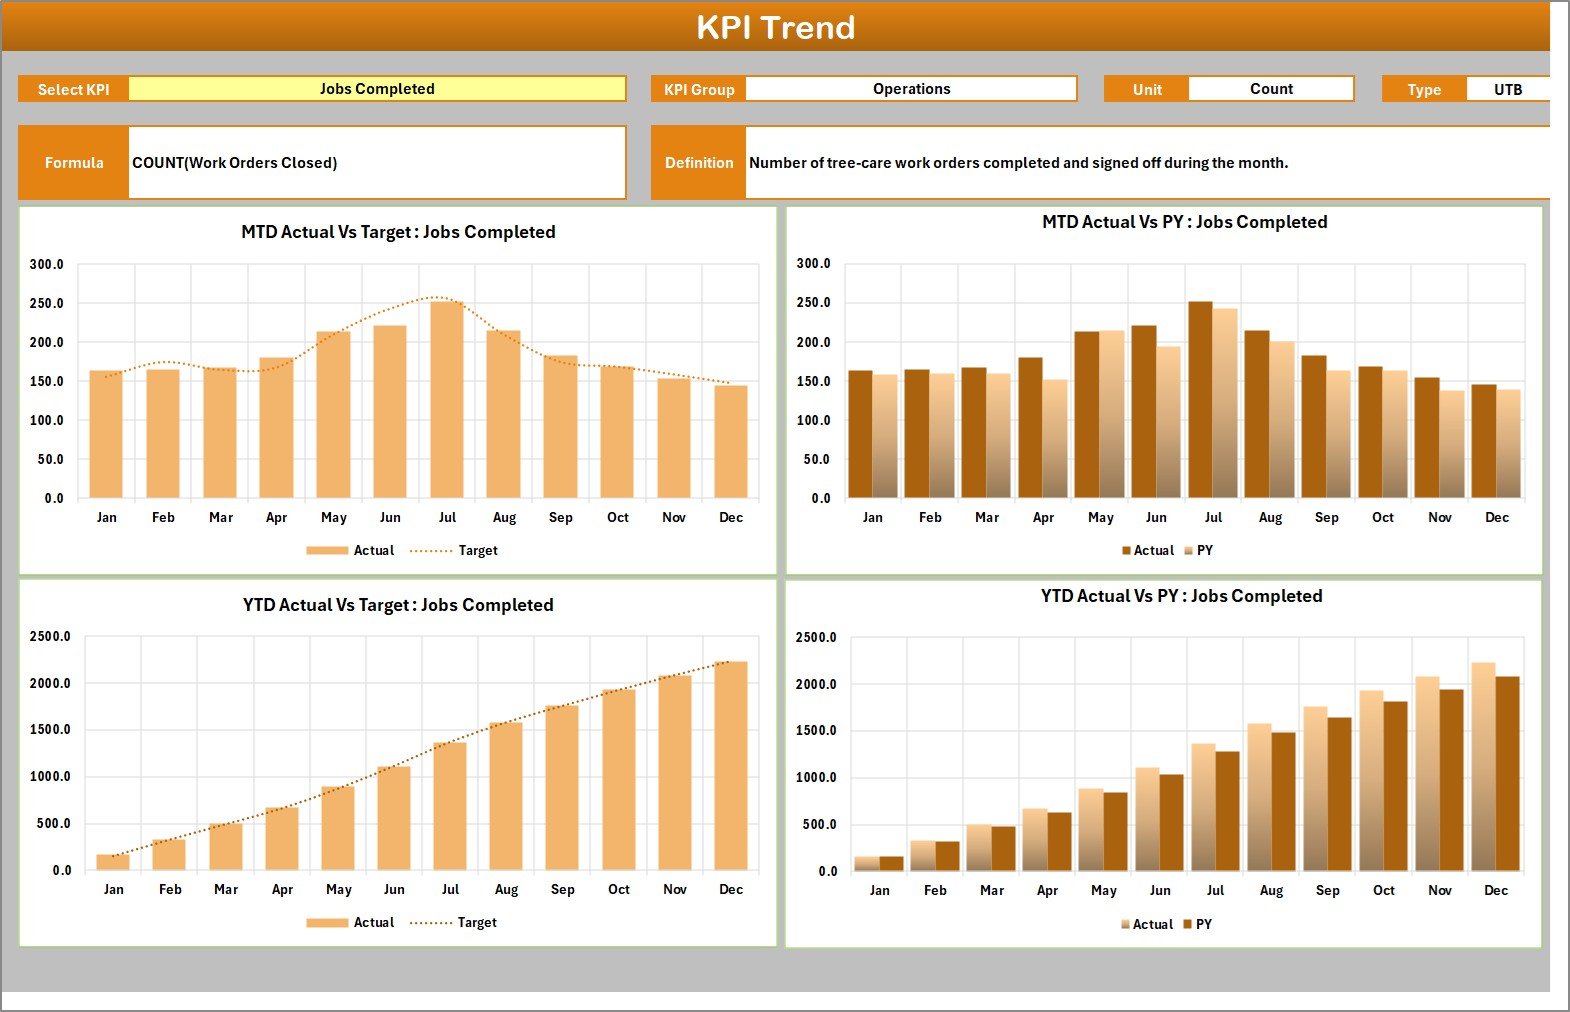
- KPI Trend page: pick one KPI and see MTD and YTD actuals against target and against last year in four charts.
- Formulas only: conditional formatting, camera pictures, form controls and sparklines. Nothing to enable.
What’s Inside the Workbook
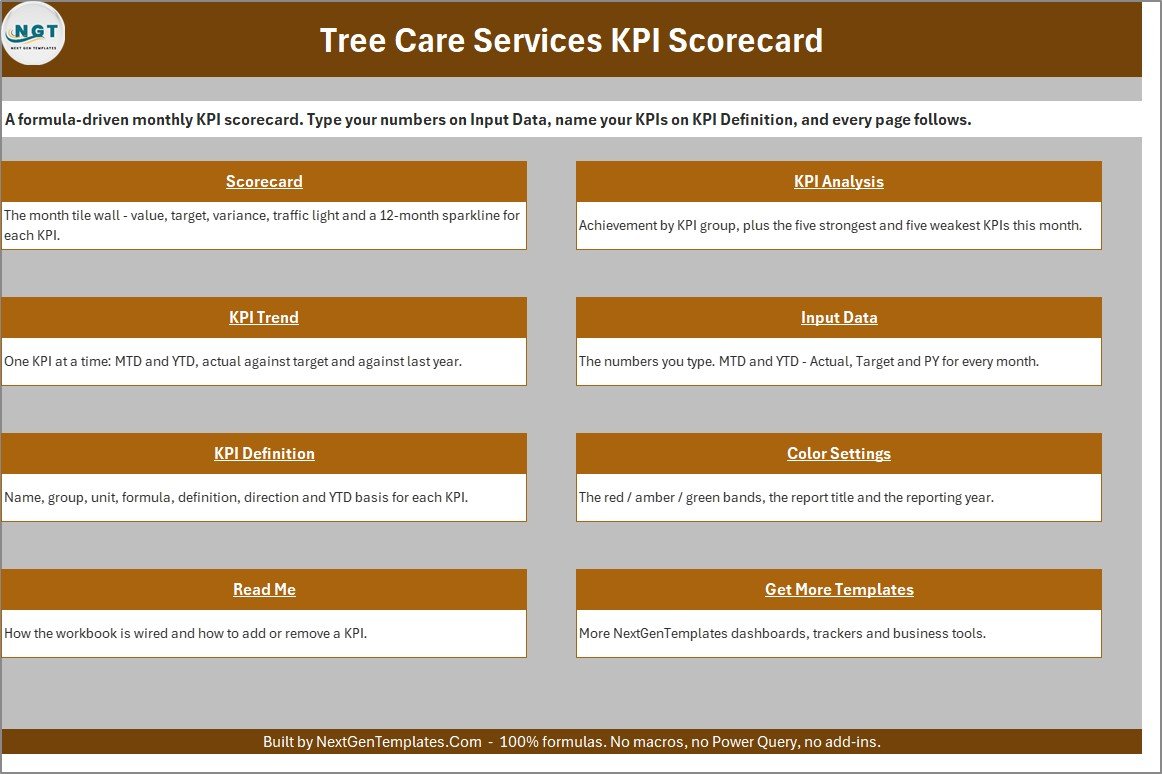
Home introduces the file and links to all eight other sheets. Scorecard is the main review wall. In the sample month, Jobs Completed reads 183 against a target of 175 (+4.6%), Crew Utilization 83.5% against 86.1%, Equipment Uptime 92.9% against 98.5%, Avg Job Value $1,606 against $1,867 (-14.0%) and Safety Incidents 3 against a target of 4.
Home sheet
KPI Analysis summarises the selected month. The sample shows Safety leading at 133.3% achievement, Customer at 102.1%, Operations at 97.3%, Sales at 94.5% and Quality trailing at 86.7%. Avg Job Value and Callback Rate sit at the bottom of the Bottom 5 table.
KPI Analysis sheet
KPI Trend shows one KPI at a time with its group, unit, formula, definition and type above four charts. The sample opens on Jobs Completed, which peaks at 252 jobs in July.
KPI Trend sheet
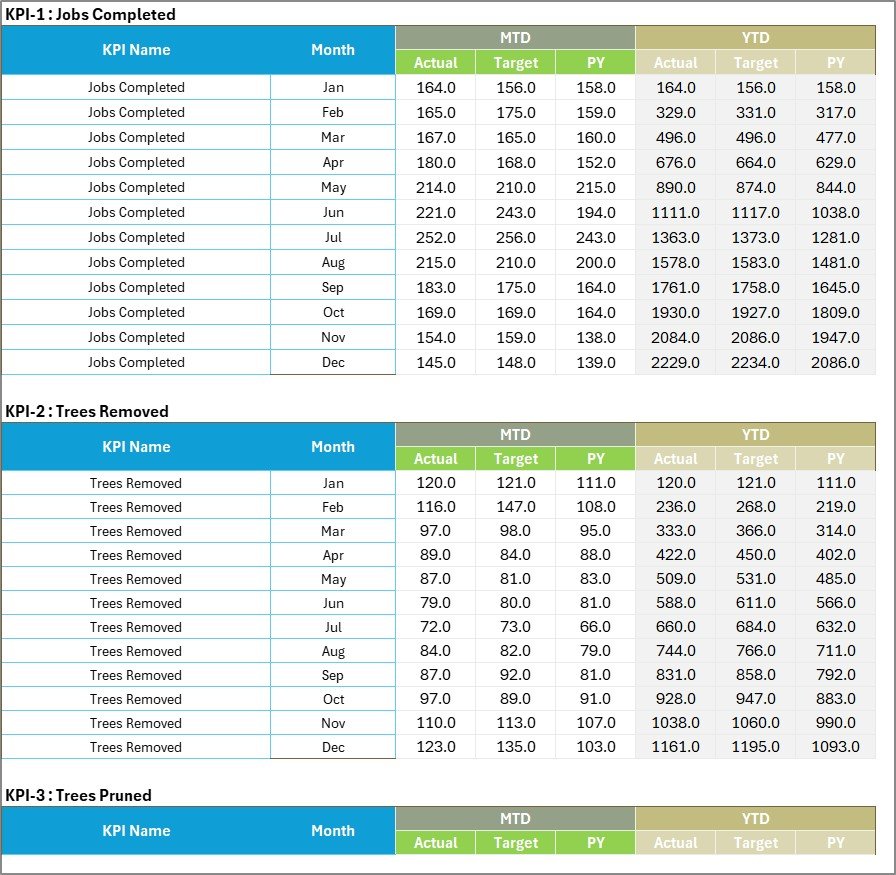
Input Data holds a 12-month block per KPI where you type MTD Actual, Target and PY plus YTD Actual, Target and PY. KPI Definition stores group, name, unit, formula, definition, UTB/LTB type and YTD basis, and its Check column warns you about duplicate KPI names.
Input Data sheet

KPI Definition sheet
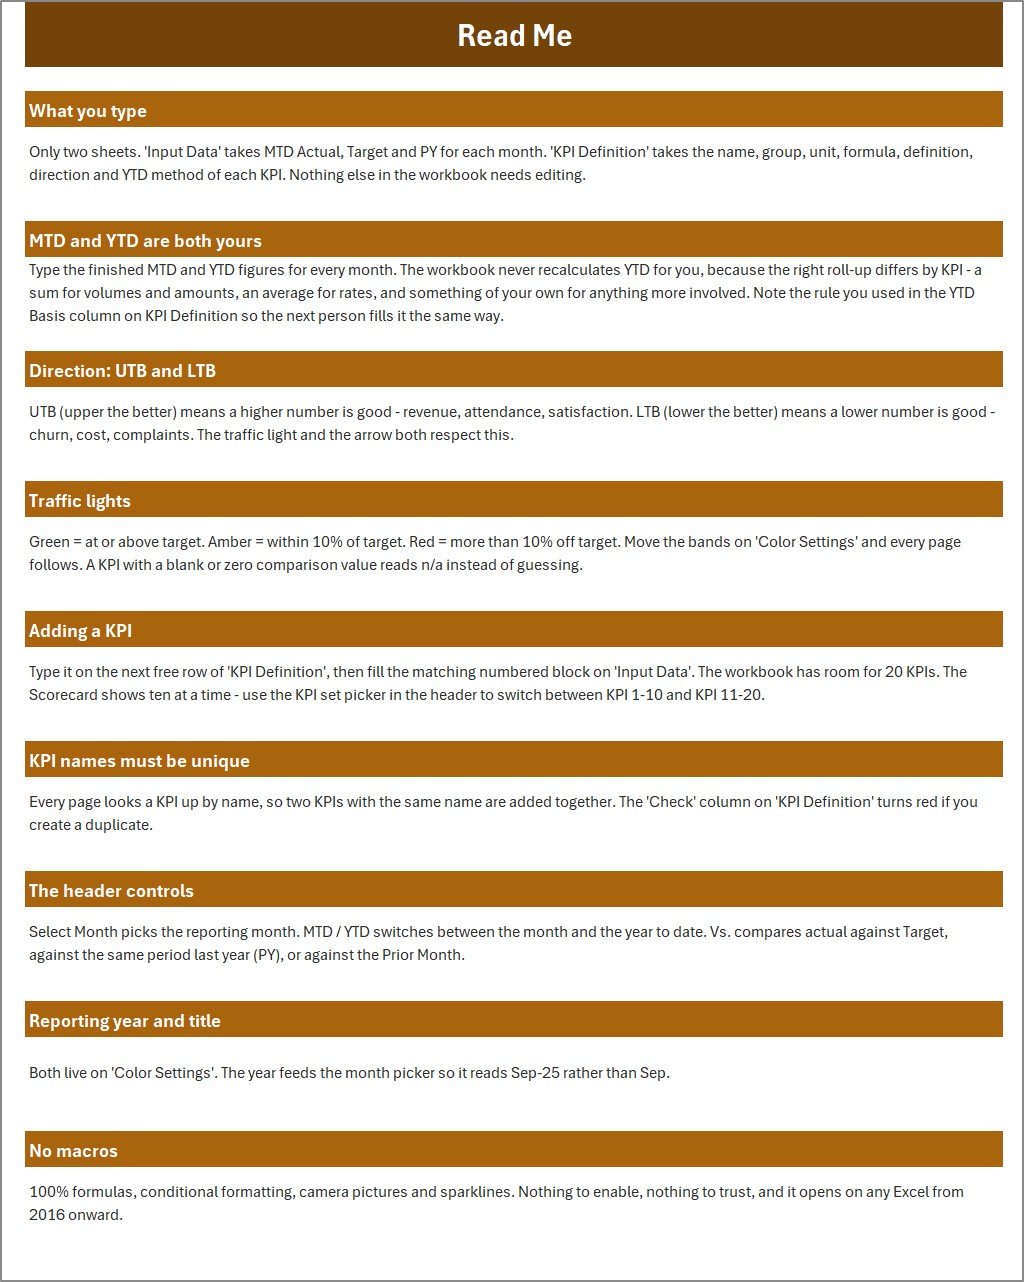
Color Settings sets the bands (default: green at or better than target, amber within 10%, red beyond 10%), the report title and the reporting year. Read Me explains what to type, how MTD and YTD work, how the lights are scored and how to add a KPI. Get More Templates lists related NextGenTemplates product lines.
Color Settings sheet
Excel Scorecard vs. Google Sheets vs. Field Service Software – Where This Fits
| Area | This Excel scorecard | Google Sheets build | Field service SaaS |
|---|---|---|---|
| Cost | $9.99 sale price, one-time | Free app, your build time | Monthly subscription per user |
| Setup time | Minutes after download | Formulas, charts and rules built by hand | Account setup and data migration |
| Tree-care KPIs | 10 prefilled, 20 slots | Whatever you design | Limited to vendor reports |
| Traffic lights and sparklines | Built in for UTB and LTB KPIs | Manual conditional formatting | Plan-dependent |
| Live co-editing | Share the file | Yes | Yes, with user roles |
| Scheduling, quotes, invoices | Not included | Not included unless built | Usually included |
| Best use | Monthly owner or manager review | Collaborative custom tracking | Daily crew and job operations |
Who This Template Is For – and Who It’s Not For
It suits owners, operations managers and office managers at tree removal, pruning and arborist companies, and landscaping firms with tree crews, who already collect job counts, quotes, crew hours, callbacks, incidents and survey scores and want one monthly view of them.
It is not a CRM, dispatch board, quoting or invoicing tool, crew timesheet or equipment maintenance system. It is not a safety program either: Safety Incidents is a number you type, and the workbook does not record incidents, check training or certification, or assess compliance with any safety standard. Tree work is hazardous, and your safety processes stay where they are.
How to Use the Scorecard
- Unzip the download and open the workbook in desktop Excel 2016 or later.
- On Color Settings, set the report title, the reporting year and the RAG bands.
- On KPI Definition, rename or adjust the KPIs, units, formulas, direction and YTD basis.
- On Input Data, type MTD and YTD actual, target and prior-year values for each month.
- Pick the month in the Scorecard header, then use KPI Analysis and KPI Trend for the discussion.
Honest Limits
- YTD figures are typed, not calculated, because volumes roll up as sums while rates need an average or your own rule.
- One reporting year per file: the month picker lists the 12 months of the year set on Color Settings.
- Monthly totals only – there is no job, crew, customer or service-type drill-down.
- RAG bands are set once per direction, not per KPI, and a blank or zero comparison value reads n/a, so a zero-incident target cannot be scored.
- The header dropdowns and option buttons are desktop Excel form controls and are not designed for Excel for the web.
Real-World Use Cases
Month-end owner review: Avg Job Value is red at $1,606 against $1,867, so the owner opens KPI Trend to check whether small pruning jobs crowded out larger removals.
Crew capacity check: Crew Utilization and Equipment Uptime are both amber, which points the operations manager at chipper and bucket-truck downtime before hiring another crew.
Quality follow-up: Callback Rate is red at 4.5% against 3.9%, so the office manager reviews which jobs needed a return visit.
Frequently Asked Questions
What does the download include?
A ZIP with the Excel workbook (.xlsx) and a PDF user manual.
Does it need macros?
No. It is built with formulas, conditional formatting, camera pictures, form controls and sparklines.
Can I change or add KPIs?
Yes. Edit names, groups, units, formulas and definitions on KPI Definition and fill the matching block on Input Data. There is room for 20 KPIs, shown ten at a time.
How is the scorecard different from the Tree Care Services KPI Dashboard?
They are separate templates. This scorecard has 10 KPIs on a card wall across 9 sheets; the dashboard edition comes from the KPI dashboard family with 15 KPIs across 10 pages.
How should I enter Customer Satisfaction?
The sample stores it as a percentage, so convert your survey scale (for example a 1-5 score) to a percentage before typing it.
Does it work in Excel for the web or on a Mac?
It is designed and tested for desktop Excel on Windows. The form-control dropdowns are not supported in Excel for the web.
About the Author
Built by PK – Microsoft Certified Professional with 15+ years of Excel, Google Sheets, and Power BI experience. Founder of NextGenTemplates, reaching 300K+ subscribers across YouTube channels. Every template is hand-built and tested before release. New to Excel formulas? Microsoft’s overview of formulas in Excel is a good primer.
Explore Related Templates
- Landscaping Dashboard in Excel
- Swimming Pool Service KPI Scorecard in Excel
- Plumbing Business KPI Scorecard in Excel
- Landscaping Dashboard in Google Sheets
- KPI Dashboard Library (Excel)
Download the Tree Care Services KPI Scorecard in Excel and run your next month-end tree-care review from one clear page.
Last updated: September 2026
📖 Read the complete walkthrough of the Tree Care Services KPI Scorecard in Excel on our blog: Tree Care Services KPI Scorecard in Excel – full guide.




























Reviews
There are no reviews yet.