



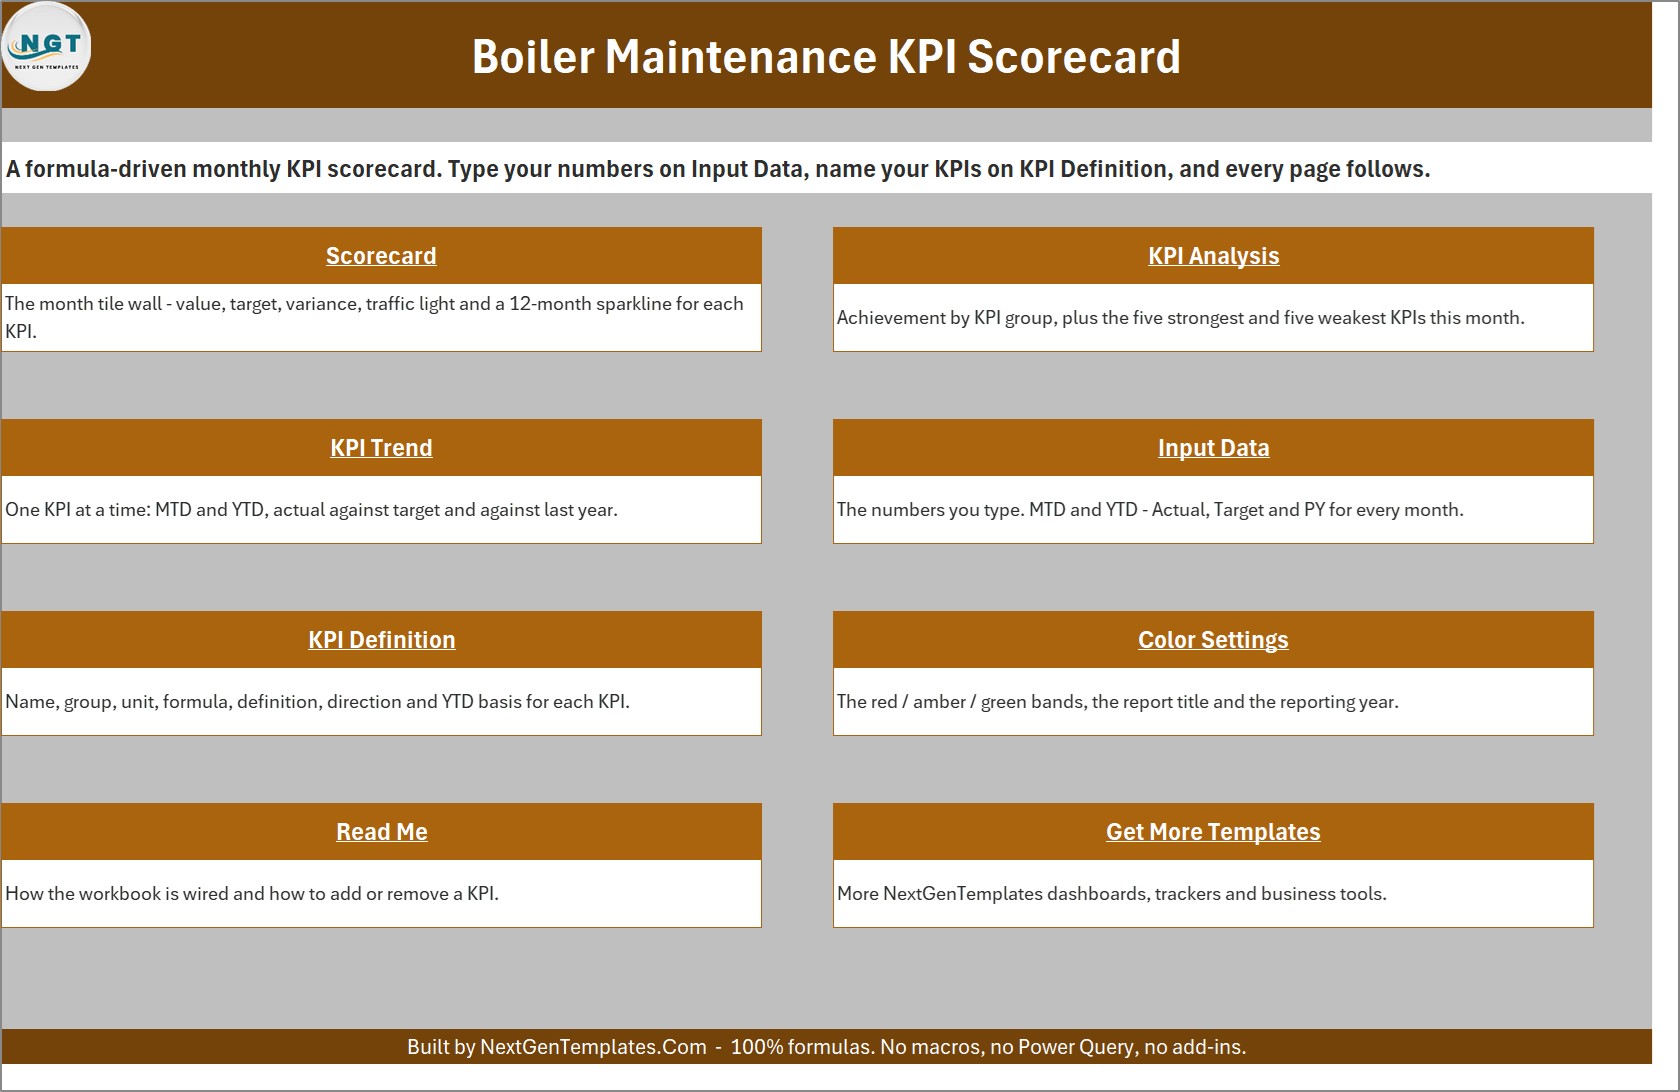
The Boiler Maintenance KPI Scorecard in Excel gives maintenance and service teams a repeatable monthly review for up to 20 KPIs without a subscription. Enter MTD and YTD actual, target and previous-year values; the workbook updates traffic lights, variance, sparklines, KPI-group analysis and trend charts through standard Excel formulas. Ten boiler-service KPIs are prefilled, including average response time, first-time fix rate, boiler uptime, gas safety compliance, callbacks, service revenue and parts cost. There are no macros, no Power Query and no add-ins. The ZIP includes the editable .xlsx workbook and a PDF user manual, backed by a 30-day refund policy.
This is the KPI scorecard edition. It is different from the separate Boiler Maintenance KPI Dashboard in Excel draft, which uses a dashboard-oriented layout. This scorecard focuses on traffic-light KPI cards, a scorecard wall, KPI analysis and selected-KPI trends.
Key Features of the Boiler Maintenance KPI Scorecard in Excel
- Up to 20 KPIs: the scorecard shows KPI 1-10 or KPI 11-20 through the header selector.
- MTD and YTD views: switch between month-to-date and year-to-date values.
- Three comparison choices: compare actual against target, previous year or prior month.
- Direction-aware status: UTB and LTB settings handle higher-is-better and lower-is-better measures correctly.
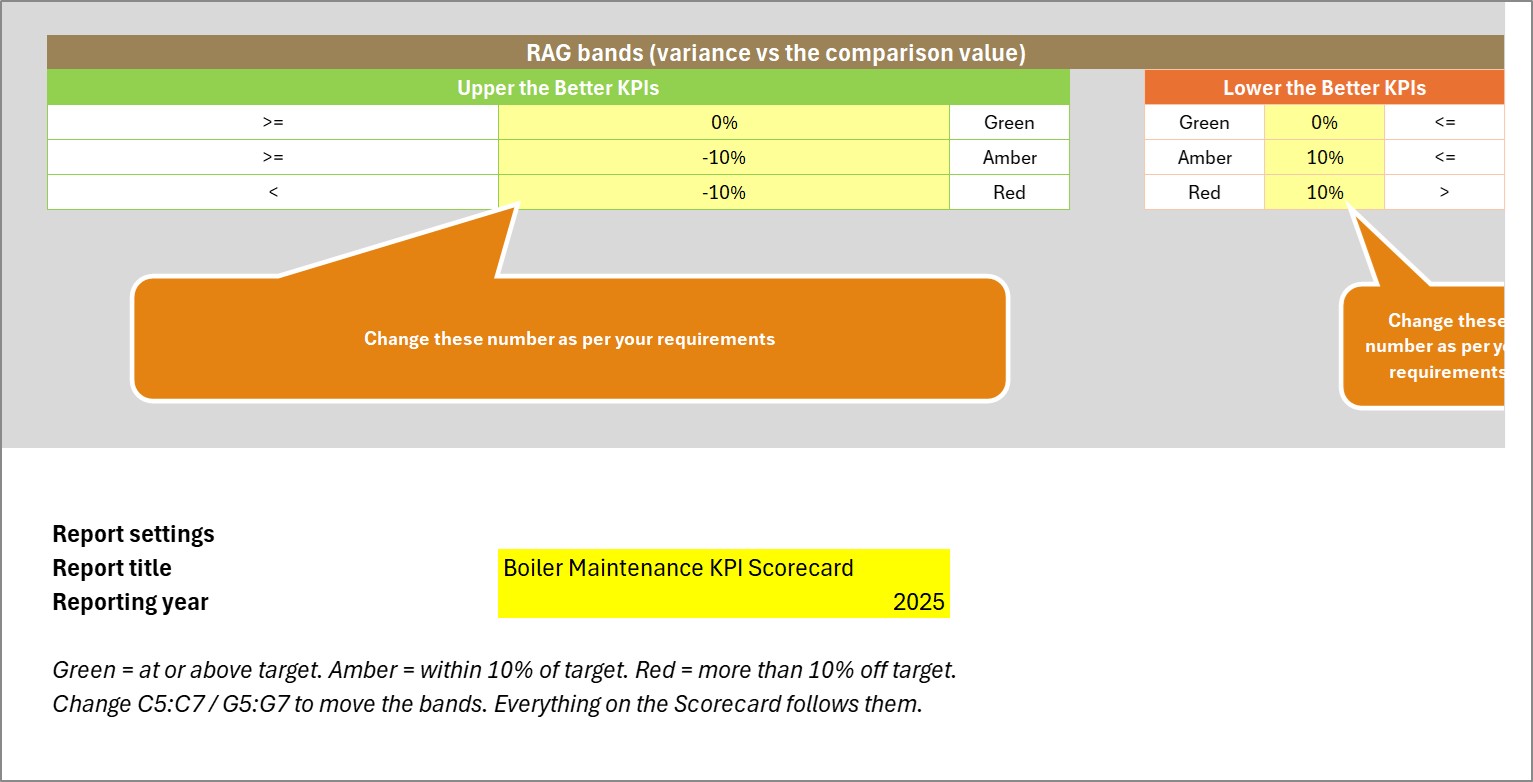
- Editable RAG bands: change green, amber and red thresholds on the Color Settings sheet.
- KPI-group analysis: review achievement by group plus the five strongest and five weakest KPIs.
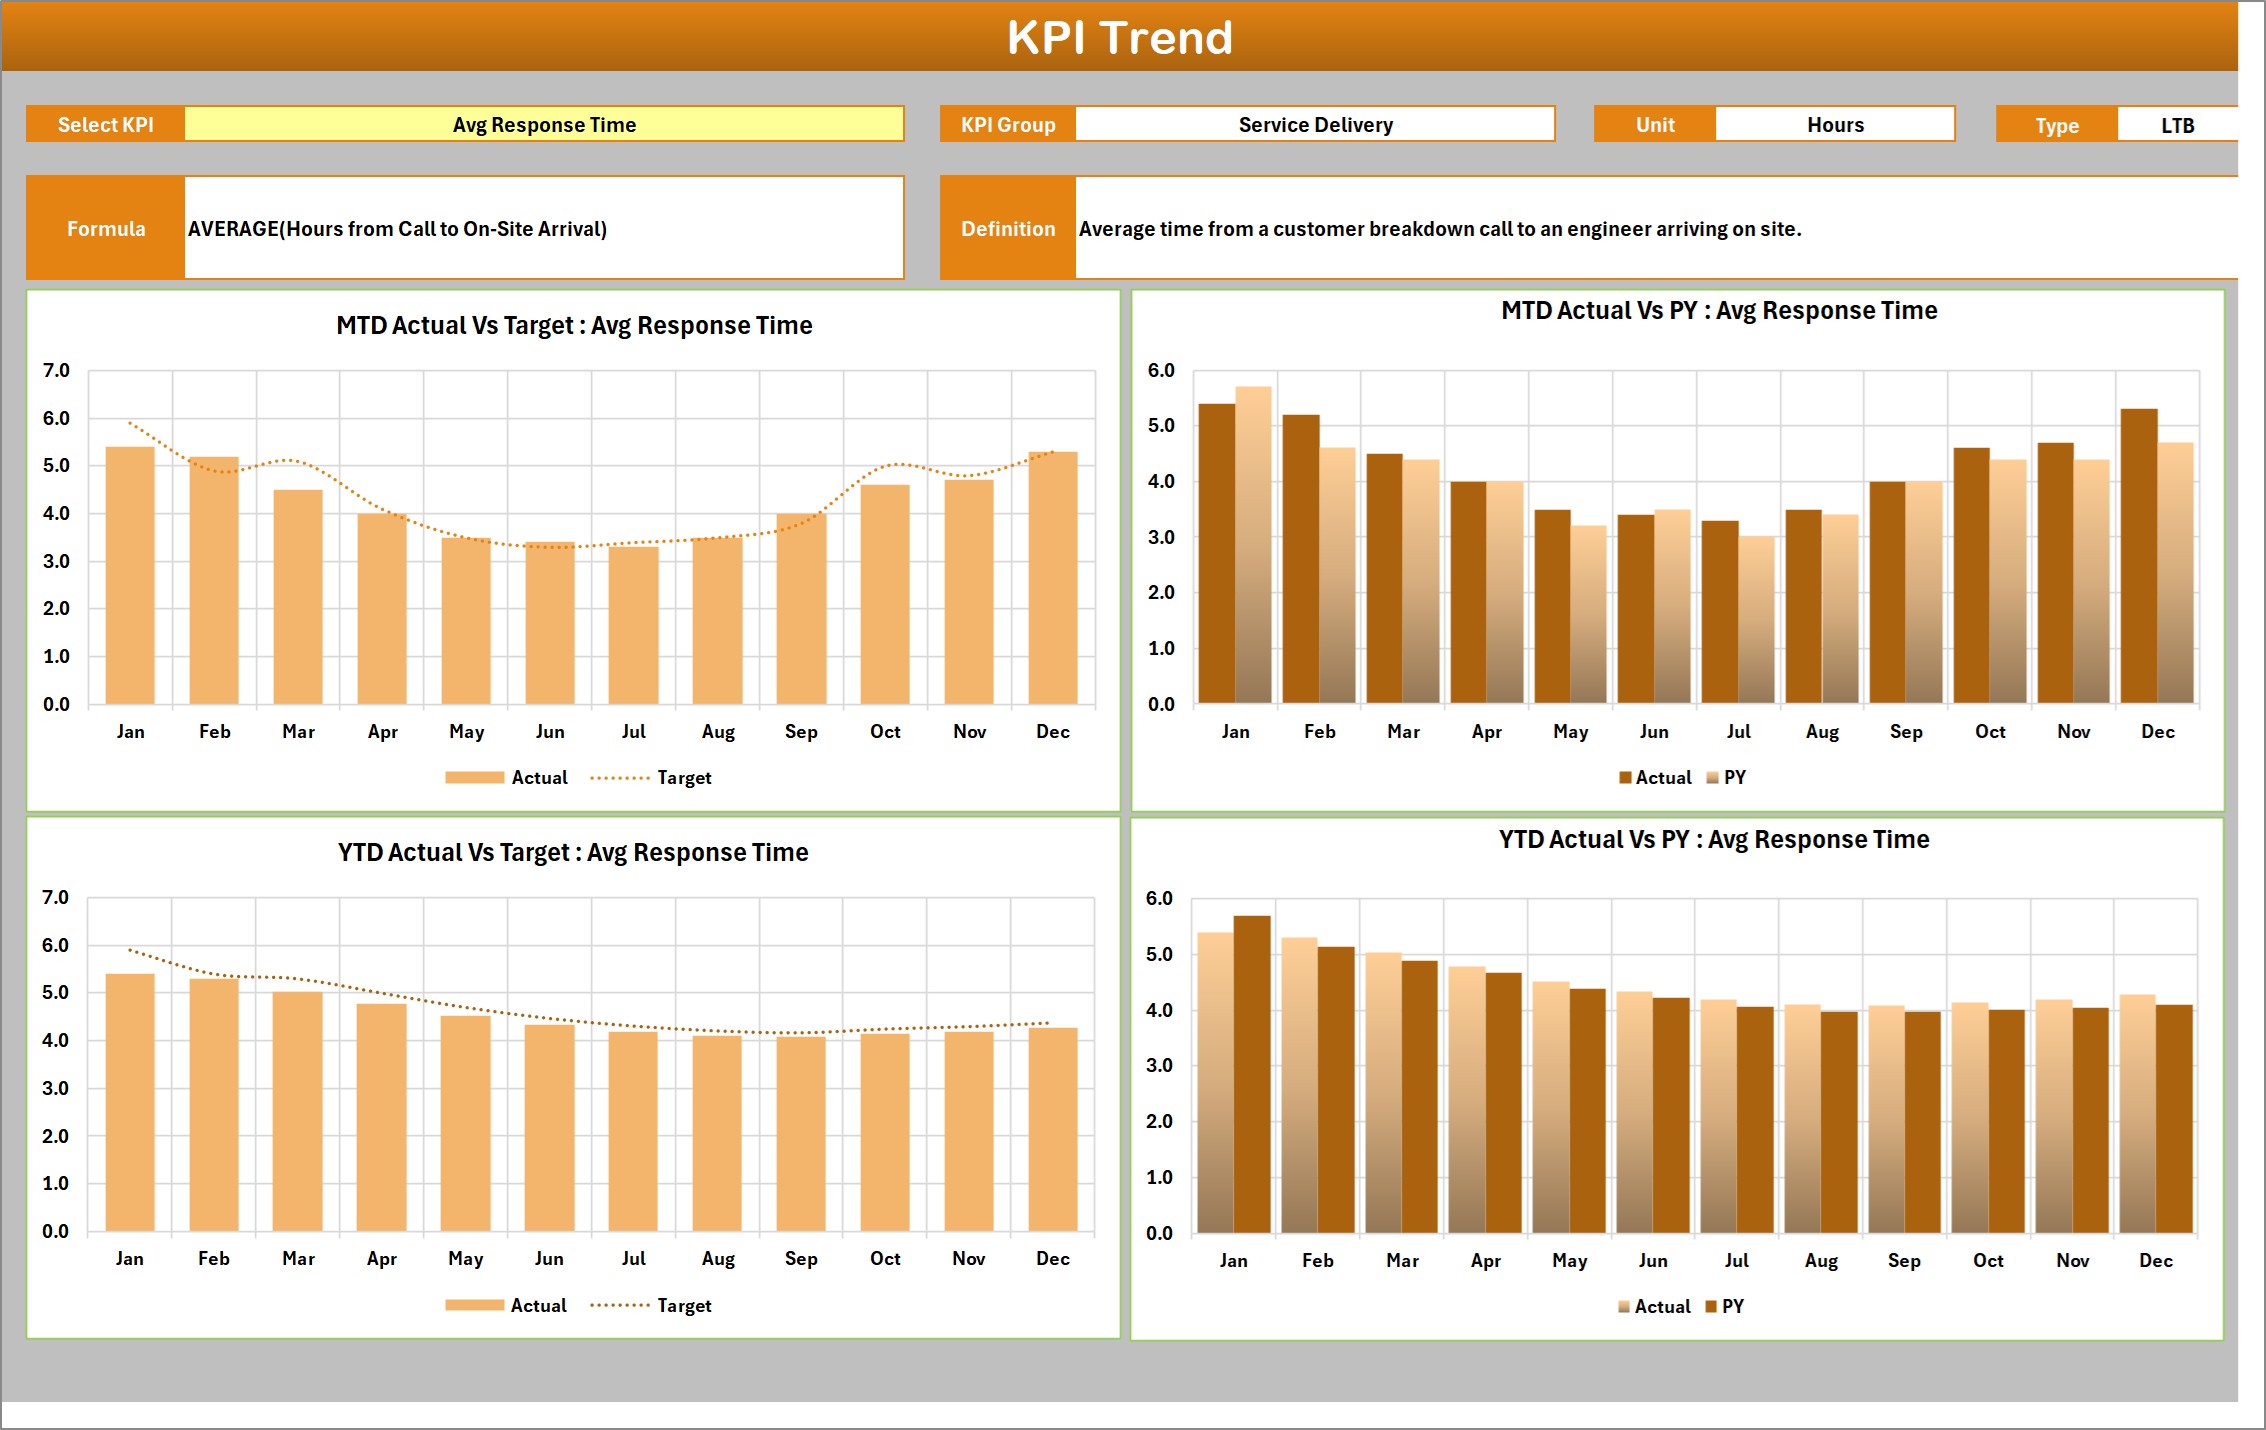
- Selected-KPI trends: four charts compare MTD and YTD actual with target and previous year across 12 months.
- Duplicate-name check: the KPI Definition sheet flags repeated KPI names before they distort lookups.
- Formula-only .xlsx: nothing needs enabling and the workbook is designed for Excel 2016 onward.
What’s Inside the Boiler Maintenance KPI Scorecard in Excel
The workbook contains 11 sheets. The nine user-facing pages are Home, Scorecard, KPI Analysis, KPI Trend, Input Data, KPI Definition, Color Settings, Read Me and Get More Templates; two support sheets power the calculations.
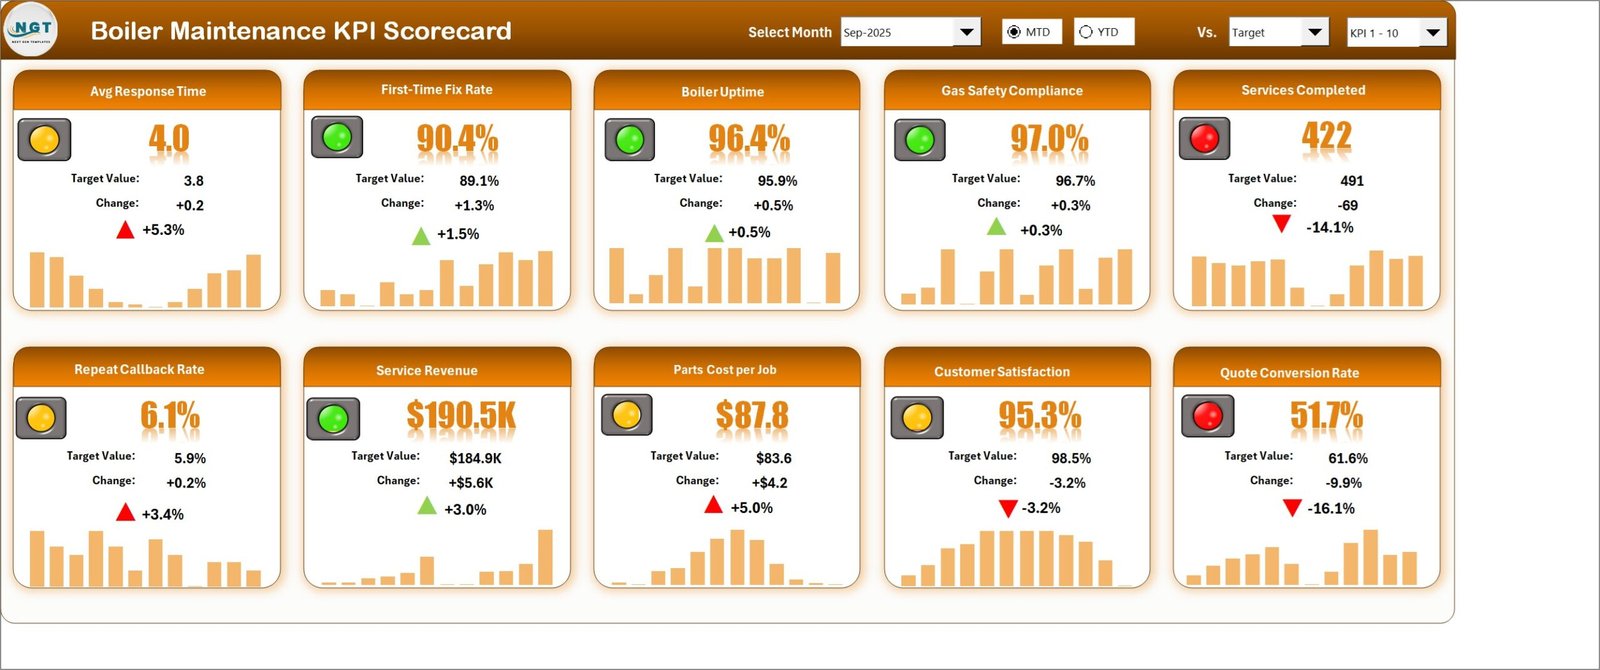
- Scorecard: ten KPI cards at a time, each with value, comparison, change, traffic light and 12-month sparkline.
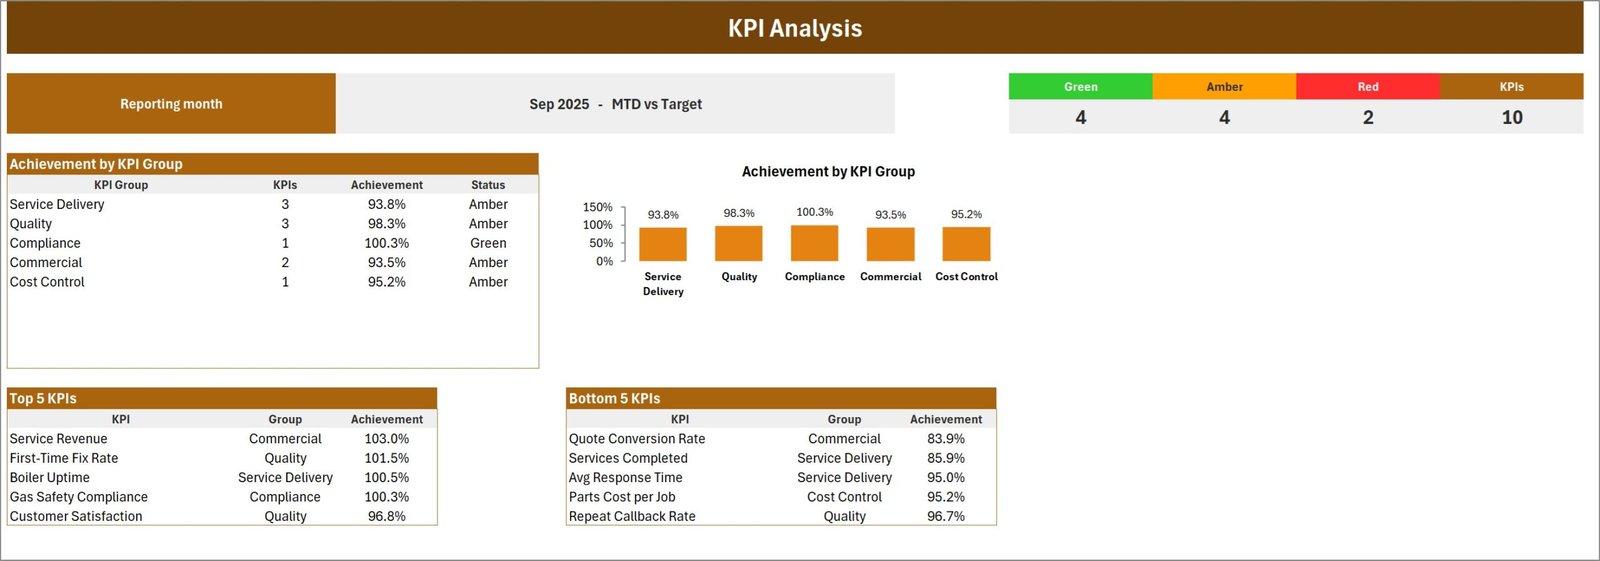
- KPI Analysis: reporting-month totals for green, amber and red status, achievement by group, and top/bottom-five rankings.
- KPI Trend: KPI name, group, unit, formula, definition and four monthly charts for the selected measure.
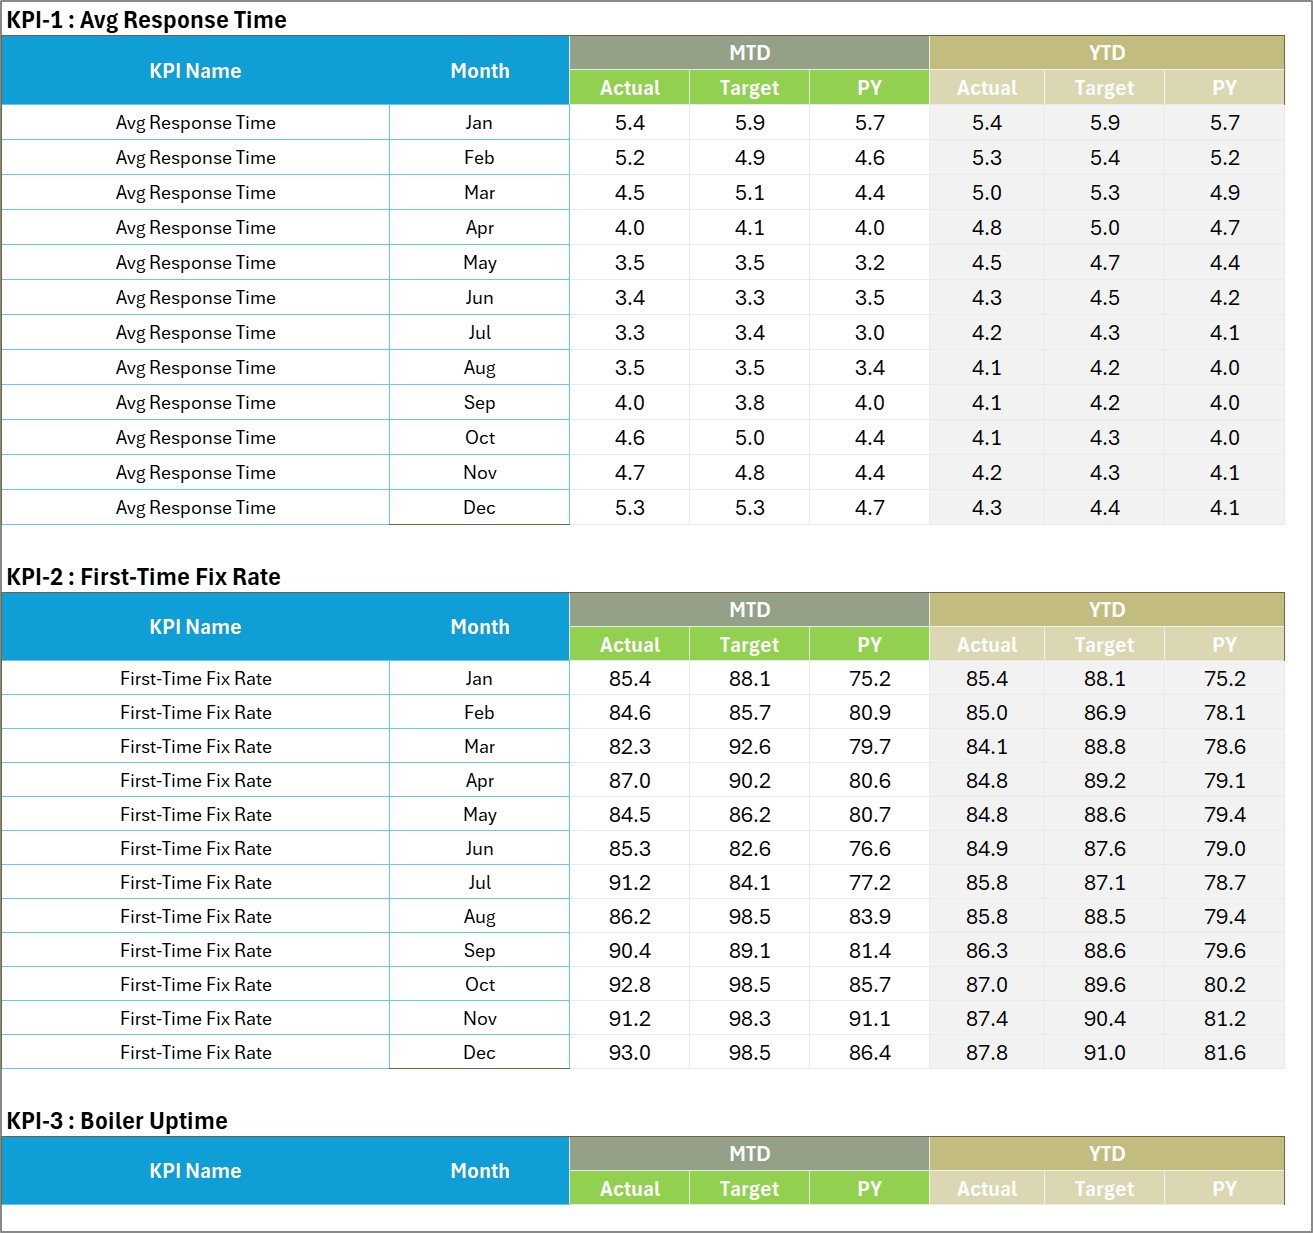
- Input Data: monthly MTD and YTD Actual, Target and PY figures for every KPI.
- KPI Definition: name, group, unit, formula, definition, UTB/LTB type, YTD basis and duplicate check.
- Color Settings: report title, reporting year and editable RAG thresholds.
The ten examples are Avg Response Time, First-Time Fix Rate, Boiler Uptime, Gas Safety Compliance, Services Completed, Repeat Callback Rate, Service Revenue, Parts Cost per Job, Customer Satisfaction and Quote Conversion Rate. They are editable reporting examples, not safety certifications or calculated compliance evidence.
Boiler Maintenance KPI Scorecard in Excel vs. Google Sheets vs. Paid Field-Service SaaS – Where This Fits
| Area | This Excel scorecard | Google Sheets alternative | Paid field-service SaaS |
|---|---|---|---|
| Cost | $15.99 regular / $9.99 sale, one-time | Usually one-time template cost | Recurring per-user subscription |
| Platform | Excel 2016 onward | Browser and Google account | Vendor web/mobile platform |
| Input | Final monthly KPI figures | Final monthly KPI figures | Often transaction-level workflows |
| Capacity | Up to 20 editable KPIs | Varies by template | Depends on plan |
| Offline use | Yes | No | Usually no |
| Work orders and dispatch | Not included | Not included | Often included |
| Best fit | Monthly KPI review and management reporting | Browser-first collaborative scorecards | End-to-end field-service operations |
Who This Template Is For – and Who It’s Not For
This boiler maintenance KPI template suits boiler service businesses, heating contractors, plant maintenance teams, facilities managers, operations leads and commercial managers who already know their monthly values. It is an Excel KPI scorecard for repeatable review meetings, not a raw-work-order database.
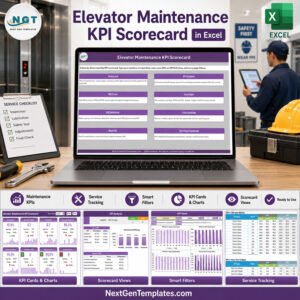
It is not a CMMS, job scheduler, asset register, invoice tool, live sensor feed or compliance-certification system. It does not calculate boiler KPIs from service tickets or certify gas safety. If you need transaction capture, see the Maintenance Work Order Data Entry System in Excel. For a published scorecard with similar maintenance logic, see the Elevator Maintenance KPI Scorecard in Excel.
How to Use the Boiler KPI Scorecard
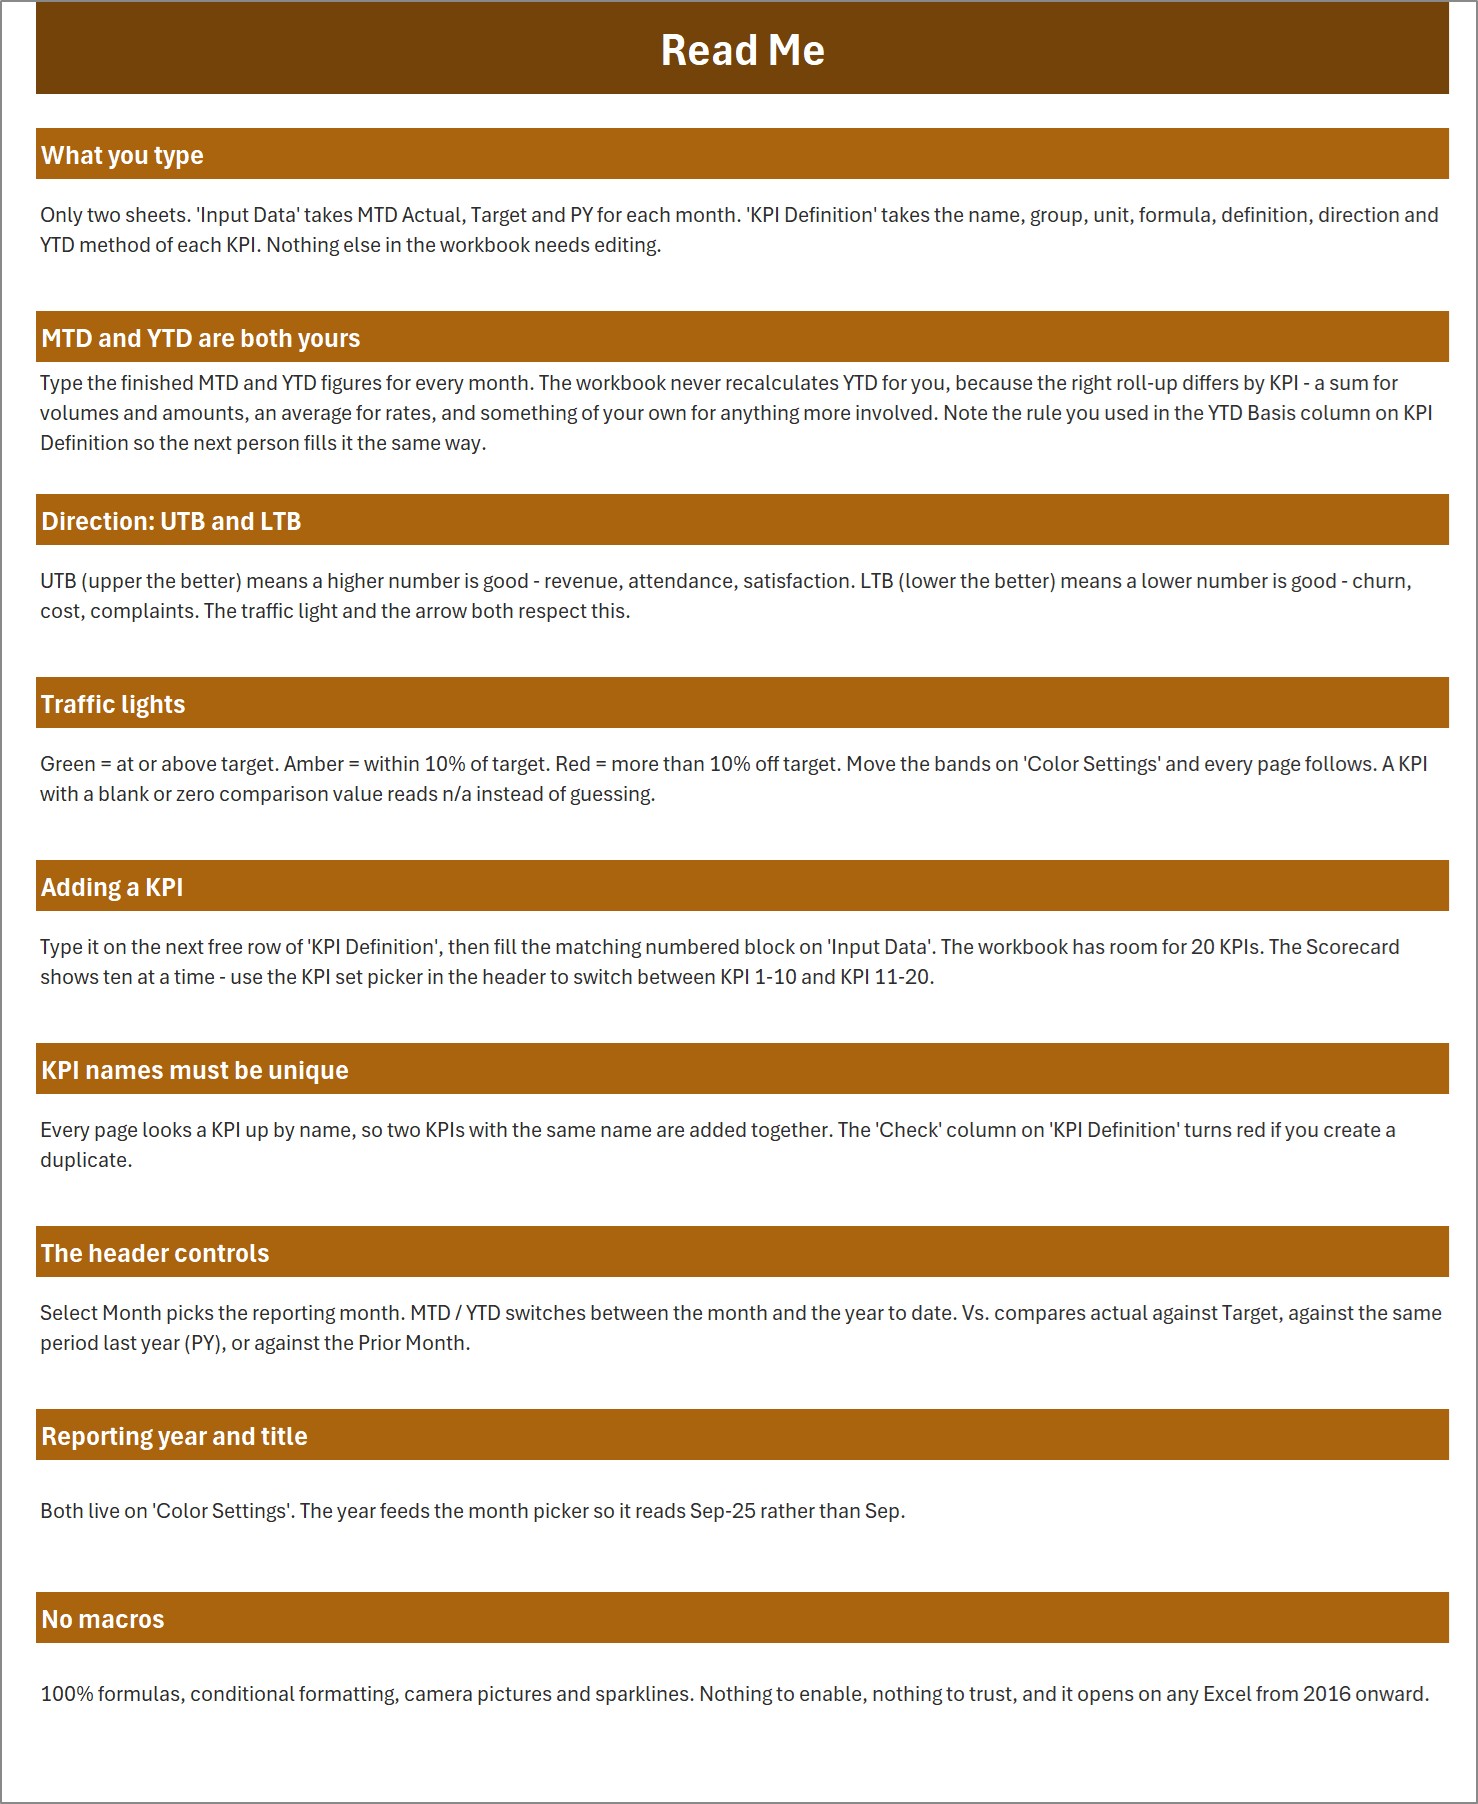
- Open the .xlsx and read the included Read Me and PDF manual.
- Set the report title, reporting year and RAG thresholds on Color Settings.
- Edit KPI Definition if your names, groups, units, formulas, directions or YTD bases differ.
- Enter finished MTD and YTD Actual, Target and PY values for each month on Input Data.
- Select the month, MTD/YTD view, comparison and KPI set on Scorecard.
- Use KPI Analysis for group-level performance and KPI Trend for monthly movement.
The workbook expects already-calculated monthly values. Its maintenance KPI tracking is visual and formula driven; it does not infer financial, operational or safety results. For background on the calculation environment, see Microsoft’s overview of formulas in Excel.
Real-World Use Cases
A boiler service manager can compare response time, first-time fix rate and callbacks before a monthly team meeting. A plant engineer can watch uptime, gas-safety compliance and service completion against target. A commercial lead can review service revenue, parts cost per job, satisfaction and quote conversion without mixing these final KPIs with work-order transactions.
Frequently Asked Questions
Does this workbook use macros?
No. It is a standard .xlsx built with formulas, conditional formatting, camera pictures and sparklines.
How many KPIs can I track?
Up to 20. The Scorecard selector switches between KPI 1-10 and KPI 11-20.
Does it calculate YTD automatically?
No. You enter finished MTD and YTD figures because YTD logic can be a sum, average or another business-specific roll-up.
Can I change the traffic-light thresholds?
Yes. Edit the UTB and LTB RAG bands on Color Settings; connected pages follow them.
Is this the same as the Boiler Maintenance KPI Dashboard?
No. The dashboard is a separate product. This is the scorecard edition with KPI cards, a 20-KPI selector, group analysis and selected-KPI trends.
Does it replace a CMMS or safety system?
No. It visualises values you provide and does not manage jobs, inspections, certificates or live boiler data.
About the Author
Built by PK – Microsoft Certified Professional with 15+ years of Excel, Google Sheets, and Power BI experience. Founder of NextGenTemplates, reaching 300K+ subscribers across YouTube channels. Every template is hand-built and tested before release.
Explore Related Templates
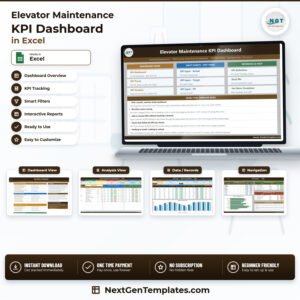
- Elevator Maintenance KPI Dashboard in Excel – a published dashboard alternative for maintenance reporting.
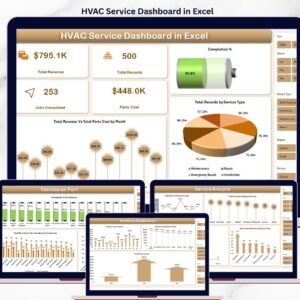
- HVAC Service Dashboard in Excel – analytical reporting for service activity.
- Fire Safety Services KPI Scorecard in Excel – another published operations scorecard.
- Browse the Excel KPI templates and MS Excel catalogue.
Download the boiler performance scorecard, replace the sample figures, and make every monthly review easier to read and repeat.
Last updated: 16 September 2026.


























Reviews
There are no reviews yet.