

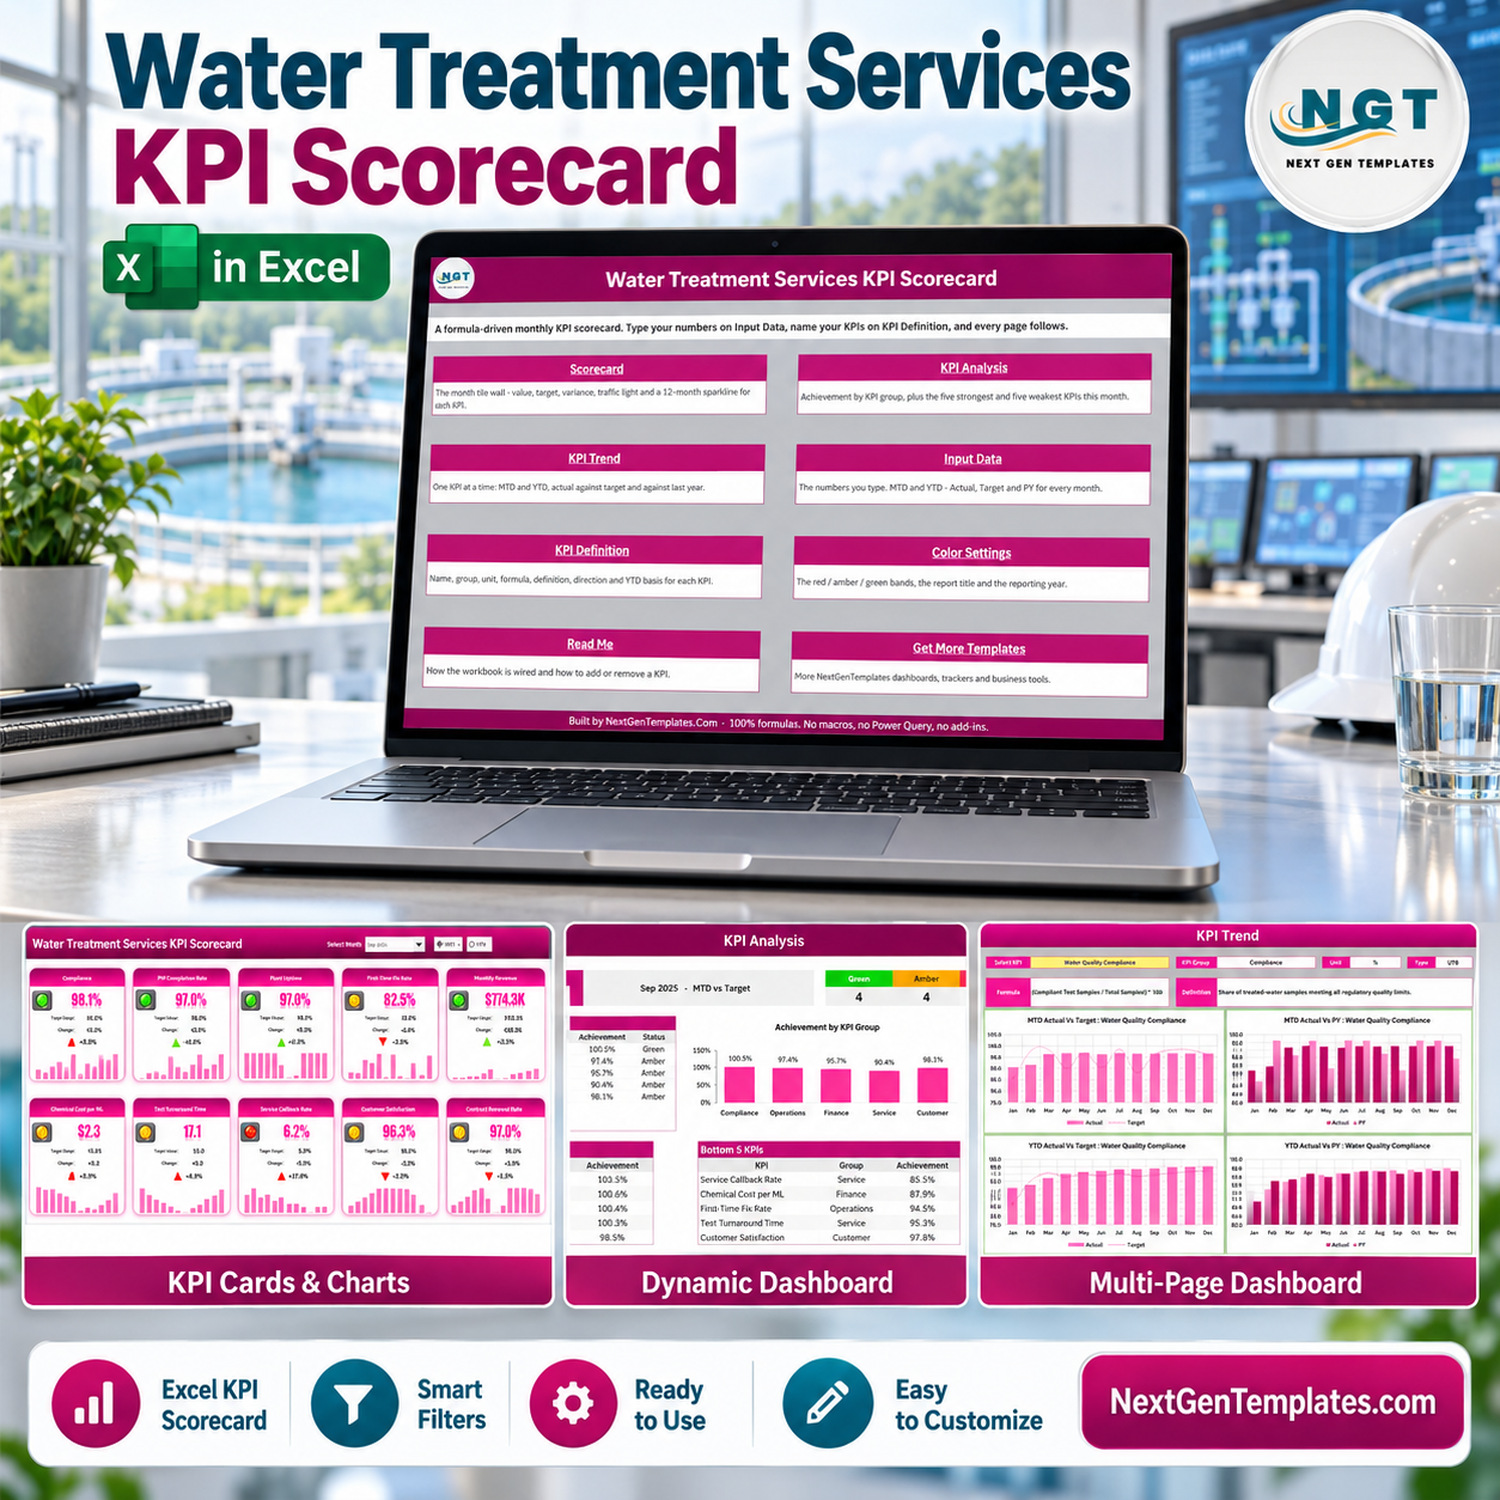




Water Treatment Services KPI Scorecard in Excel gives treatment-plant and field-service teams a monthly control view without adding another subscription. The workbook includes nine visible worksheets, ten ready-made service KPIs, room for twenty KPIs, twelve-month MTD and YTD inputs, and three configurable RAG bands. Review the authentic screenshots before buying: this is a formula-driven .xlsx workbook, not a cloud system, data feed, compliance certificate, or the separately listed KPI dashboard.
Key Features of Water Treatment Services KPI Scorecard in Excel
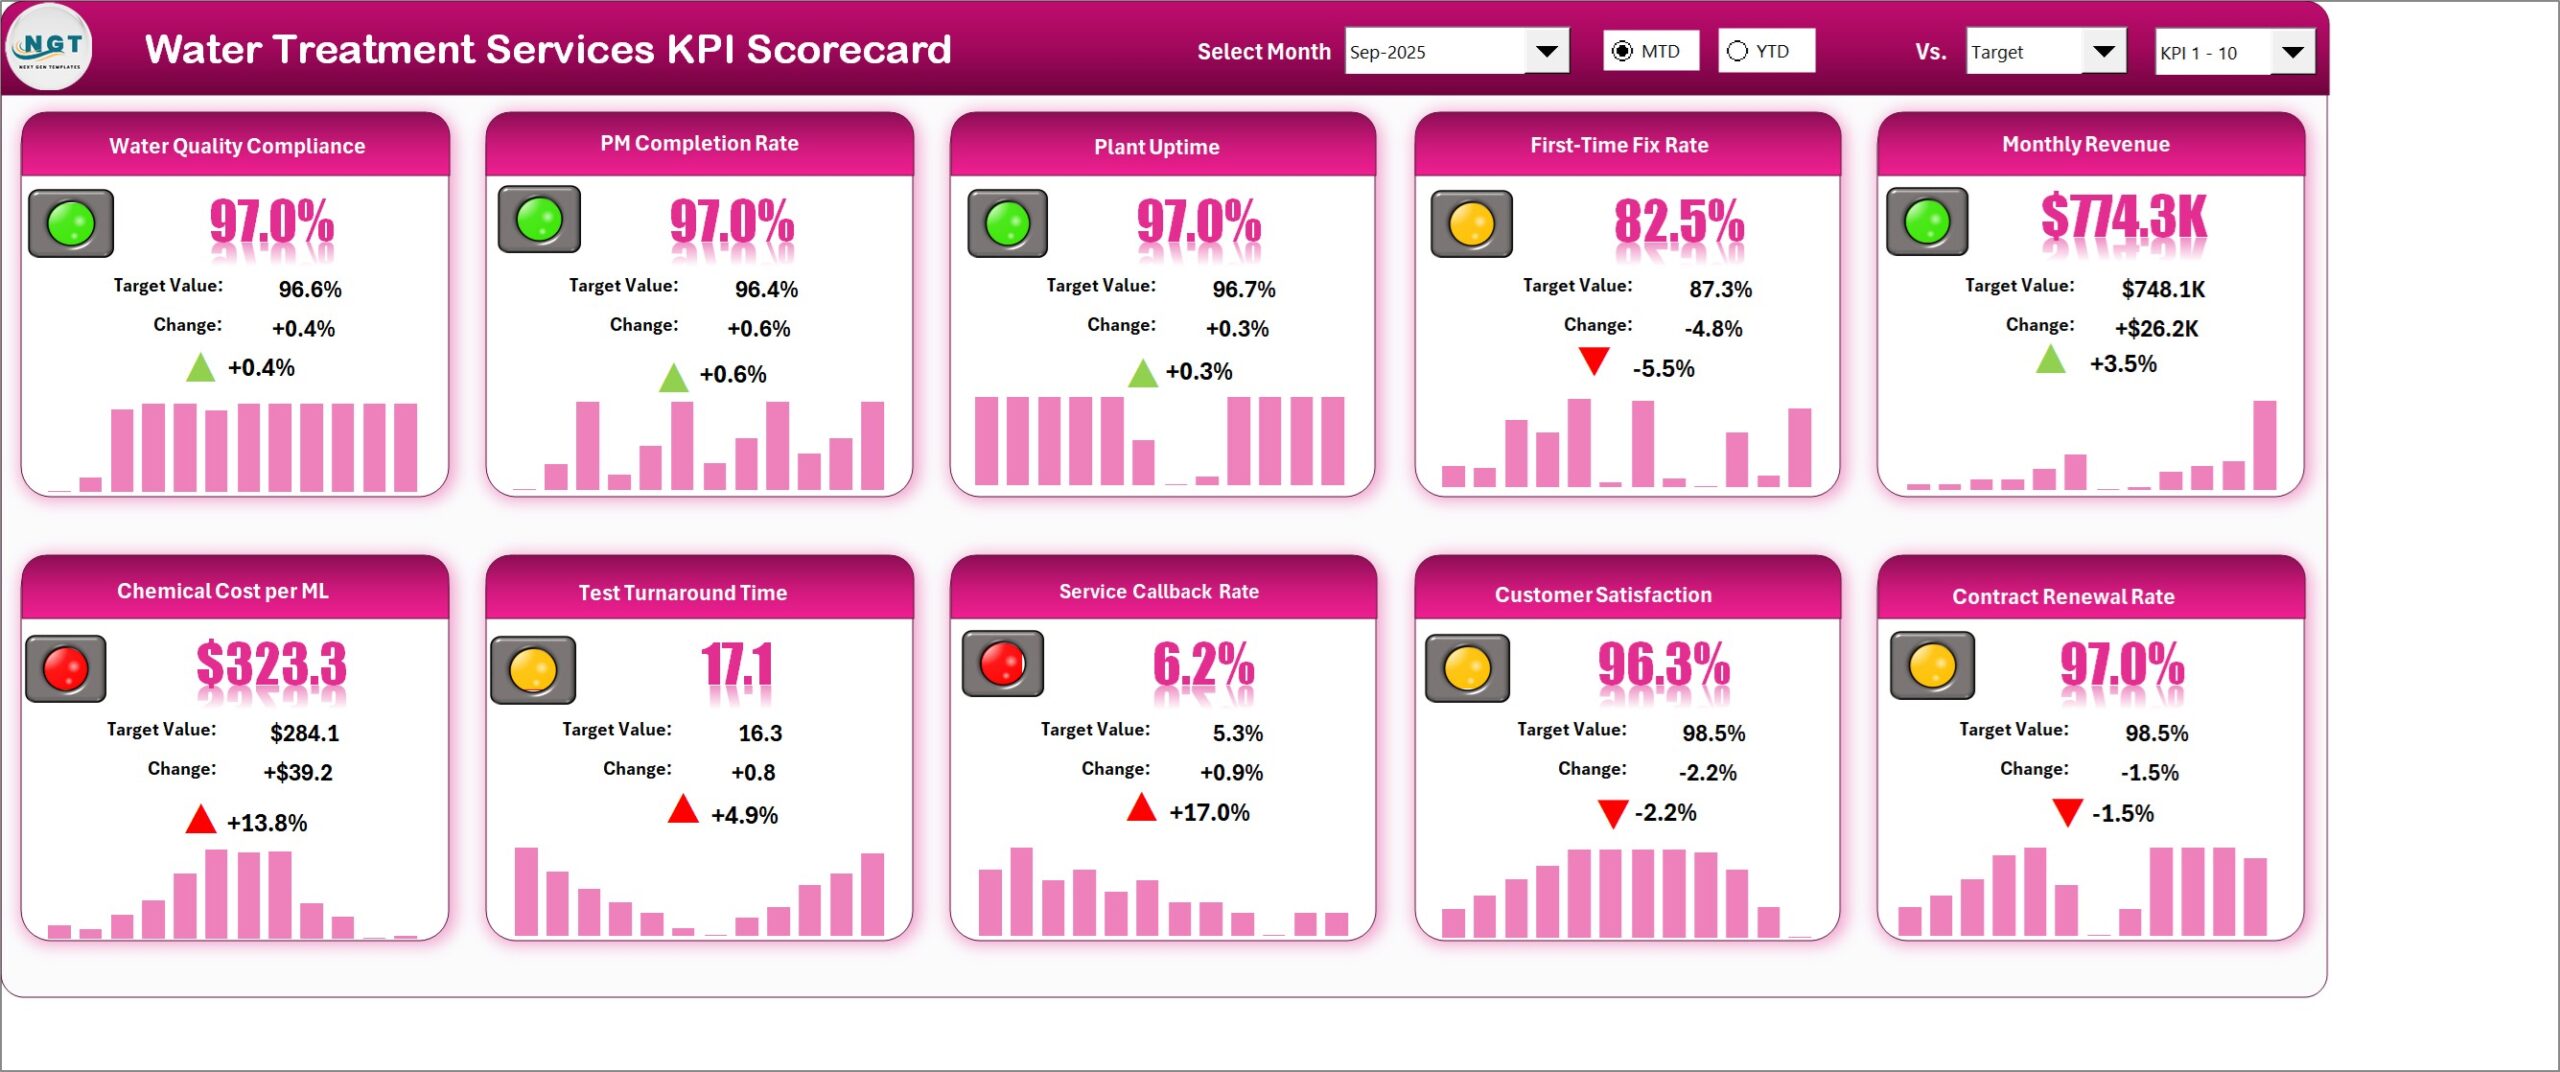
- Ten supplied KPIs: Water Quality Compliance, PM Completion Rate, Plant Uptime, First-Time Fix Rate, Monthly Revenue, Chemical Cost per ML, Test Turnaround Time, Service Callback Rate, Customer Satisfaction, and Contract Renewal Rate.
- Capacity for twenty KPIs: the scorecard selector switches between KPI 1-10 and KPI 11-20.
- MTD and YTD reporting: enter finished actual, target, and previous-year figures for every month.
- Flexible comparisons: compare Actual with Target, Previous Year, or Prior Month.
- Direction-aware status: Upper the Better and Lower the Better logic drives traffic lights and arrows correctly.
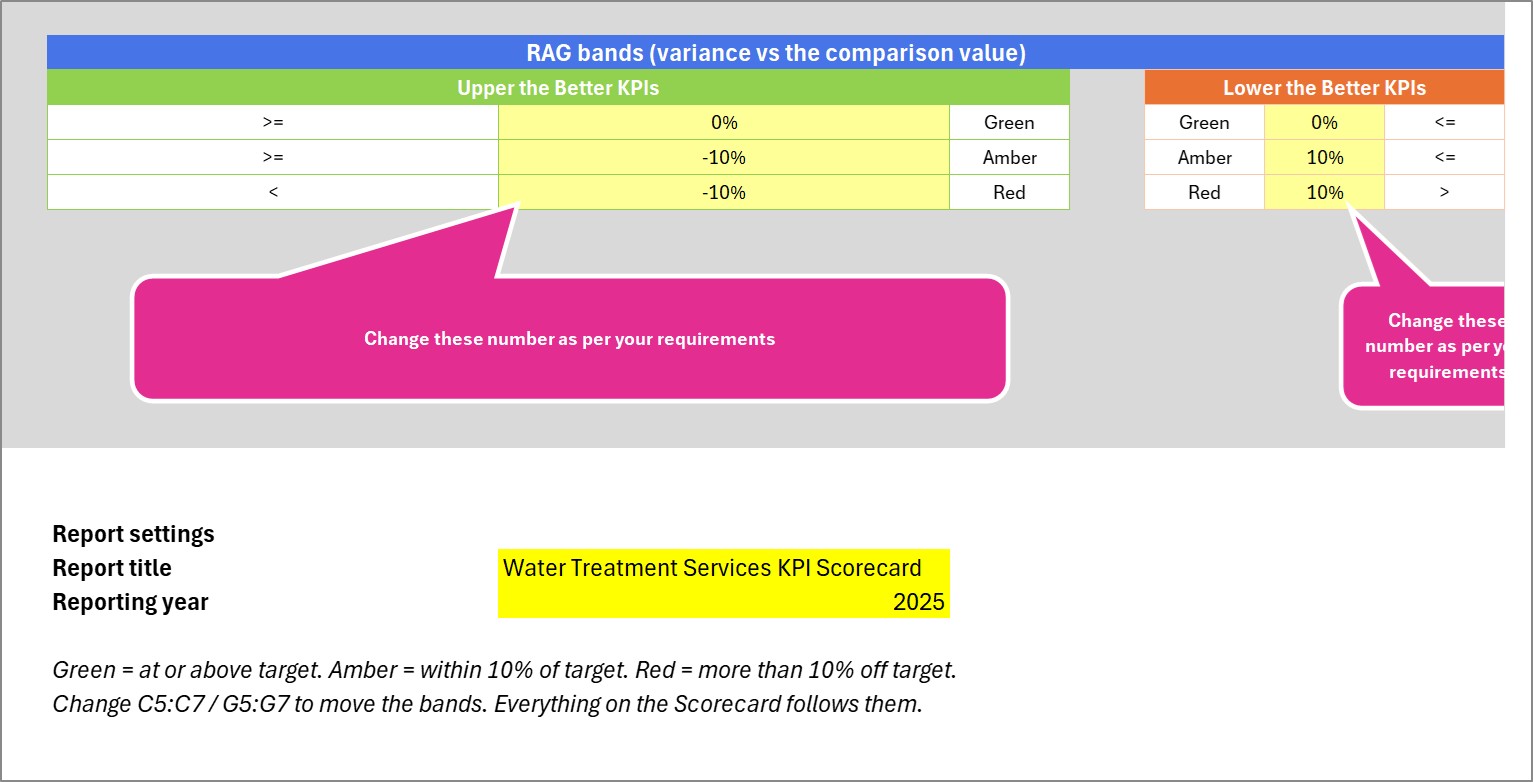
- Editable thresholds: adjust green, amber, and red variance bands on Color Settings.
- No macros: the workbook uses formulas, conditional formatting, camera pictures, and sparklines.
The related phrases water treatment KPI scorecard, Excel KPI scorecard template, water treatment performance tracker, and water services KPI reporting describe the same practical use: recording agreed monthly figures and reviewing performance consistently.
Use the Water Treatment Services KPI Scorecard in Excel as the shared reference during monthly review, then document actions in the systems your team already uses. For general spreadsheet guidance, see Microsoft Excel help and learning.
What’s Inside the Water Treatment Services KPI Scorecard in Excel
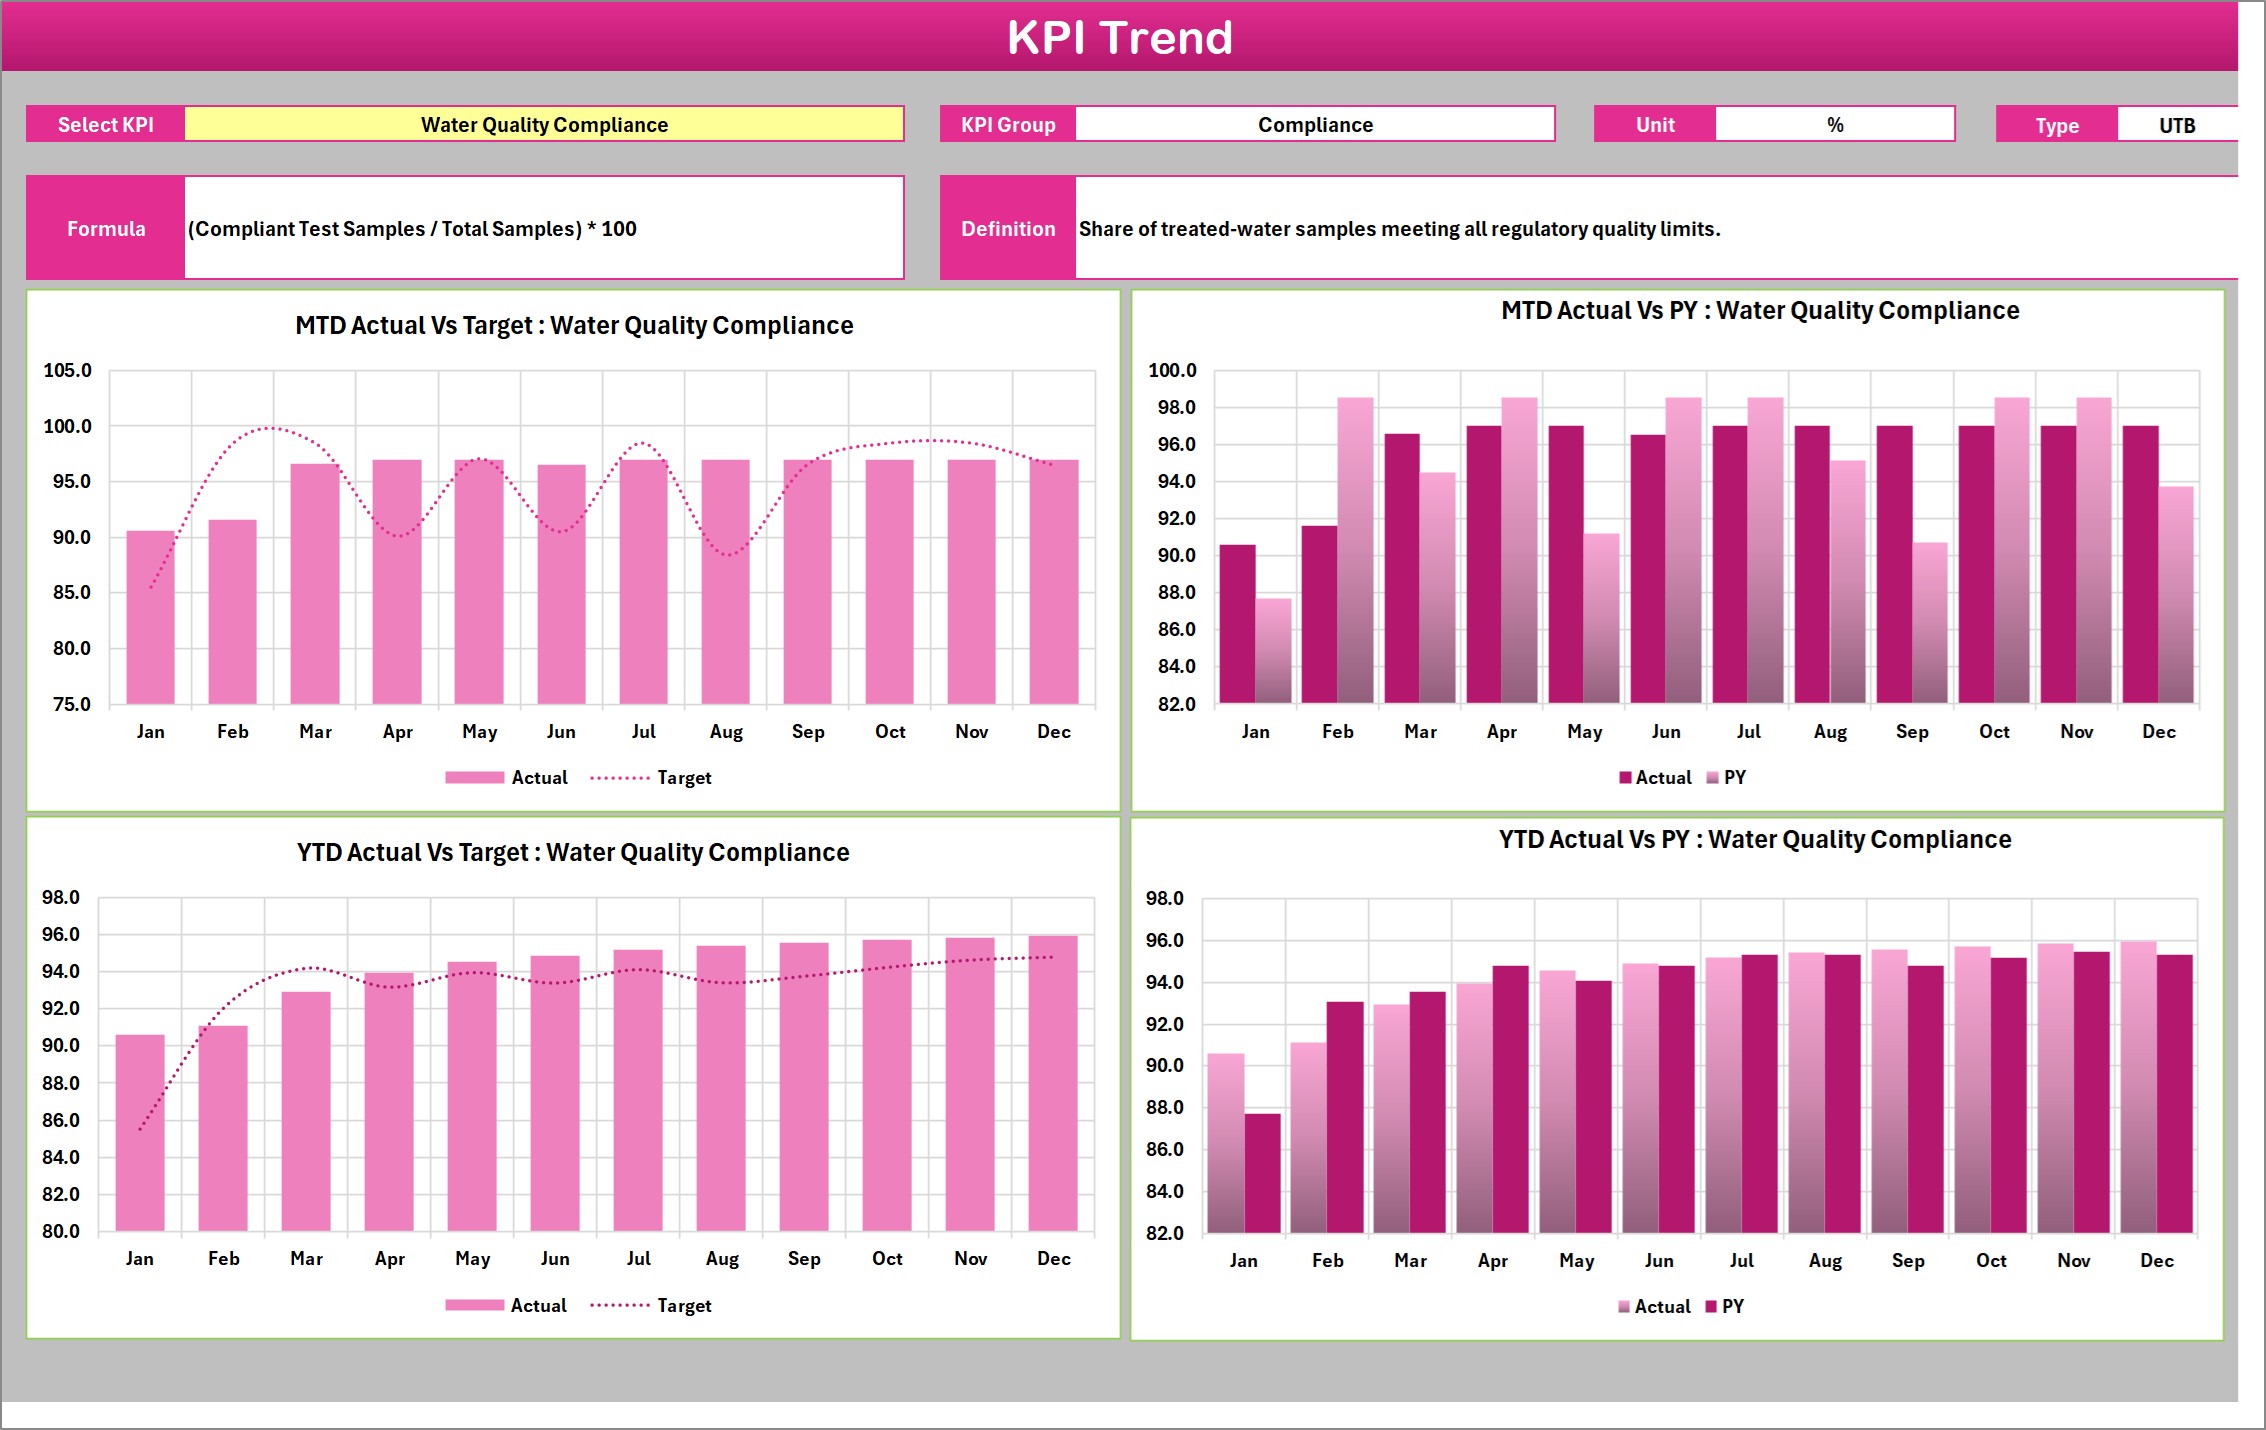
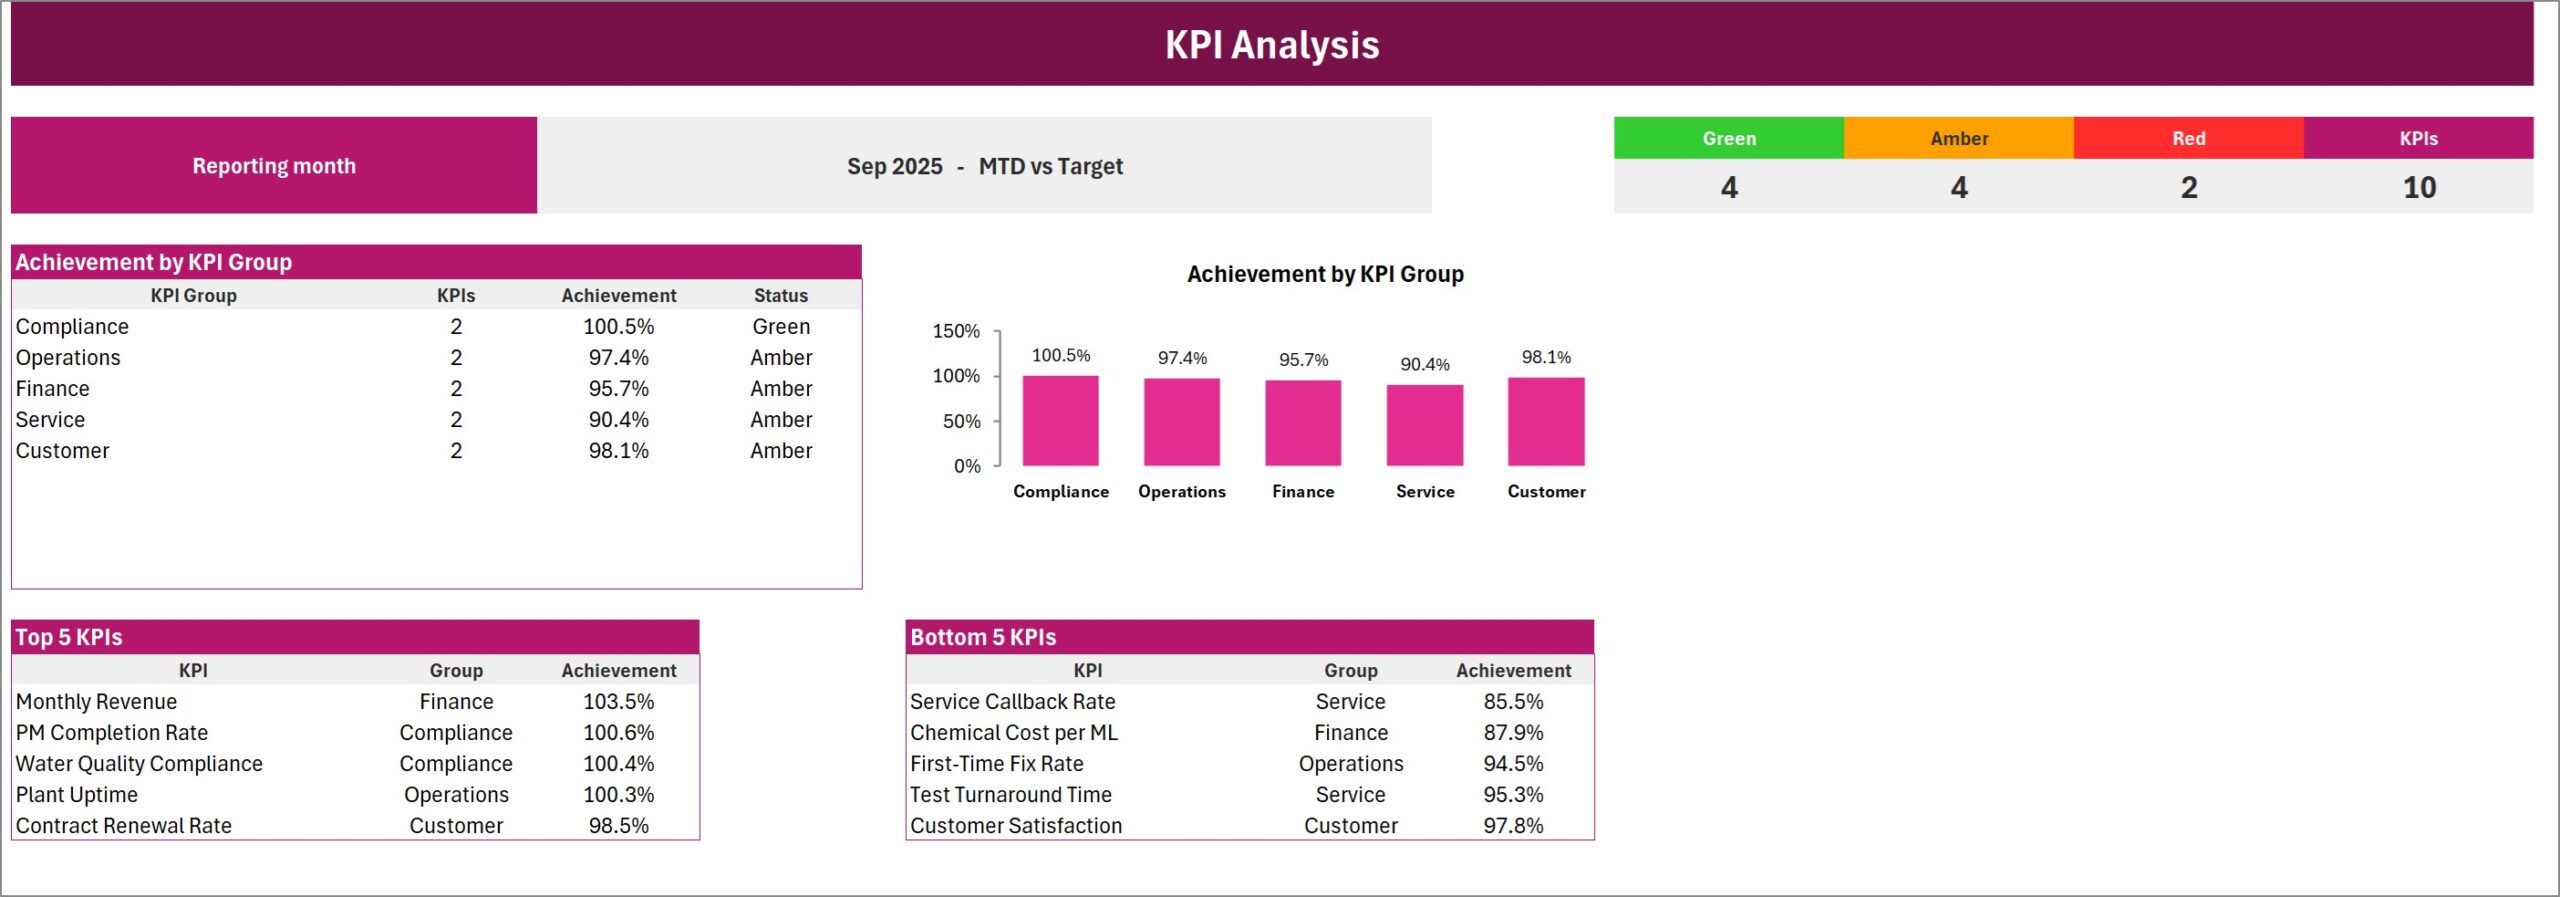
Home explains the workbook flow. Scorecard presents ten KPI cards at a time with actual, comparison value, variance, traffic light, arrow, and twelve-month sparkline. KPI Analysis summarizes achievement by group, counts green/amber/red KPIs, and lists the five strongest and five weakest results. KPI Trend shows one selected KPI across four charts: MTD Actual vs Target, MTD Actual vs PY, YTD Actual vs Target, and YTD Actual vs PY.
Input Data stores MTD and YTD Actual, Target, and PY figures for each month. KPI Definition stores name, group, unit, formula, definition, UTB/LTB direction, and YTD basis. Color Settings controls thresholds, report title, and reporting year. Read Me documents correct operation, while Get More Templates points to other template families.
Water Treatment Services KPI Scorecard in Excel vs. Google Sheets vs. Paid CRM/SaaS – Where This Fits
| Factor | This Excel scorecard | Google Sheets alternative | Paid operations SaaS |
|---|---|---|---|
| Cost model | One-time template purchase | Template or manual build | Usually recurring subscription |
| Platform | Microsoft Excel desktop | Browser-based Sheets | Vendor platform |
| Setup | Rename KPIs and enter monthly figures | May require rebuilding formulas | Configuration and onboarding |
| Collaboration | File-based sharing | Live link collaboration | Account-based collaboration |
| Custom fields | Editable definitions, groups, units, and thresholds | Editable with formula care | Depends on plan |
| Automation scope | Formula-based reporting from typed figures | Spreadsheet formulas | May include integrations |
| Best fit | Controlled monthly KPI review | Shared lightweight reporting | Workflow, tickets, or live system integration |
Who This Template Is For – and Who It’s Not For
It fits water treatment contractors, plant supervisors, maintenance coordinators, lab-service managers, commercial teams, and owners who already collect monthly figures and need a repeatable management review. It is especially useful when operations, compliance, finance, service, and customer KPIs must sit on one page.
It is not a SCADA system, laboratory information system, work-order platform, billing system, regulatory submission tool, or automatic data connector. The sample figures are demonstration data. Teams must validate KPI definitions, targets, calculations, and regulatory limits for their own operation.
How to Use the Water Treatment Services KPI Scorecard in Excel
- Open KPI Definition and confirm each KPI name is unique.
- Adjust groups, units, formulas, definitions, UTB/LTB direction, and YTD basis.
- Enter finished MTD and YTD Actual, Target, and PY figures on Input Data.
- Set the reporting year and RAG thresholds on Color Settings.
- Use the Scorecard selectors to choose month, MTD/YTD, comparison basis, and KPI set.
- Review group achievement and top/bottom performers on KPI Analysis, then inspect individual movement on KPI Trend.
The workbook does not calculate YTD roll-ups from MTD automatically because different measures require sums, averages, or another approved method. Enter the completed YTD value and record its basis in KPI Definition.
Real-World Use Cases
A plant manager can review uptime, preventive maintenance, and water quality performance at month-end. A service manager can compare first-time fix, callback rate, test turnaround time, and customer satisfaction. A commercial lead can monitor monthly revenue, treatment chemical cost, and contract renewal performance beside operational measures without mixing this scorecard with a live accounting system.
Frequently Asked Questions
Is this the Water Treatment Services KPI Dashboard?
No. This listing is the Excel KPI scorecard from the Scorecard product line. A dashboard with a similar topic is a separate product.
Does it use macros?
No. It uses worksheet formulas, conditional formatting, camera pictures, and sparklines.
How many KPIs can I use?
The workbook has room for twenty KPIs and displays ten at a time through the KPI-set selector.
Does it import data automatically?
No. Users enter finished monthly MTD and YTD Actual, Target, and PY figures.
Can I change the traffic-light bands?
Yes. Color Settings contains editable UTB and LTB variance thresholds.
Is it a compliance system?
No. It reports the figures and definitions you provide; it does not verify laboratory results or regulatory compliance.
About the Author
Built by PK – Microsoft Certified Professional with 15+ years of Excel, Google Sheets, and Power BI experience. Founder of NextGenTemplates, reaching 300K+ subscribers across YouTube channels. Every template is hand-built and tested before release.
Explore Related Templates
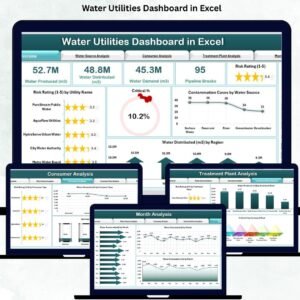
Compare the published Water Supply KPI Scorecard in Excel, the broader Water Utilities KPI Dashboard in Excel, and the analytical Water Utilities Dashboard in Excel. Each is a separate workbook with a different reporting structure.
Download the Water Treatment Services KPI Scorecard in Excel to standardize monthly performance conversations with a transparent, editable workbook. Last updated: September 2026.
The Water Treatment Services KPI Scorecard in Excel is ready for teams that value visible calculation rules, editable definitions, and disciplined month-end review.





























Reviews
There are no reviews yet.