

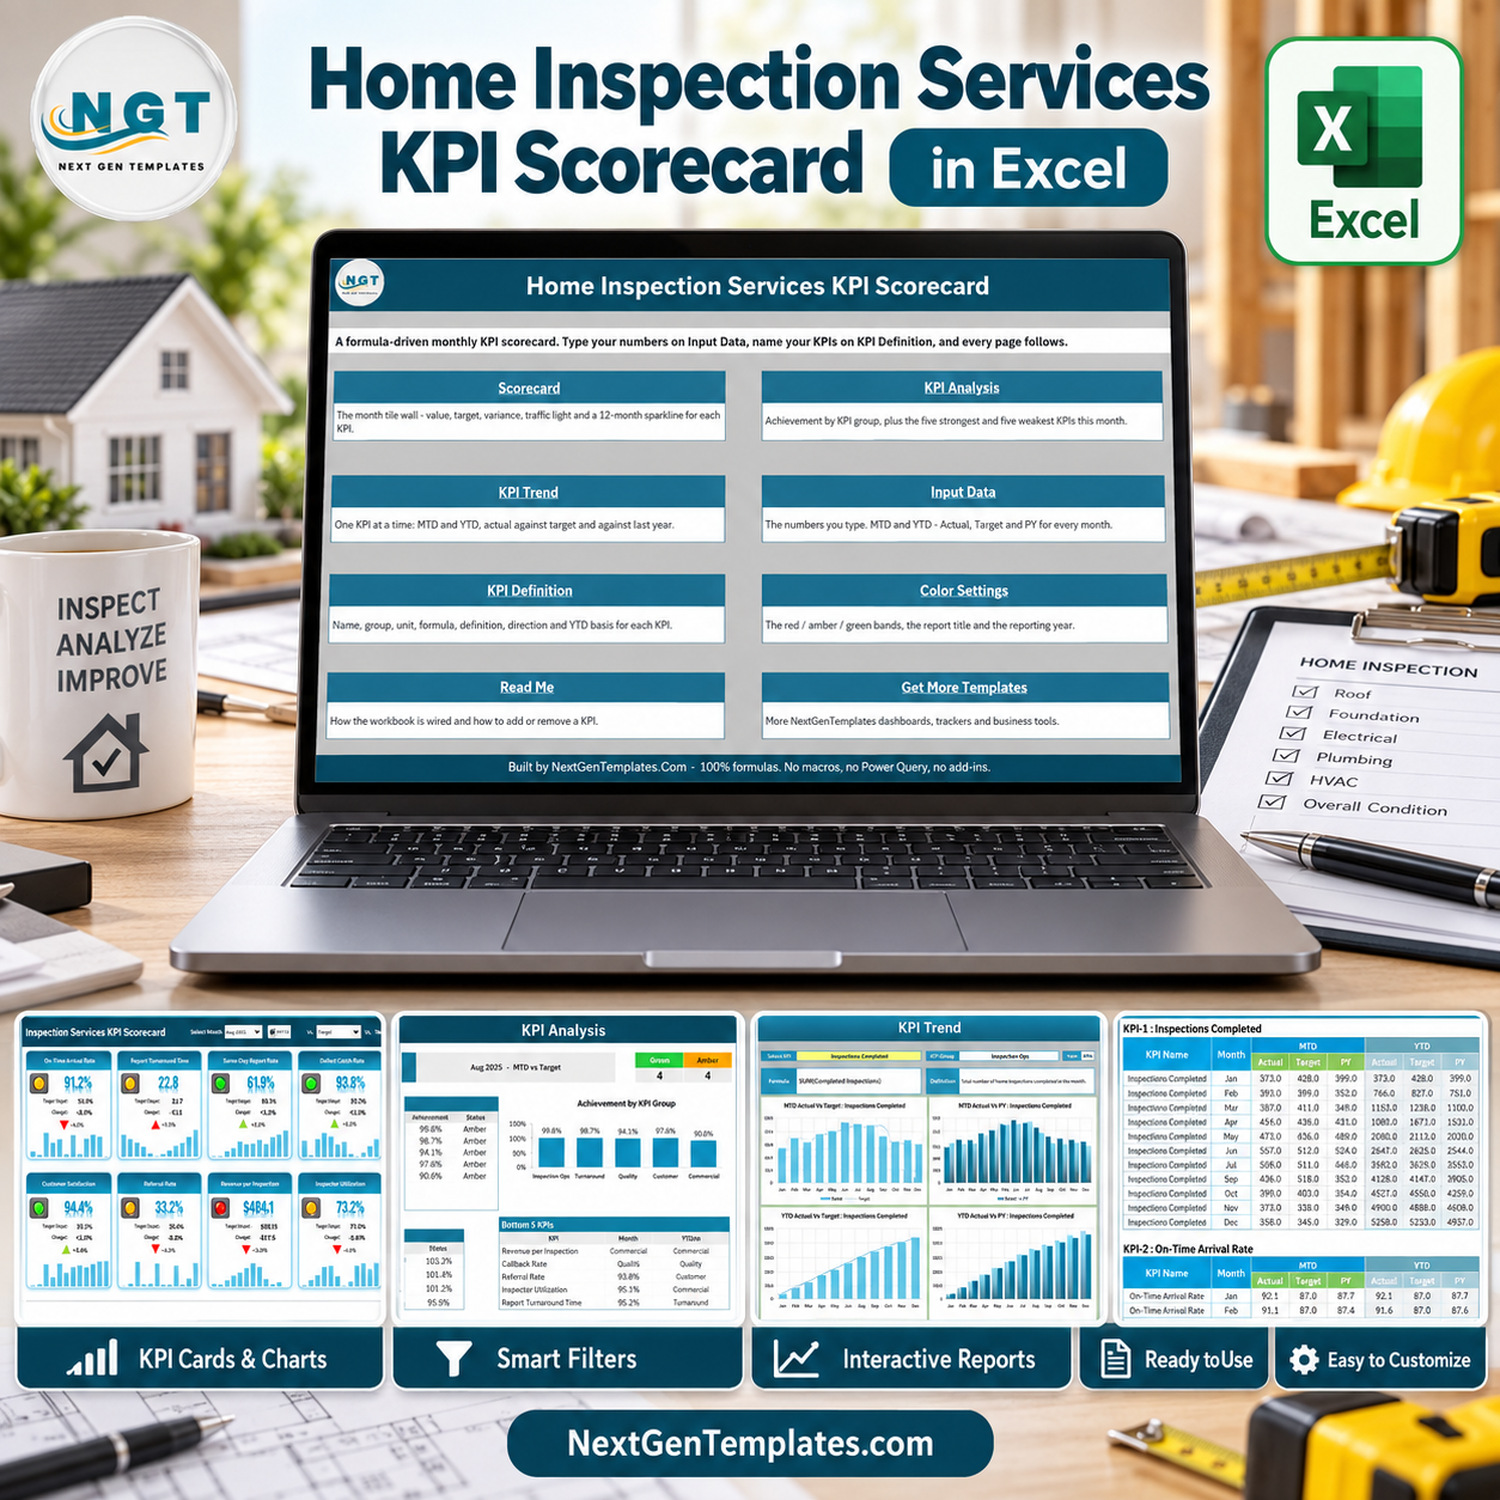
A home inspection company already has every number this page needs. Completed jobs come out of the scheduling system, arrival times and report delivery times out of the job log, callbacks and QA-audit results out of the office’s own review process, survey scores out of the post-inspection email, and revenue out of invoicing. What most inspection firms lack is one page that lines those figures up the same way every month, so a slow report month or a rise in callbacks is obvious at a glance instead of after an evening in five spreadsheets.
The Home Inspection Services KPI Scorecard in Excel is that page: 10 home inspection KPIs in 5 groups, a month picker, an MTD / YTD switch and direction-aware traffic lights, spread across 9 visible sheets. It ships with a complete 2025 sample year. Left on Aug-2025 with MTD and Vs. Target selected, it reads 4 Green, 4 Amber and 2 Red: Inspections Completed is 509 against a 493 target, while Revenue per Inspection is $484.1 against $561.6. It is a plain .xlsx built from formulas only – no macros, no Power Query, no add-ins.
Which product this is. NextGenTemplates ships several templates with near-identical names. This listing belongs to the KPI Scorecard family: ten KPIs on a tile-based monthly management page driven by numbers you type. It is not the separate Home Inspection Services KPI Dashboard in Excel, which belongs to the larger KPI Dashboard family, and it is not a slicer-driven analytics dashboard built on transaction records. A Google Sheets edition also exists – the Home Inspection Services KPI Scorecard in Google Sheets – with its own KPI list.
Instant download – One-time payment – No subscription – No per-user fees – Lifetime access
Key Features of the Home Inspection Services KPI Scorecard in Excel
- Ten home inspection KPIs on one page – Inspections Completed, On-Time Arrival Rate, Report Turnaround Time, Same-Day Report Rate, Defect Catch Rate, Callback Rate, Customer Satisfaction, Referral Rate, Revenue per Inspection and Inspector Utilization. Every tile shows the value, the comparison value, the change, an arrow and a 12-month sparkline.
- Month picker with an MTD / YTD switch – choose any month of the reporting year from the header dropdown and flip the whole page between month-to-date and year-to-date without touching a formula.
- Three comparison bases – measure against Target, against the same period last year (PY) or against the Prior Month. Tiles, arrows and traffic lights all follow the choice.
- Direction-aware traffic lights – eight KPIs are upper-the-better and two are lower-the-better (Report Turnaround Time and Callback Rate), so a faster report or fewer return visits turns green instead of red.
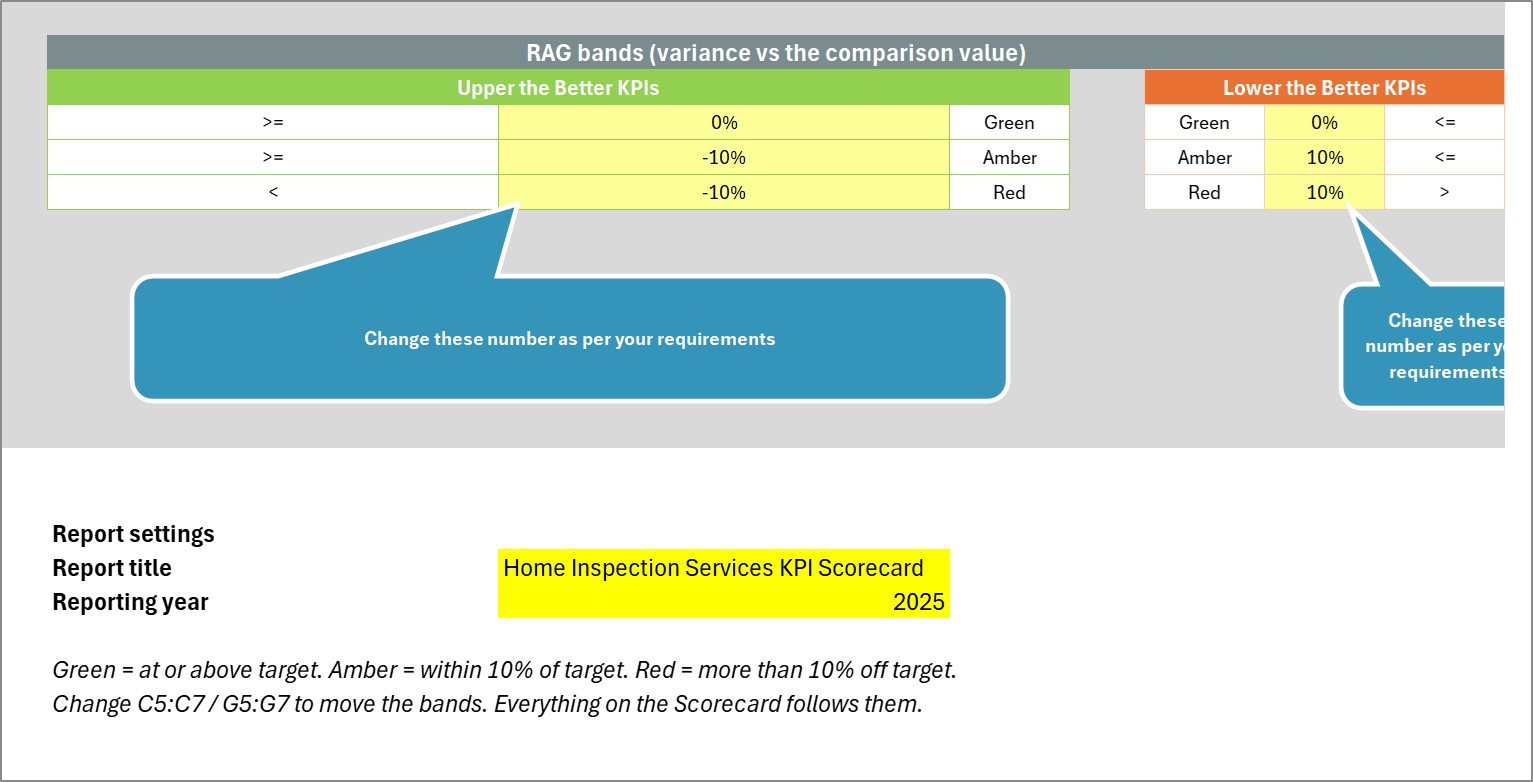
- Thresholds you own – the green / amber / red bands are ordinary cells on Color Settings. By default amber means within 10% of the comparison value; change it and every page re-flags itself.
- KPI Analysis page – Green / Amber / Red counts, achievement by KPI group with a column chart, and automatic Top 5 and Bottom 5 KPI tables for the selected month.
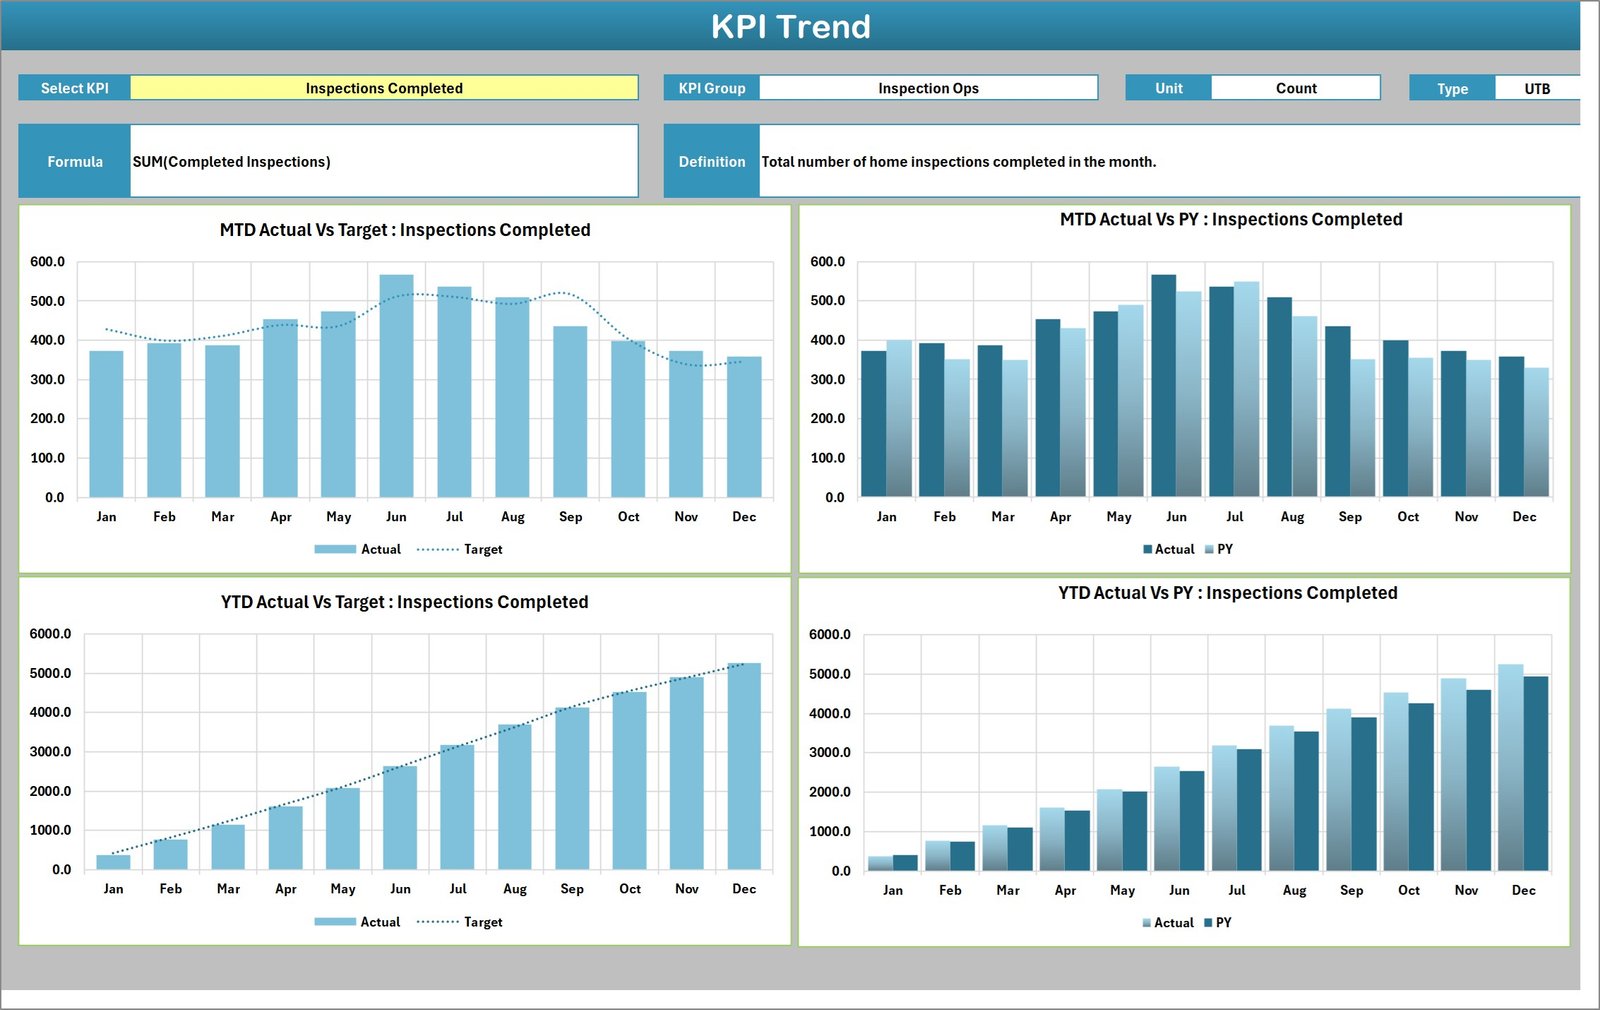
- KPI Trend page – one KPI at a time in four charts: MTD Actual vs Target, MTD Actual vs PY, YTD Actual vs Target and YTD Actual vs PY, with the KPI’s formula and definition printed above.
- Room for 20 KPIs – the Scorecard shows ten at a time and a set picker switches between KPI 1-10 and KPI 11-20.
What’s Inside the Workbook
The home inspection KPI scorecard has eleven sheets in total: nine visible pages and two hidden calculation sheets. Only two of them, Input Data and KPI Definition, ever need your typing.
Page 1: Home
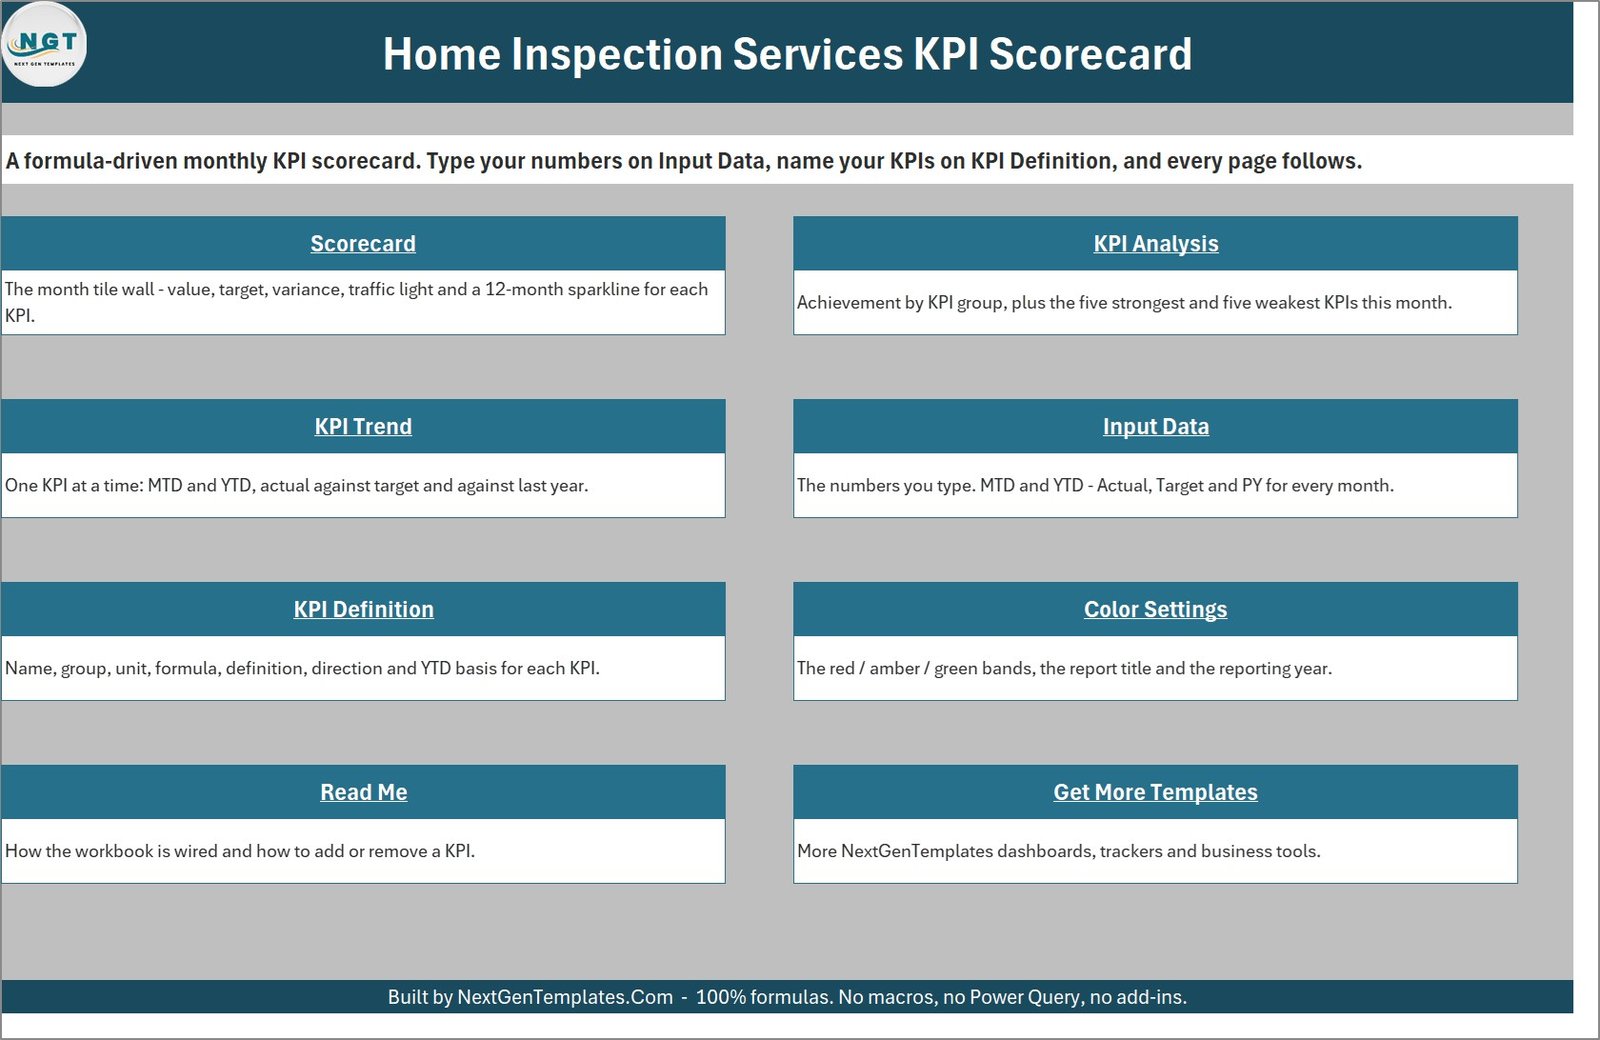
A navigation menu with a one-line description of all eight working pages, so a new user knows where to start.
Page 2: Scorecard
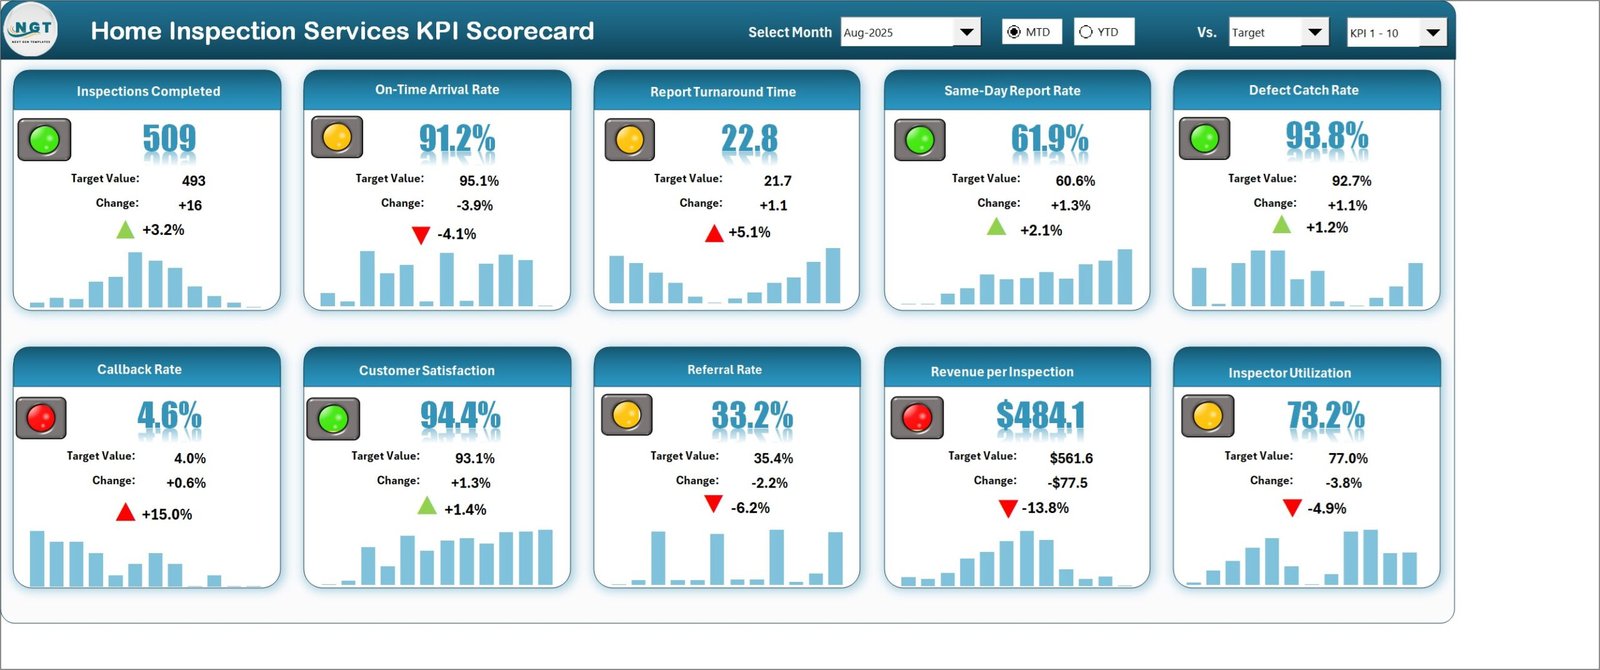
Ten KPI tiles for the selected month. In the sample, Callback Rate (4.6% vs 4.0%, +15.0% on a lower-the-better KPI) and Revenue per Inspection ($484.1 vs $561.6, -13.8%) are red, while Same-Day Report Rate (61.9% vs 60.6%) and Defect Catch Rate (93.8% vs 92.7%) are green. The header holds Select Month, MTD / YTD, Vs. and the KPI set picker.
Page 3: KPI Analysis
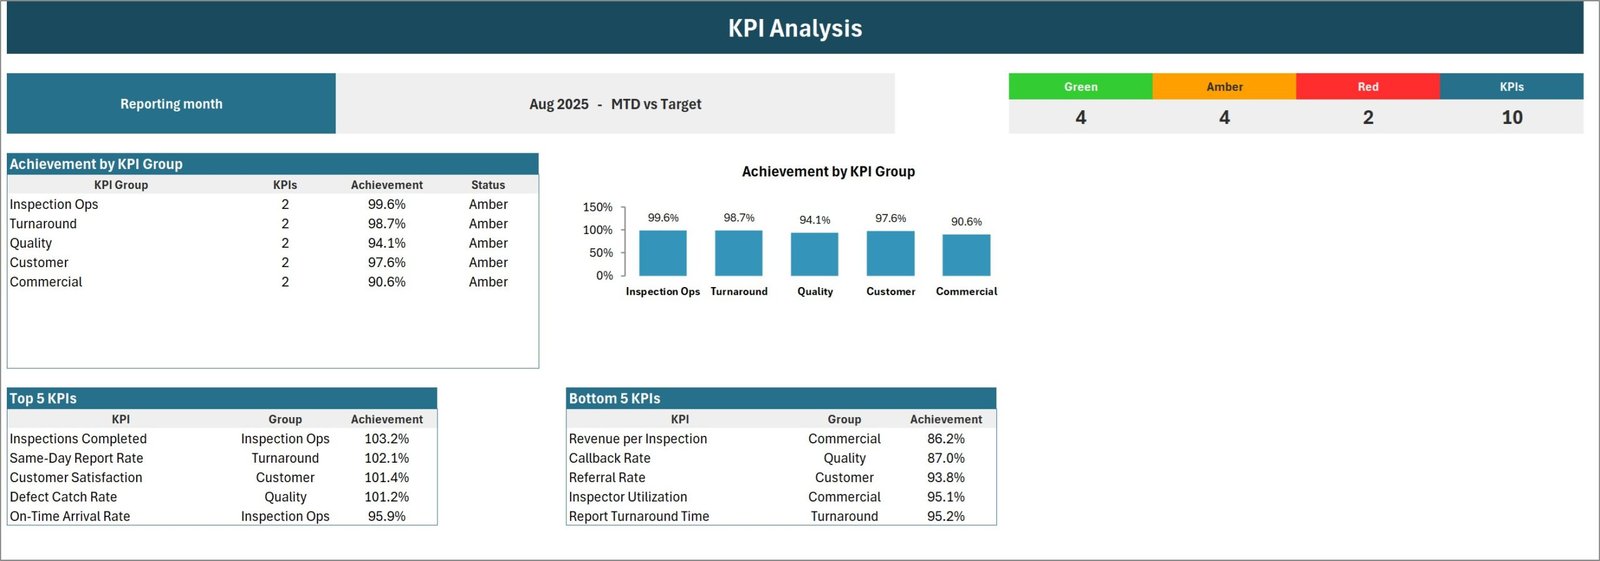
The reporting month and basis, a 4 Green / 4 Amber / 2 Red / 10 KPIs counter strip, Achievement by KPI Group (Inspection Ops 99.6%, Turnaround 98.7%, Quality 94.1%, Customer 97.6% and Commercial 90.6%, all Amber) with its chart, plus Top 5 KPIs led by Inspections Completed at 103.2% and Bottom 5 KPIs led by Revenue per Inspection at 86.2%.
Page 4: KPI Trend
Pick one KPI to see its group, unit, type, formula and definition, then four monthly charts against Target and PY. Inspections Completed peaks at 567 in June and closes 2025 at 5,258 year-to-date against a 5,233 target and 4,937 the year before.
Page 5: Input Data
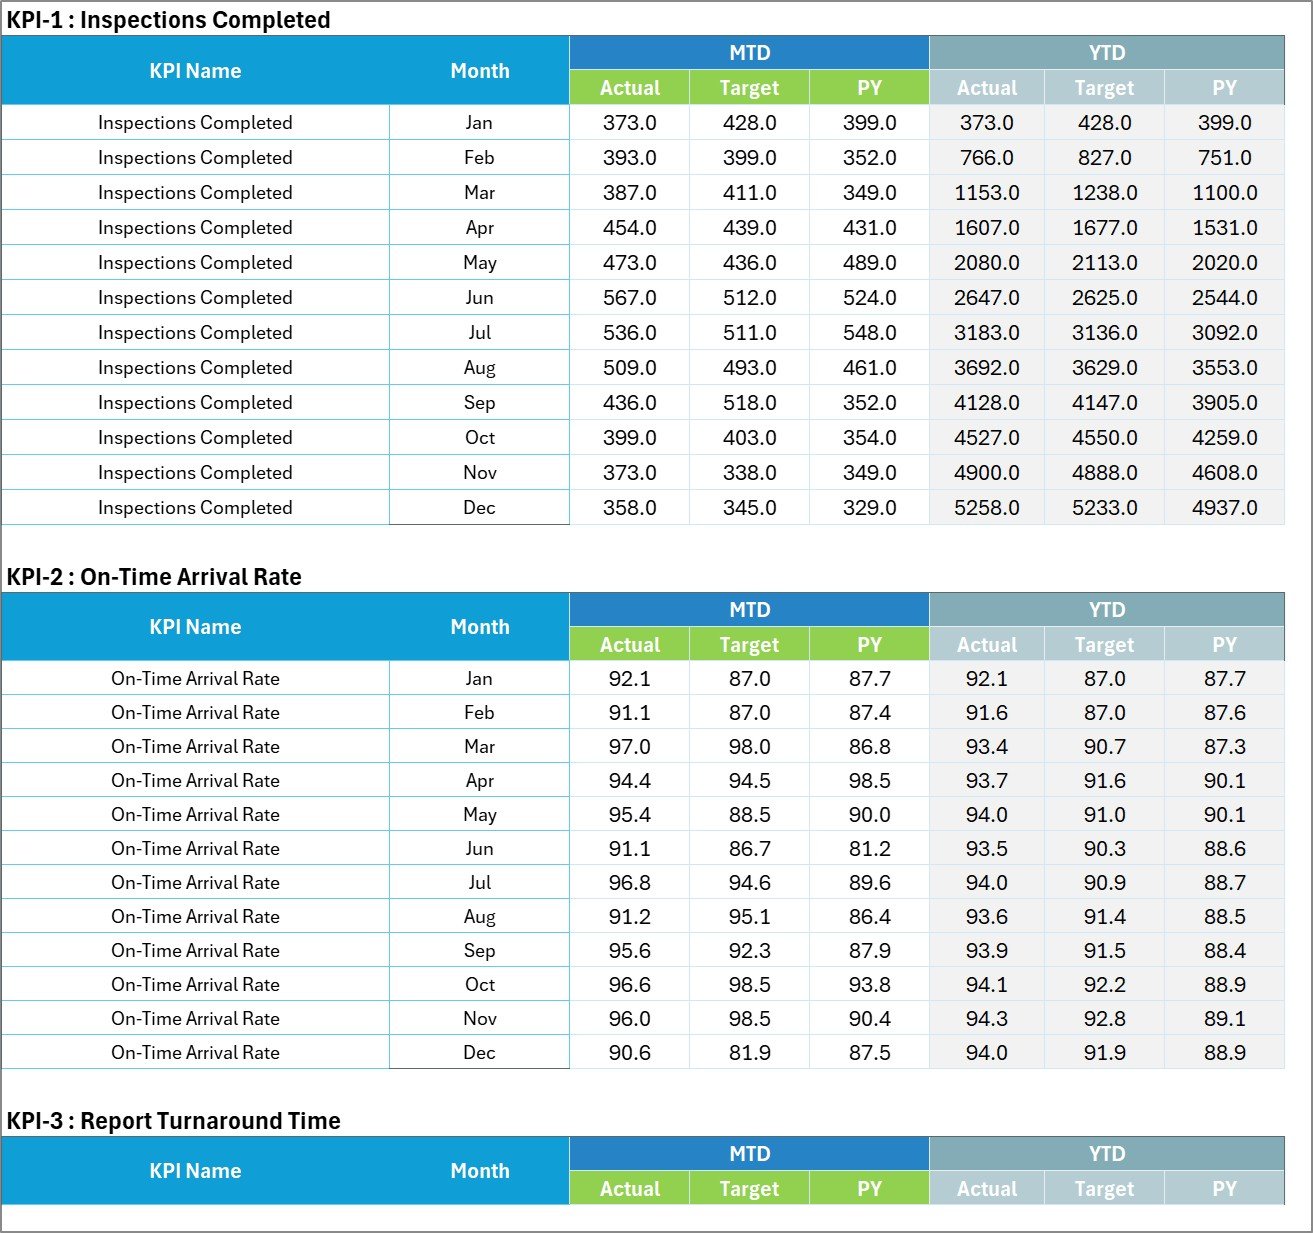
One numbered block per KPI with twelve month rows and six columns: MTD Actual, Target and PY, then YTD Actual, Target and PY. This is the only sheet that holds numbers.
Page 6: KPI Definition
Group, name, unit, formula, definition, UTB / LTB type and YTD basis for every KPI, with a Check column that flags duplicate names. Report Turnaround Time, for example, is defined as AVG(Report Delivered – Inspection End), in hours.

Page 7: Color Settings
The RAG bands for upper-the-better and lower-the-better KPIs, the report title and the reporting year that feeds the month picker.
Page 8: Read Me
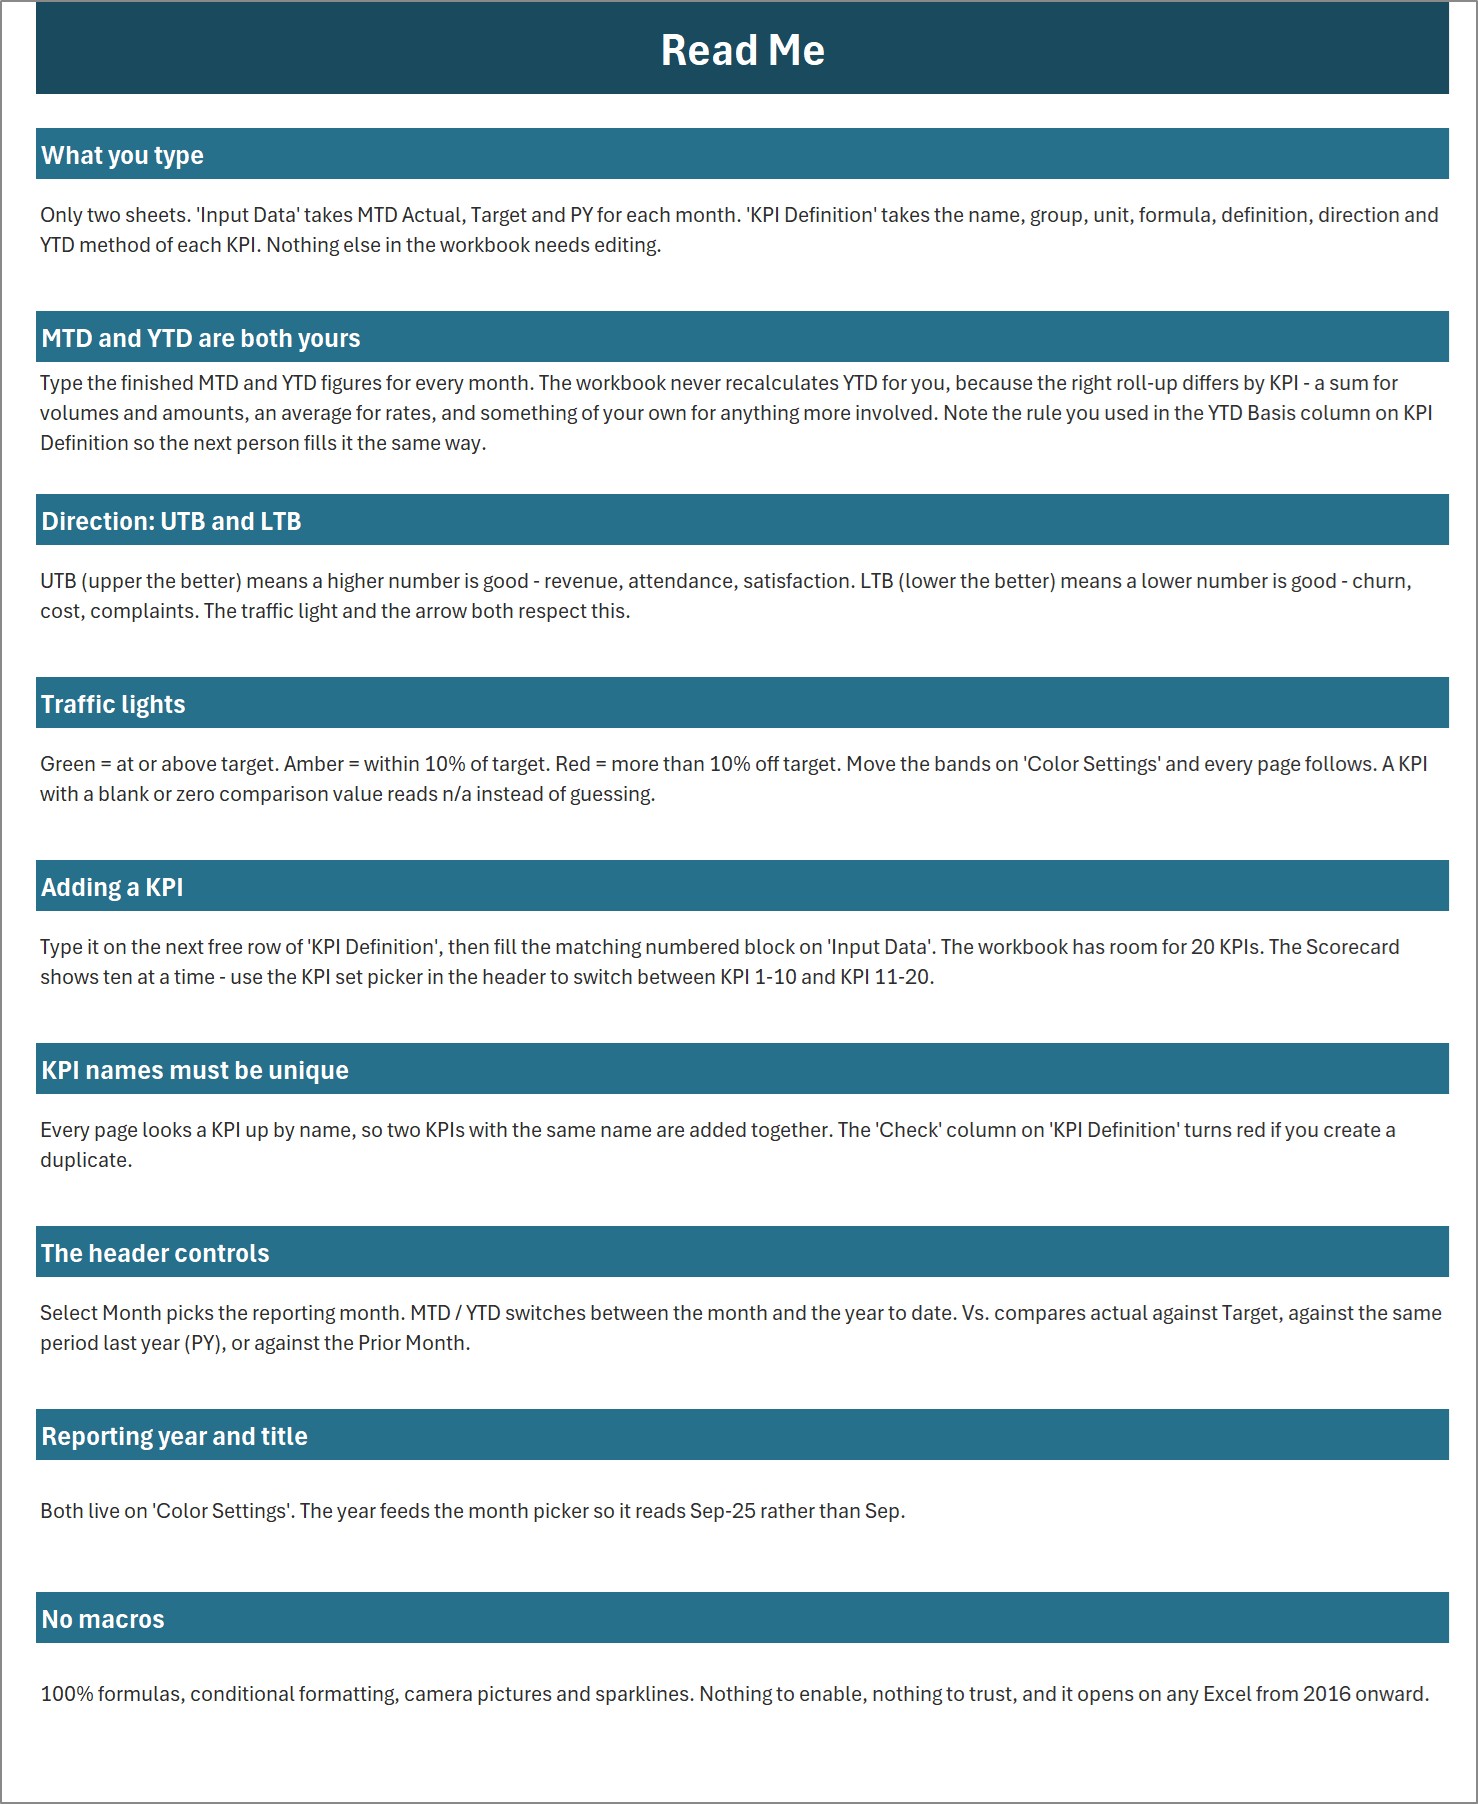
Nine short sections: what you type, why MTD and YTD are both typed, UTB and LTB, traffic lights, adding a KPI, unique names, the header controls, reporting year and title, and why there are no macros.
Page 9: Get More Templates
Pointers to the other NextGenTemplates product lines and a contact line for customisation requests.
The ten KPIs it ships with
| # | KPI | Group | Unit | Direction | Aug-2025 MTD vs Target |
|---|---|---|---|---|---|
| 1 | Inspections Completed | Inspection Ops | Count | Upper the better | 509 vs 493 – Green |
| 2 | On-Time Arrival Rate | Inspection Ops | % | Upper the better | 91.2% vs 95.1% – Amber |
| 3 | Report Turnaround Time | Turnaround | Hours | Lower the better | 22.8 vs 21.7 – Amber |
| 4 | Same-Day Report Rate | Turnaround | % | Upper the better | 61.9% vs 60.6% – Green |
| 5 | Defect Catch Rate | Quality | % | Upper the better | 93.8% vs 92.7% – Green |
| 6 | Callback Rate | Quality | % | Lower the better | 4.6% vs 4.0% – Red |
| 7 | Customer Satisfaction | Customer | % | Upper the better | 94.4% vs 93.1% – Green |
| 8 | Referral Rate | Customer | % | Upper the better | 33.2% vs 35.4% – Amber |
| 9 | Revenue per Inspection | Commercial | USD | Upper the better | $484.1 vs $561.6 – Red |
| 10 | Inspector Utilization | Commercial | % | Upper the better | 73.2% vs 77.0% – Amber |
Every name, group and unit is editable. Each page looks a KPI up by name, so renaming Referral Rate to Agent Referral Share on KPI Definition carries through the tiles, the trend charts and the analysis tables.
A note on the quality KPIs. Defect Catch Rate and Callback Rate are percentages you type from your own QA audits and job records. The scorecard does not write inspection reports, store property addresses, client names or findings, check work against any standards of practice or licensing rule, and it makes no compliance, certification or liability claim.
Excel Scorecard vs. Google Sheets vs. Inspection Software – Where This Fits
| Feature | This Excel KPI scorecard | A Google Sheets scorecard | Home inspection software (SaaS) |
|---|---|---|---|
| Cost | $9.99 one-time (sale price) | One-time template price | Recurring monthly subscription |
| Platform | Excel 2016 or later, Microsoft 365 | Web browser | Vendor web and mobile app |
| Setup time | Minutes – type numbers, rename KPIs | Minutes | Onboarding and data migration |
| Works offline | Yes | No | Partly, in the field app |
| Real-time team collaboration | No – share the file | Yes | Yes |
| Writes inspection reports | No | No | Yes |
| Change a KPI or threshold | Type over a cell | Type over a cell | Admin settings or vendor support |
| Year-1 cost at 5 users | One purchase | One purchase | Twelve months of per-user fees |
| Monthly one-page management report | Ready on day one | Ready on day one | Often needs a custom report |
For inspection firm owners who want a monthly performance page without paying for another platform, this scorecard sits beside the report-writing software rather than replacing it.
Who This Template Is For – and Who It’s Not For
This template is built for:
- Multi-inspector home inspection companies that want one monthly performance page for the whole business.
- Office and operations managers who report arrival punctuality, report turnaround and callbacks to the owner.
- Solo inspectors growing into a team who want to watch revenue per inspection and referral share month by month.
- Accountants and consultants preparing a monthly pack for a property services client.
This template is NOT for:
- Writing or delivering inspection reports – it reports on your business, not on a property.
- Scheduling, dispatch, agreements, payments or client records – it sits beside those systems.
- Licensing, standards-of-practice or insurance compliance – it is a performance report, not a compliance record.
How to Use the Home Inspection Services KPI Scorecard in Excel
- Open the workbook in desktop Excel. There are no macros, so there is no security prompt.
- Set the report title and reporting year on Color Settings; the year makes the month picker read Aug-2025 rather than Aug.
- Rename the KPIs on KPI Definition and set each group, unit, formula text, definition, UTB / LTB direction and YTD basis.
- Replace the sample numbers on Input Data: MTD Actual, Target and PY, then the YTD equivalents for each month.
- Adjust the bands on Color Settings if 10% is the wrong amber width for your business.
- Read the month on the Scorecard, then use KPI Analysis and KPI Trend to explain anything that moved.
If you want to understand the sparklines behind each tile, Microsoft’s Excel help and learning site covers them, although day to day you only type numbers and names.
Real-World Use Cases
Karen runs the office for a six-inspector firm. Each month she types ten numbers, prints the Scorecard and KPI Analysis pages, and walks the owner through the Bottom 5 table. Revenue per Inspection at $484.1 next to Inspector Utilization at 73.2% tells her the team is busy on lower-priced jobs rather than short of work.
Marcus is an owner-inspector building a second team. He watches Report Turnaround Time and Same-Day Report Rate together, because agents remember the inspector whose report arrived before the negotiation started, and Referral Rate follows.
Aisha is a bookkeeper with several property services clients. She keeps one copy of the workbook per client, switches the Vs. control to PY for the year-end meeting, and uses the KPI Trend page to show whether a quiet winter was seasonal.
Frequently Asked Questions
Does this connect to my inspection or scheduling software?
No. You type the monthly figures on the Input Data sheet. That keeps the workbook portable, offline and free of connections that break, and filling ten KPIs for a month takes a few minutes once your source reports are to hand.
Are macros required?
No. It is a plain .xlsx built from formulas, conditional formatting, camera pictures and sparklines. There is nothing to enable, and it opens in Excel 2016 or later and Microsoft 365.
How long does setup take?
Most buyers load the Home Inspection Services KPI Scorecard in Excel in under half an hour: set the year on Color Settings, rename or keep the ten KPIs, then paste twelve months of MTD and YTD figures into Input Data.
Does it calculate year-to-date for me?
No, deliberately. The right roll-up differs by KPI – Inspections Completed is summed, while rates, hours and revenue per inspection are averaged – so you type the finished YTD figure and record the rule in the YTD Basis column on KPI Definition.
Does it check my inspections against a standard or licensing rule?
No. Defect Catch Rate and Callback Rate display figures you enter from your own reviews. The workbook stores no reports, findings or client details and makes no compliance or certification claim.
Is this the same as the Home Inspection Services KPI Dashboard?
No. That is a different template family with its own KPI set and pages. This is the KPI Scorecard line: ten KPIs, nine sheets and a tile-based monthly page.
What is in the download?
A ZIP holding the Home Inspection Services KPI Scorecard workbook (.xlsx) and a PDF user manual for the Excel KPI Scorecard line.
About the Author
Built by PK – Microsoft Certified Professional with 15+ years of Excel, Google Sheets and Power BI experience. Founder of NextGenTemplates, reaching 300K+ subscribers across YouTube channels (@PKAnExcelExpert, @NextGenTemplates, @NeoTechNavigators). Every template is hand-built and tested before release.
Explore Related Templates
- Home Inspection Services KPI Scorecard in Google Sheets – the browser-based edition for teams that share one live file.
- Home Renovation Contractor KPI Dashboard in Excel – KPI reporting for a neighbouring residential trade.
- Pest Control Business KPI Scorecard in Excel – the same scorecard engine for another home services business.
- Septic Tank Service KPI Scorecard in Excel – a property services scorecard on the same layout.
- Fire Safety Services KPI Scorecard in Excel – another inspection-led service business on this line.
- Rent Collection Data Entry System in Excel – if you also manage rental property records.
Browse every scorecard and KPI template in the Excel KPI templates category.
Read the detailed blog post on this home inspection KPI scorecard
Visit our YouTube channel for step-by-step video tutorials
Last updated: September 2026
Watch the demo video:






























Reviews
There are no reviews yet.