

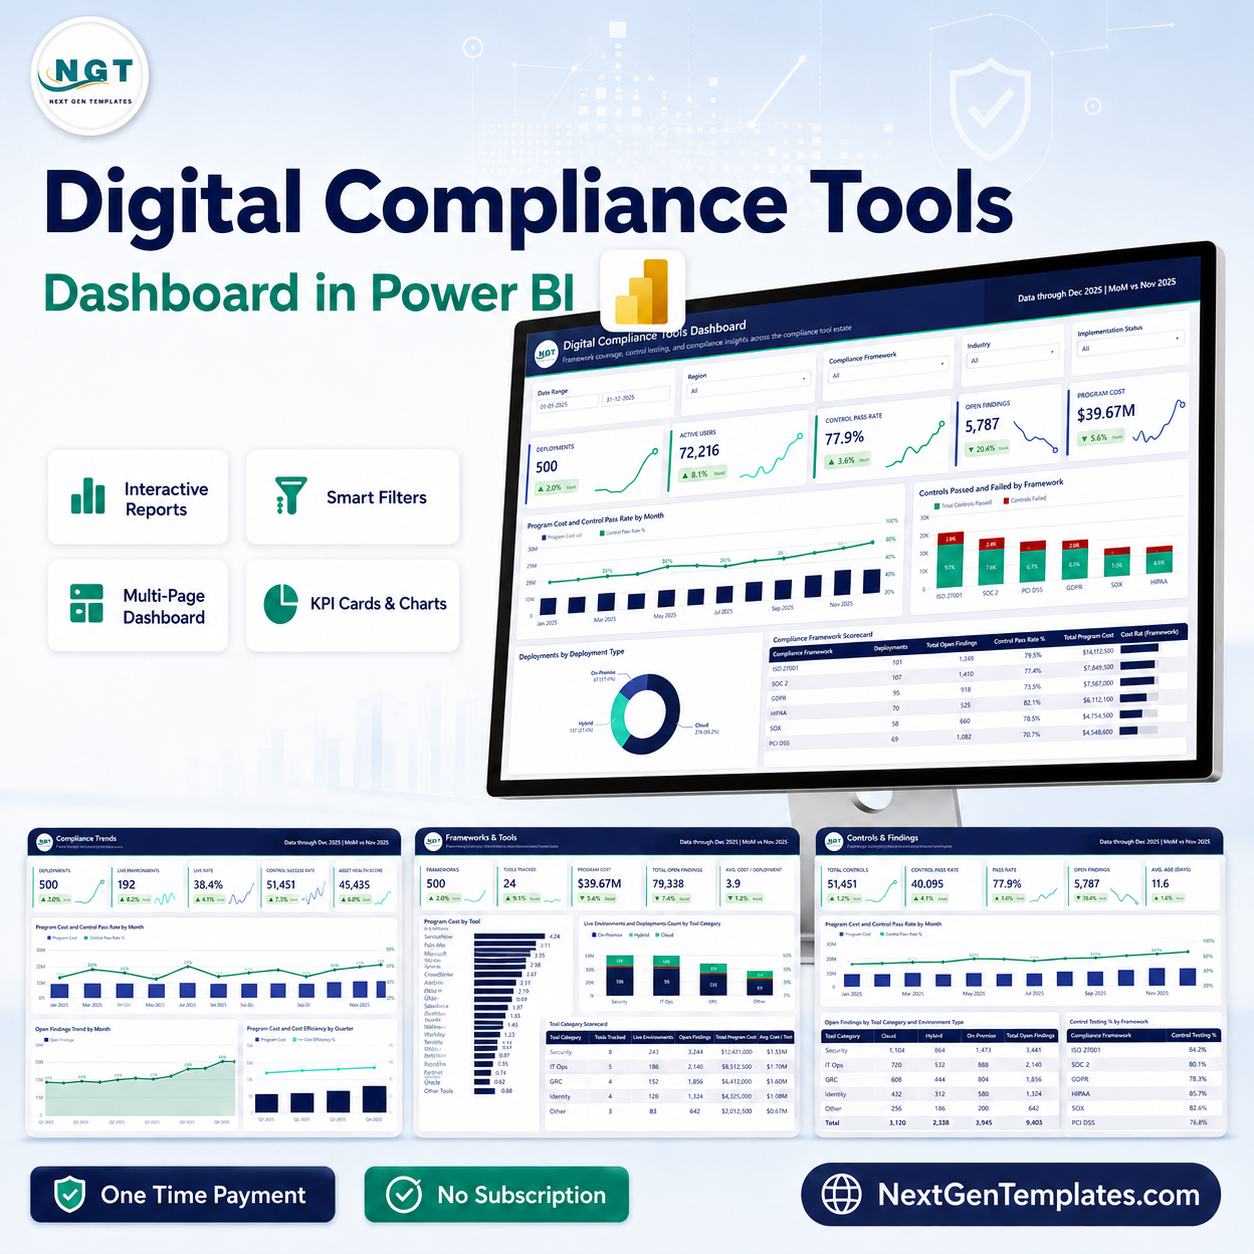

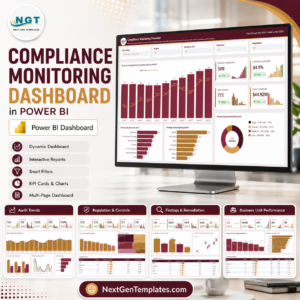
The Digital Compliance Tools Dashboard in Power BI takes a 500-deployment compliance tool estate worth $39.67M in licence and implementation spend and answers, in five report pages, the question every GRC lead is asked and cannot evidence: what are we actually getting for it. The sample estate runs 24 tools across 6 frameworks, monitors 51,451 controls at a 77.9% pass rate, carries 5,787 open findings, and has 135,175 licensed seats against only 72,216 active users — a 46.6% idle seat rate that is worth more in renewal negotiations than any control report. Every one of those numbers is a live DAX measure that recalculates the moment you point the model at your own tool inventory. Built and tested by a Microsoft Certified Professional and delivered as a plain .pbix you own outright. One payment, lifetime access, instant download, user manual PDF in the same zip.
Key Features of the Digital Compliance Tools Dashboard in Power BI
- 5 report pages plus a navigation rail — Overview, Compliance Trends, Frameworks & Tools, Controls & Findings and Adoption & Regions, each reachable in one click.
- 25 KPI cards with month-on-month deltas — five per page, each with its own sparkline and a coloured MoM arrow (Dec 2025 against Nov 2025 in the sample).
- 5 synced slicers on every page — Date Range, Region, Compliance Framework and Industry stay constant; the fifth changes with the page (Implementation Status, Deployment Type or Tool Category).
- 16 charts, matrices and scorecards — combo charts, stacked columns, donuts and four built matrix scorecards with in-cell cost bars and star ratings.
- Framework scorecard across six regimes — ISO 27001, SOC 2, PCI DSS, GDPR, SOX and HIPAA side by side on deployments, open findings, control pass rate and program cost.
- Seat waste made visible — 135,175 licensed seats, 72,216 active users, 53.4% seat utilisation and $549.31 cost per active user, so you can price a renewal on real usage.
- Tool-level spend ranking — all 24 tools ranked from RiskLattice ($3.1M) down to ObligoPro ($0.8M), with licence and implementation cost split by category.
- Findings triage by tool category and deployment type — a matrix that shows Policy Management carrying 1,310 open findings against Vendor Risk’s 753, split Cloud / Hybrid / On-Premise.
- Adoption by industry and region — six industries scored on deployments, licensed users, active users, seat utilisation and cost; five regions on active users.
- An 18-column, 500-row data model — one flat
Datatable plus a generated date table, so replacing the sample is a Power Query source change, not a rebuild. - No subscription, no add-ins — opens in the free Power BI Desktop and publishes to your own workspace if you have one.
What’s Inside the Digital Compliance Tools Dashboard in Power BI
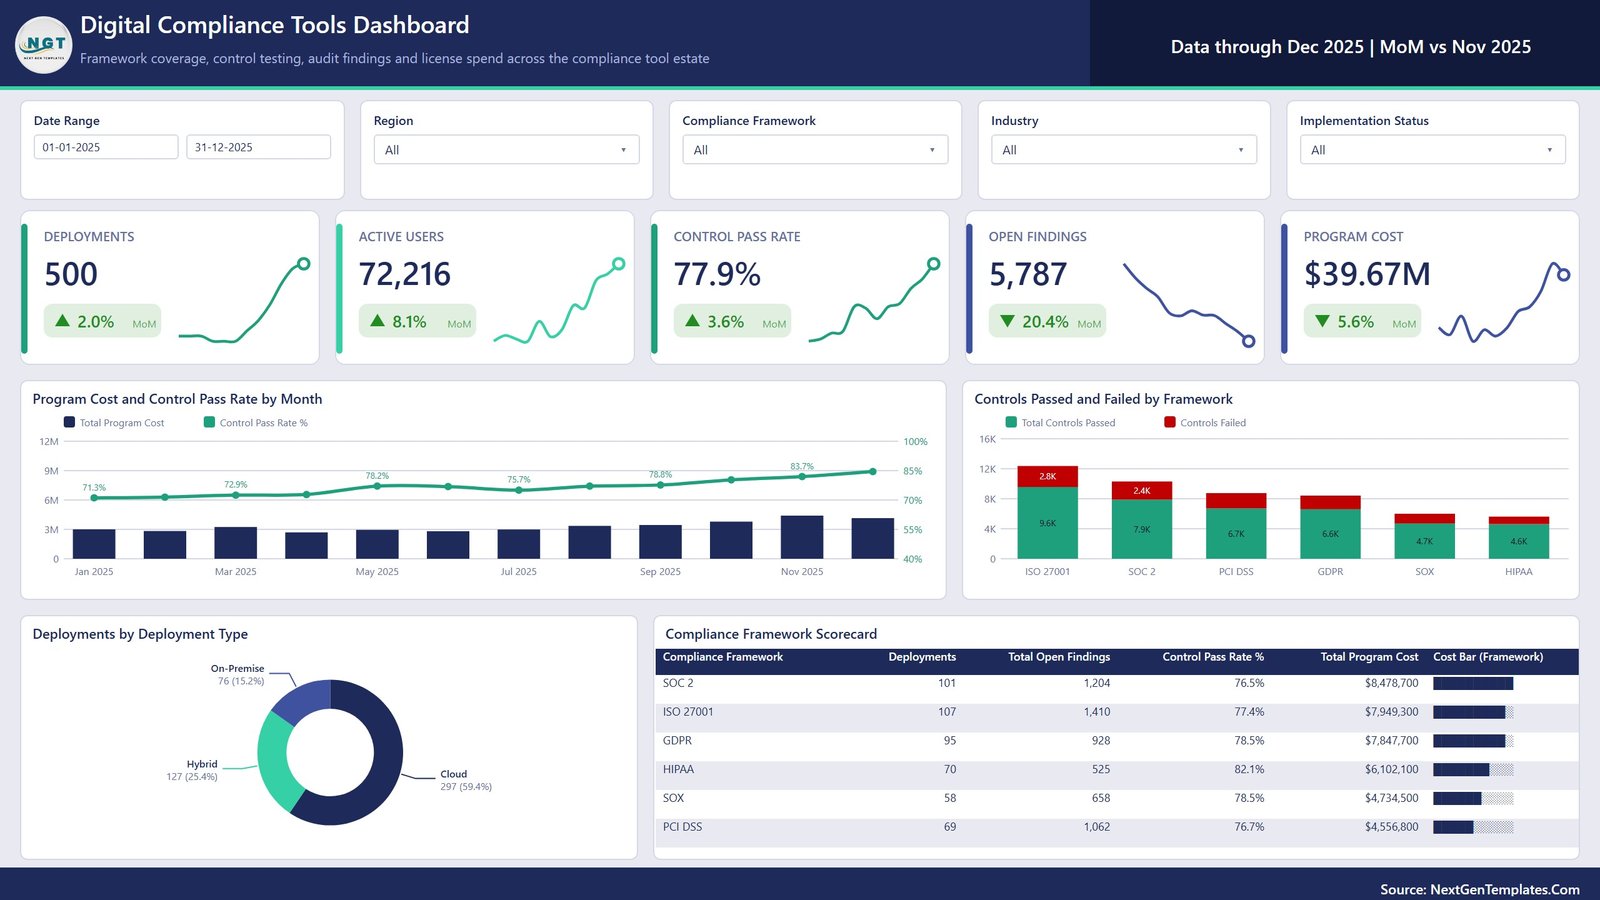
Page 1 — Overview. The whole estate on one screen. Five cards carry Deployments 500 (+2.0% MoM), Active Users 72,216 (+8.1%), Control Pass Rate 77.9% (+3.6%), Open Findings 5,787 (−20.4%) and Program Cost $39.67M (−5.6%). Below them sit Program Cost and Control Pass Rate by Month, which shows the pass rate climbing from 71.3% in January to 83.7% in November; Controls Passed and Failed by Framework, stacking 9.6K passed against 2.8K failed for ISO 27001 down to 4.6K / 1.0K for HIPAA; Deployments by Deployment Type (Cloud 297 at 59.4%, Hybrid 127 at 25.4%, On-Premise 76 at 15.2%); and the Compliance Framework Scorecard, where SOC 2 costs the most at $8,478,700 while HIPAA passes the most controls at 82.1%.
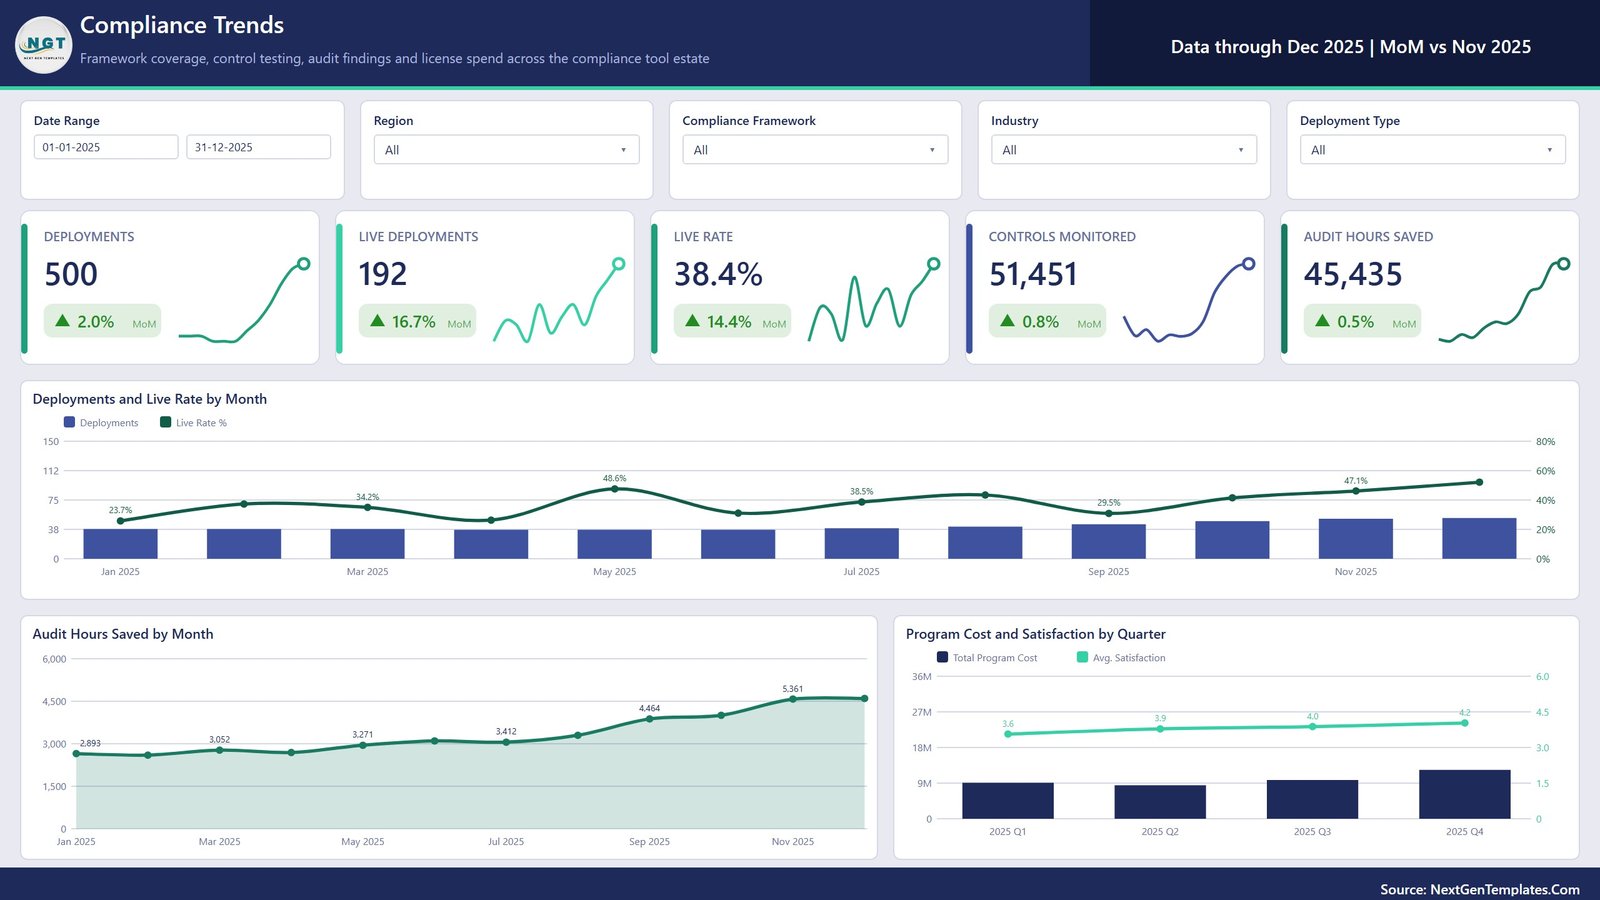
Page 2 — Compliance Trends. Rollout progress and the payback from automation. Cards: Deployments 500, Live Deployments 192 (+16.7%), Live Rate 38.4% (+14.4%), Controls Monitored 51,451 (+0.8%) and Audit Hours Saved 45,435 (+0.5%). Deployments and Live Rate by Month pairs volume with the proportion actually in production; Audit Hours Saved by Month runs as an area chart from 2,893 hours in January to 5,361 in November; and Program Cost and Satisfaction by Quarter shows spend rising while average satisfaction moves 3.6 → 3.9 → 4.0 → 4.2 across 2025.
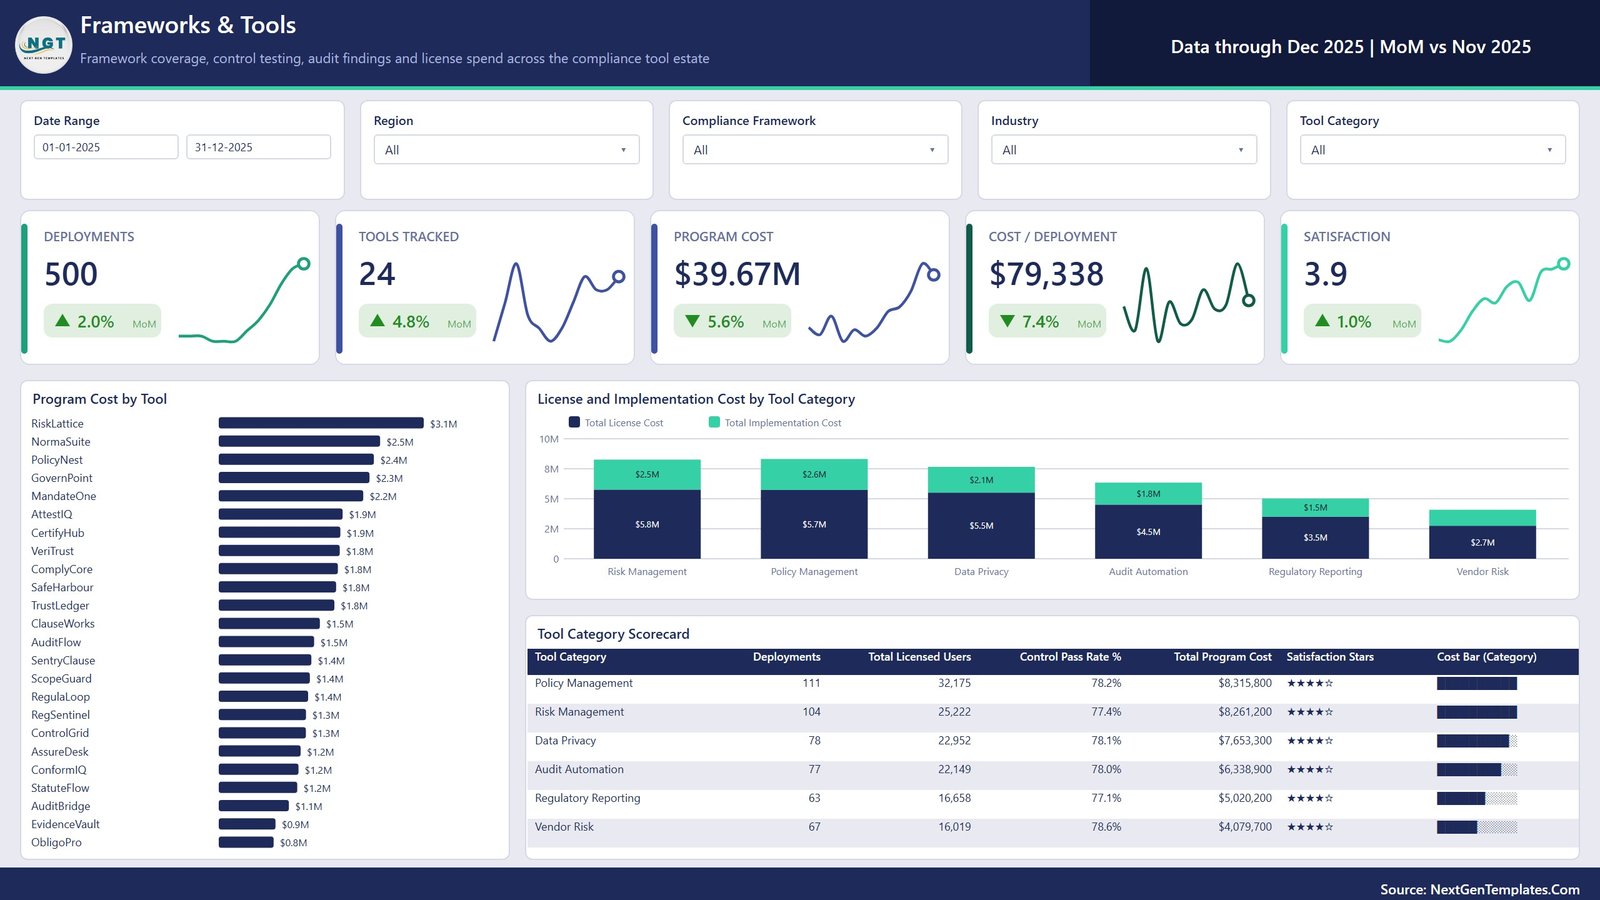
Page 3 — Frameworks & Tools. Where the money goes, tool by tool. Cards: Deployments 500, Tools Tracked 24 (+4.8%), Program Cost $39.67M (−5.6%), Cost / Deployment $79,338 (−7.4%) and Satisfaction 3.9 (+1.0%). Program Cost by Tool ranks all 24 tools from RiskLattice ($3.1M), NormaSuite ($2.5M) and PolicyNest ($2.4M) down to EvidenceVault ($0.9M) and ObligoPro ($0.8M). License and Implementation Cost by Tool Category splits the two components — Risk Management $5.8M licence plus $2.5M implementation, Policy Management $5.7M plus $2.6M, down to Vendor Risk at $2.7M plus $1.5M. The Tool Category Scorecard then puts deployments, licensed users, control pass rate, cost and a star rating on one line for each of the six categories.
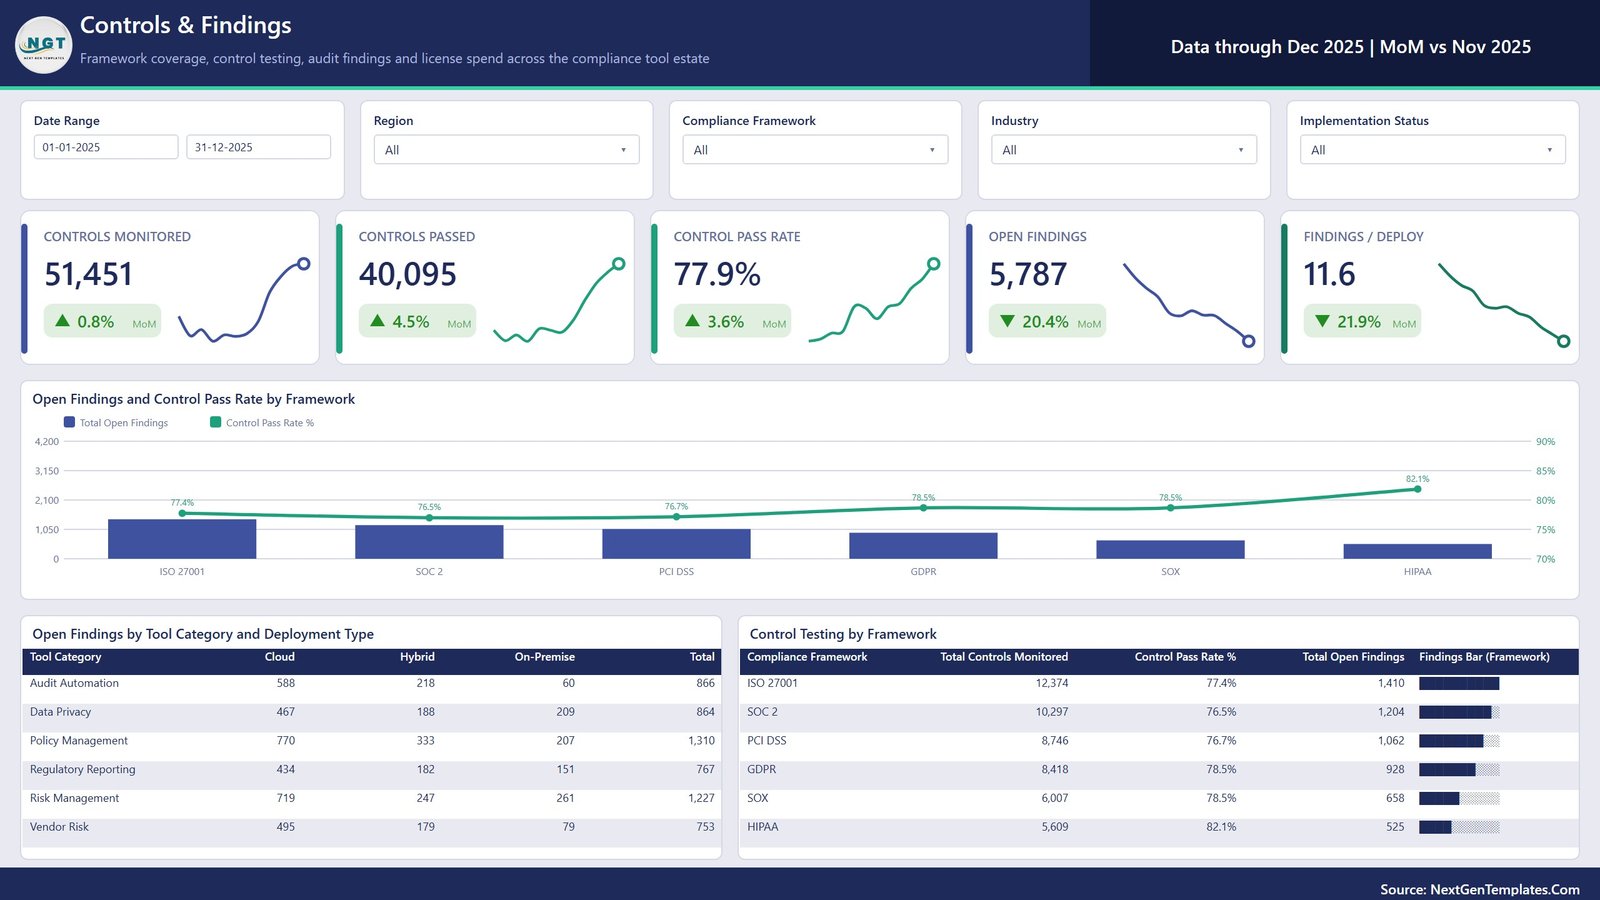
Page 4 — Controls & Findings. Testing coverage and the backlog it produces. Cards: Controls Monitored 51,451, Controls Passed 40,095 (+4.5%), Control Pass Rate 77.9%, Open Findings 5,787 (−20.4%) and Findings / Deployment 11.6 (−21.9%). Open Findings and Control Pass Rate by Framework shows ISO 27001 carrying the largest finding count at a 77.4% pass rate while HIPAA sits at 82.1% with the fewest. Open Findings by Tool Category and Deployment Type is a matrix — Policy Management 1,310 total (770 Cloud, 333 Hybrid, 207 On-Premise), Risk Management 1,227, Audit Automation 866, Data Privacy 864, Regulatory Reporting 767 and Vendor Risk 753. Control Testing by Framework lists controls monitored, pass rate and open findings for each of the six regimes, from ISO 27001 at 12,374 controls down to HIPAA at 5,609.
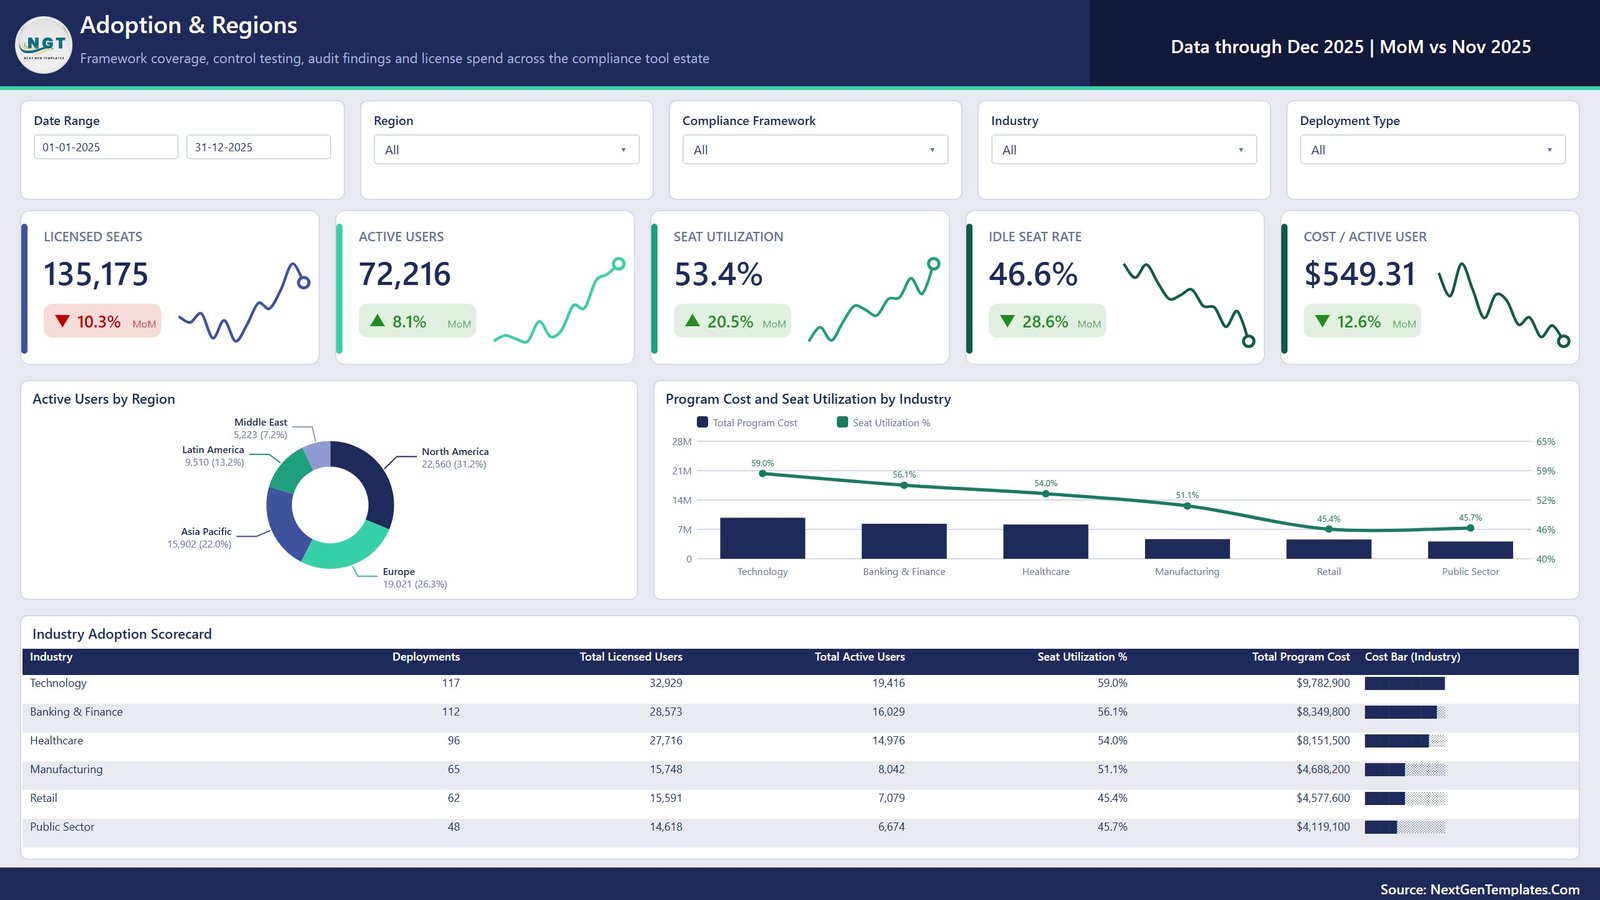
Page 5 — Adoption & Regions. The licence-waste page. Cards: Licensed Seats 135,175 (−10.3%), Active Users 72,216 (+8.1%), Seat Utilization 53.4% (+20.5%), Idle Seat Rate 46.6% (−28.6%) and Cost / Active User $549.31 (−12.6%). Active Users by Region splits North America 22,560 (31.2%), Europe 19,021 (26.3%), Asia Pacific 15,902 (22.0%), Latin America 9,510 (13.2%) and Middle East 5,223 (7.2%). Program Cost and Seat Utilization by Industry pairs spend against usage, showing Technology at 59.0% utilisation against Retail at 45.4%. The Industry Adoption Scorecard closes the report with deployments, licensed users, active users, seat utilisation and total cost for all six industries.
Digital Compliance Tools Dashboard in Power BI vs. Excel vs. Paid GRC Platforms — Where This Fits
| This Power BI Dashboard | Excel Dashboard | Paid GRC Platform (e.g. ServiceNow GRC, LogicGate) | |
|---|---|---|---|
| Cost | $17.99 one time | $17.99 one time | $1,000–$8,000 per month, often per seat |
| Platform | Power BI Desktop (free) + optional Power BI Service | Excel 2016+, Microsoft 365, Excel for Mac | Vendor cloud only |
| Setup time | 10–20 minutes to repoint the data source | 10 minutes to paste and refresh | 3–9 months implementation |
| Multi-framework view (ISO / SOC 2 / GDPR / SOX / HIPAA / PCI DSS) | Built in — six frameworks scored side by side | Built in | Yes, usually per-module licensing |
| Licence and seat-waste analysis | Built in — utilisation, idle rate and cost per active user | Built in | Rarely — this is a procurement question, not a GRC one |
| Control testing workflow | No — reporting layer only | No | Yes, with evidence collection and sign-off |
| Real-time team collaboration | Yes, when published to a Power BI workspace | Via OneDrive / SharePoint co-authoring | Yes, built in |
| Mobile access | Power BI mobile app | Excel mobile, limited interactivity | Native apps |
| Customisable fields | Full — edit the model, measures and visuals | Full — edit sheets and pivots | Limited to vendor configuration |
| Year-1 cost at 5 users | $17.99 (add $14/user/month only if you publish to Pro) | $17.99 | $60,000–$480,000 |
| Automated evidence capture / auditor portal | No | No | Yes |
Read the plain-English version of this comparison in the Digital Compliance Tools Dashboard in Power BI walkthrough on our blog.
Who This Template Is For — and Who It’s Not For
It is for GRC and compliance leads who have bought more tools than they can defend at renewal and need one view of spend against control coverage; IT and security operations managers reporting framework readiness to an audit committee; procurement and vendor-management teams looking for idle seats before a contract renews; internal auditors who want a coverage and findings picture per framework; and Power BI consultants who need a credible compliance-tooling model to adapt for a client instead of starting from an empty canvas.
It is not for anyone wanting an operational GRC system — there is no control-testing workflow, no evidence repository, no policy attestation engine and no auditor portal you can write back to. It does not connect live to ServiceNow, Vanta, Drata or any other platform; you export from them and load the extract here. And it will not fit if your inventory is a single tool for a single framework, because most of the value in this file comes from comparing six frameworks, six tool categories and six industries against each other. This is a reporting layer on top of your compliance stack, not a replacement for it.
How to Use the Digital Compliance Tools Dashboard in Power BI
- Install Power BI Desktop if you do not already have it — it is free from Microsoft and runs on Windows.
- Unzip the download and open
Digital Compliance Tools Dashboard in Power BI.pbix. Read the included user manual PDF first if this is your first NGT Power BI file. - Open
Data.xlsxand look at theDatasheet. It has 18 columns: Deployment ID, Date, Tool Name, Tool Category, Compliance Framework, Industry, Region, Deployment Type, Implementation Status, License Cost, Implementation Cost, Licensed Users, Active Users, Controls Monitored, Controls Passed, Open Findings, Audit Hours Saved and Satisfaction Score. - Replace the 500 sample rows with your own tool inventory, keeping the column headers exactly as they are. Any number of rows works, and the six category, framework and industry values can be renamed to yours.
- Point the model at your file — in Power BI, Transform data → Data source settings → Change Source, then Close & Apply. Every card, chart and scorecard repopulates.
- Change the currency if you do not report in dollars: select each cost measure in the Data pane and set its format string to £, €, ₹ or anything else. No formulas change.
- Filter and read. Start on Overview with all slicers on All, then use Adoption & Regions to find where seat utilisation is worst, and Controls & Findings to check whether the cheap tools are the ones generating the backlog.
Real-World Use Cases
Anita, head of GRC at a 4,000-seat financial services group. Her CFO asks why compliance tooling costs $39.67M a year. She opens Adoption & Regions, points at 135,175 licensed seats against 72,216 active users, and takes a 46.6% idle-seat number into the renewal instead of a spreadsheet argument.
Rahul, IT security manager preparing for a SOC 2 Type II. The Controls & Findings page tells him SOC 2 is testing 10,297 controls at a 76.5% pass rate with 1,204 findings open. The matrix shows most of them sitting in Policy Management on Cloud deployments, so he knows which owner to chase first rather than reading a 200-row export.
Sofia, a freelance Power BI consultant. A regtech client briefs her on a compliance-spend report with a three-week deadline. She opens this file, swaps the source, renames Tool Category to Product Line, and delivers a working model in the first week — then spends the rest of the time on the client’s real data-quality problem.
Frequently Asked Questions
Do I need a paid Power BI licence to use this?
No. Power BI Desktop is free and opens, edits and refreshes the file completely. A Power BI Pro licence is only needed if you want to publish the report to a workspace and share it with colleagues through the Power BI Service.
Does it work on a Mac?
Power BI Desktop is Windows-only, so you would need Windows, a virtual machine or a cloud desktop. If you work on a Mac, the Digital Compliance Tools Dashboard in Excel covers the same subject in Excel, which runs natively on macOS.
Does it connect to ServiceNow, Vanta or Drata?
Not directly. This is a reporting layer over an extract: you export your tool inventory and control-testing results into the 18-column Data sheet and refresh. If you already have those systems in a warehouse, you can repoint the Power Query source at the warehouse table instead of the workbook and keep everything else.
Can I change the currency from dollars?
Yes. The sample data is formatted in $. Select any cost measure in the Data pane, open the Measure tools ribbon and change the format string to £, € or ₹. No formulas change.
What if my inventory does not have all 18 columns?
Add the missing columns as empty ones so the model loads, then hide the visuals that depend on them. The columns you genuinely cannot do without are Date, Tool Name, Compliance Framework, License Cost, Licensed Users, Active Users, Controls Monitored, Controls Passed and Open Findings — those drive most of the 25 KPI cards.
Is this the same as a KPI dashboard or KPI scorecard version?
No. This is an analytical dashboard — five pages of slicer-driven charts over a deployment-level table, built for exploration. NextGenTemplates also publishes KPI Dashboards and KPI Scorecards, which are month-picker templates with traffic lights and target-versus-actual variance built for a monthly pack. They are different templates, and many teams keep one of each: the scorecard for the board, this for the drill-down.
Can I resell or reuse it in client work?
You may use and adapt it for your own organisation or for client deliverables. You may not resell or redistribute the template itself as a template.
About the Author
Built by PK – Microsoft Certified Professional with 15+ years of Excel, Google Sheets, and Power BI experience. Founder of NextGenTemplates, reaching 300K+ subscribers across YouTube channels. Every template is hand-built and tested before release.
Explore Related Templates
- Digital Compliance Tools Dashboard in Excel — the same subject built as an Excel pivot dashboard, for teams without Power BI.
- Risk Management Dashboard in Power BI — the risk register side of the same governance story.
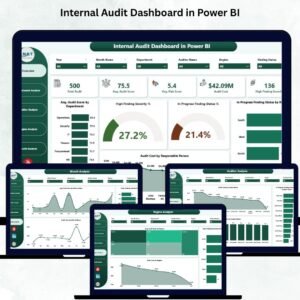
- Internal Audit Dashboard in Power BI — audit plan coverage, findings and remediation ageing.
- Cybersecurity Dashboard in Power BI — incidents, vulnerabilities and control posture.
- Digital Identity Platforms Dashboard in Power BI — the identity half of the same tool estate.
- IT Help Desk Dashboard in Power BI — service desk volumes, SLA and resolution times.
- Browse every Power BI Dashboard template or the wider Power BI category.
Download the Digital Compliance Tools Dashboard in Power BI today for $17.99 instead of $29.99, open it in the free Power BI Desktop, point it at your own tool inventory and walk into your next renewal meeting with the seat-utilisation number already on a slide. One-time payment, instant download, lifetime access, user manual included.
Last updated: 2 September 2026.
Watch the demo video:
Compatibility and Requirements
- Works in Power BI Desktop, which is free from Microsoft. Power BI Desktop runs on Windows. See Get Power BI Desktop.
- Publishing the report to a workspace to share with colleagues needs a Power BI Pro licence. Opening, editing and refreshing the file does not.
- The download is a .zip with the .pbix file, the Data.xlsx source and a user manual PDF.



























Reviews
There are no reviews yet.