


Digital Identity Platforms Dashboard in Power BI helps identity, compliance, fintech, SaaS, onboarding, and trust teams monitor verification activity across 5 report pages, 5 executive KPI cards, and multiple chart views. Instead of stitching together exports from every identity provider, this ready-made Power BI dashboard tracks Total Verification Requests, Total Platform Fees, Total Cost, Successful Verifications, Gross Profit, risk tier, provider, region, industry, status, integration channel, and month-level trends in one editable .pbix file. Instant download. One-time payment. No template subscription.
Key Features of Digital Identity Platforms Dashboard in Power BI
- 5 Power BI report pages: Overview Page, Volume Trends, Risk Analysis, Channel Health, and Provider Score.
- 5 KPI cards: Total Verification Requests, Total Platform Fees, Total Cost, Successful Verifications, and Gross Profit.
- Identity verification analysis: Review request volume, success, cost, platform fees, provider performance, and margin.
- Risk monitoring: Compare cost, gross margin, verification status, identity risk score, and risk tier patterns.
- Channel and provider views: Analyze integration channels, regions, providers, quarters, and status groups.
- Editable Power BI file: Update data sources, visuals, measures, colors, labels, and layouts in Power BI Desktop.
What’s Inside the Digital Identity Platforms Dashboard in Power BI
1. Overview Page
The Overview Page gives leaders a fast snapshot of the identity verification operation. The top cards show Total Verification Requests, Total Platform Fees, Total Cost, Successful Verifications, and Gross Profit so teams can review scale, revenue, spend, successful checks, and commercial return at a glance.
Gross Margin by Overall Performance shows whether verification economics are improving or weakening across the selected data. Total Verification Requests by Status explains workload distribution across completed, failed, pending, or review-related states. Total Verification Requests by Industry highlights which customer segments create the most verification volume. Total Platform Fees by Month Name tracks monthly fee movement for finance and operations review.

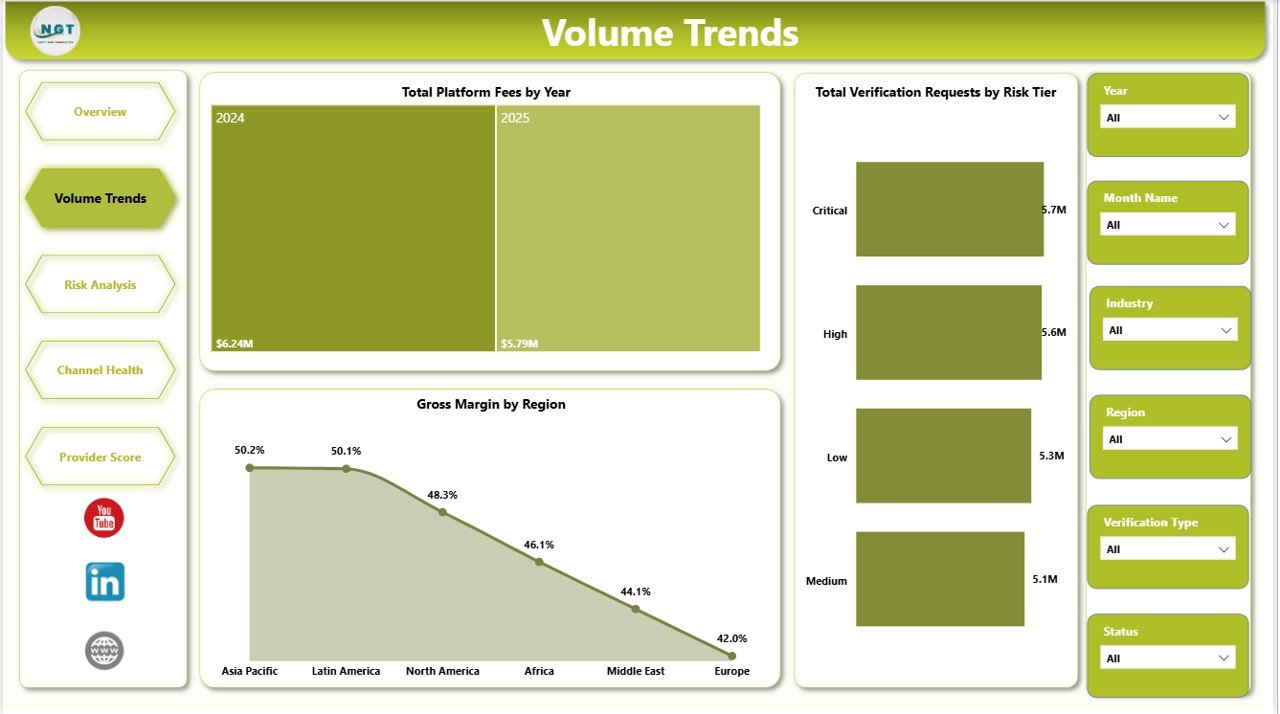
2. Volume Trends
The Volume Trends page helps teams understand how verification scale changes over time and across operating dimensions. Total Platform Fees by Year gives a long-term fee view, Gross Margin by Region compares profitability by market, and Total Verification Requests by Risk Tier shows how much demand comes from low, medium, or high-risk verification groups.
3. Risk Analysis
The Risk Analysis page is built for compliance, fraud, and trust teams. Total Cost by Risk Tier shows where verification spend is concentrated, Gross Margin by Status connects status outcomes with profitability, and Average Identity Risk Score by Industry helps compare industry-level identity risk exposure.

4. Channel Health
The Channel Health page compares performance across integration paths, regions, and providers. Total Verification Requests by Integration Channel shows where request volume enters the system, Successful Verifications by Region identifies regional success patterns, and Total Platform Fees by Provider supports provider cost and commercial review.

5. Provider Score
The Provider Score page is designed for vendor and performance comparison. Gross Profit by Provider shows which identity vendors generate stronger return, Total Verification Requests by Quarter reveals seasonal request movement, and Successful Verifications by Provider helps compare provider quality.

Digital Identity Platforms Dashboard in Power BI vs. Tableau vs. Paid Identity SaaS – Where This Fits
| Feature | This Power BI Dashboard | Tableau Alternative | Paid Identity SaaS |
|---|---|---|---|
| Cost | $17.99 one-time | License plus build cost | Monthly or annual subscription |
| Platform | Power BI Desktop | Tableau Desktop or Cloud | Vendor-hosted platform |
| Setup time | Open .pbix and replace or connect data | Build model and visuals | Implementation and configuration |
| Customizable fields | Editable report and model | Editable with Tableau skills | Limited by vendor reporting options |
| Provider score analysis | Built in | Must be designed | Depends on provider plan |
| Year-1 cost at 5 users | $17.99 plus any Microsoft licensing | Often much higher | Often hundreds or thousands |
Who This Template Is For – and Who It’s Not For
This template is for digital identity platforms, KYC teams, fintech operators, compliance analysts, fraud teams, marketplace onboarding teams, trust and safety managers, SaaS operations teams, and business analysts who need an interactive Power BI reporting layer for verification data. It is not an identity verification engine, fraud decisioning API, AML system, CRM, or live customer onboarding workflow.
How to Use the Digital Identity Platforms Dashboard in Power BI
- Download and unzip the product file.
- Open the .pbix file in Power BI Desktop.
- Review the sample data structure and replace it with your approved identity verification data.
- Refresh the report and validate KPI totals.
- Use slicers to filter by provider, region, risk tier, status, industry, channel, month, quarter, or year.
- Publish to Power BI Service only after checking your organization’s data privacy and sharing rules.
Real-World Use Cases
Aisha, fintech operations lead: Aisha reviews the Overview and Risk Analysis pages before weekly onboarding meetings to explain request volume, successful verifications, cost, margin, and high-risk segments.
Daniel, identity product manager: Daniel uses Provider Score to compare gross profit and successful verifications by provider before vendor performance discussions.
Meera, compliance analyst: Meera uses Volume Trends and Channel Health to prepare region, risk tier, and channel summaries for internal compliance reviews.
Frequently Asked Questions
What does this dashboard track?
It tracks verification requests, platform fees, cost, successful verifications, gross profit, gross margin, status, industry, month, year, region, risk tier, integration channel, provider, quarter, and average identity risk score.
Do I need Power BI Desktop?
Yes. The .pbix file is intended to be opened and edited in Power BI Desktop.
Can I customize the report?
Yes. You can edit visuals, measures, fields, colors, labels, page layouts, and data source connections.
Does it connect live to identity APIs?
No live API connector is included. Use approved exported data or connect your own source inside Power BI.
Can this replace my identity provider?
No. This is a reporting dashboard, not an identity verification service, KYC workflow, or fraud decision engine.
Can I publish it to Power BI Service?
Yes, if your Microsoft account and organization permissions allow it. Review privacy and access rules before sharing.
About the Author
Built by PK – Microsoft Certified Professional with 15+ years of Excel, Google Sheets, and Power BI experience. Founder of NextGenTemplates, reaching 300K+ subscribers across YouTube channels. Every template is hand-built and tested before release.
Explore Related Templates
You may also like Digital Identity Platforms Dashboard in Excel, IT and Cybersecurity Operations Bundle, and Cybersecurity Report in Excel. Browse more Power BI templates and Power BI dashboard templates.
Download the Digital Identity Platforms Dashboard in Power BI today and turn identity verification data into clear, interactive reporting.
Last updated: June 2026
Watch the step-by-step video tutorial:


Reviews
There are no reviews yet.