

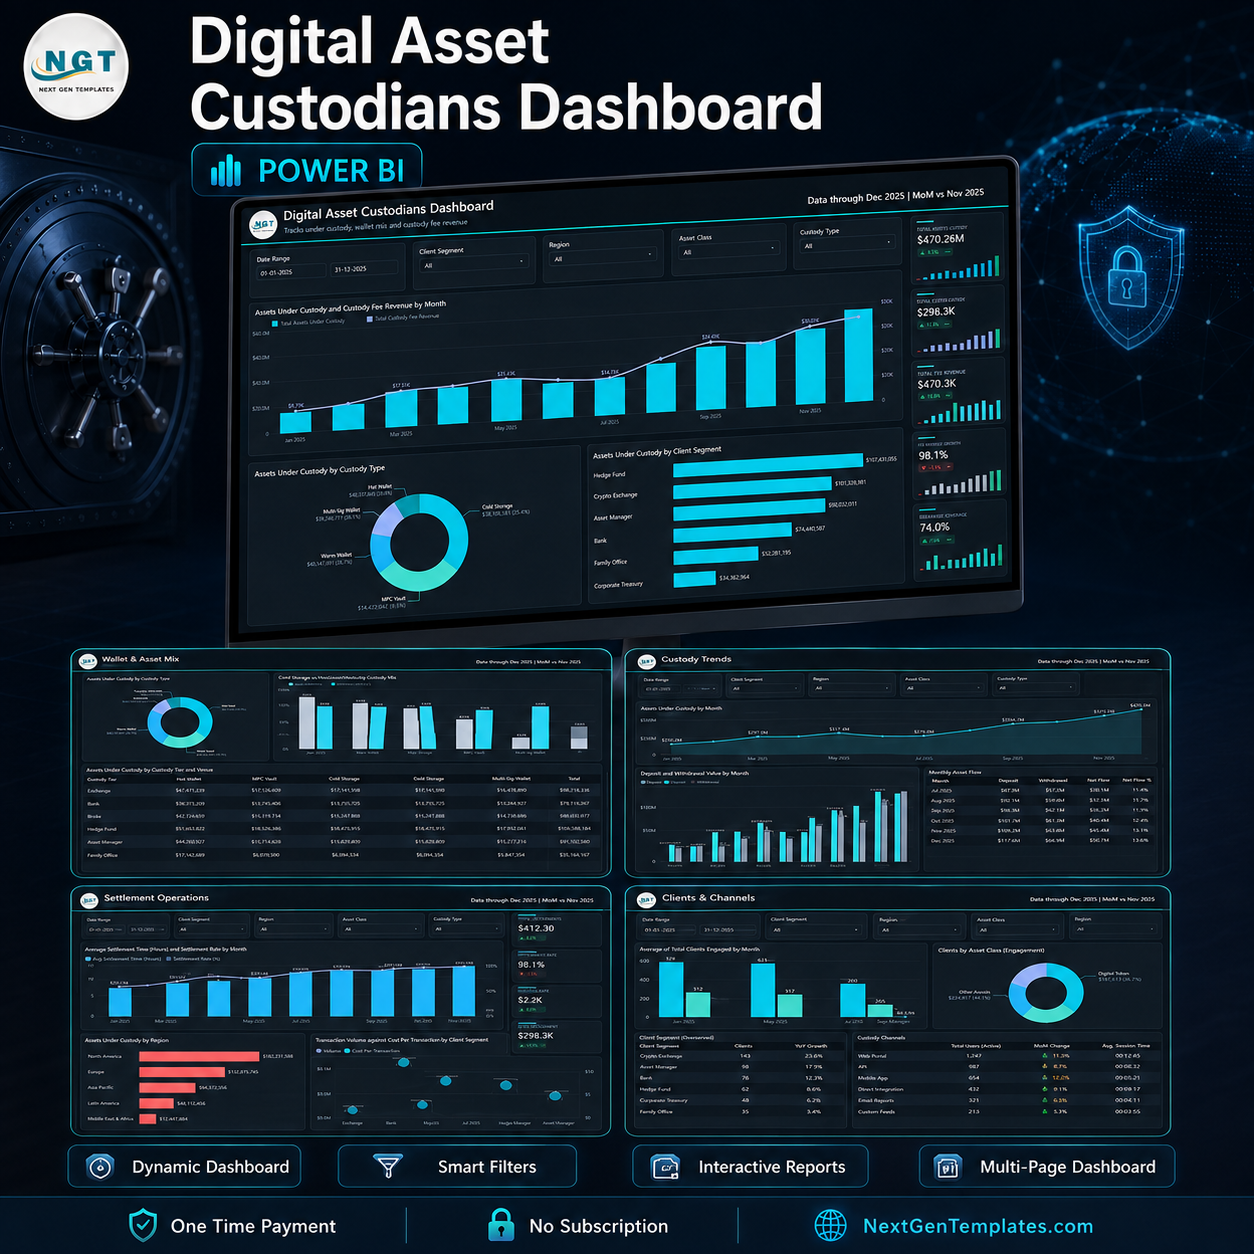

The Digital Asset Custodians Dashboard in Power BI reads one flat custody log back as 5 report pages, 15 KPI cards with month-on-month deltas, 14 charts and tables, and 5 synced slicers on every page. It ships as a .pbix file with 500 rows of sample custody records across 21 fields, so it opens finished – swap in your own export and every measure follows.
Read this first. This is a reporting file. It does not connect to any blockchain, wallet, exchange, custodian platform or price feed, it holds no keys, and it moves nothing. Every number quoted below is fictional sample data that you replace. Nothing here is investment, tax, legal or regulatory advice, and the file gives you no audit, licensing, insurance or proof-of-reserves standing of any kind.
🌍 Join 8,400+ teams in 40+ countries using NextGenTemplates to replace paid SaaS tools with one-time-purchase Excel, Google Sheets, Power BI, and HTML templates.
✅ Instant download · One-time payment · No subscription · No per-user fees · Lifetime access
🔑 Key Features of the Digital Asset Custodians Dashboard in Power BI
🔹 Five analysis pages, one model. Overview, Custody Trends, Wallet & Asset Mix, Settlement Operations and Clients & Channels all sit on the same import table, so a figure on one page cannot disagree with the same figure on another. A hidden Details page is wired as a drillthrough to the underlying custody records.
🔹 Fifteen KPI cards with MoM deltas and sparklines. Assets Under Custody, Custody Fee Revenue, Transactions Processed, Settlement Rate, Insurance Coverage, Deposit Value, Withdrawal Value, Total Revenue, Custody Margin, Cold Storage Share, Custody Accounts, Avg Client Tenure, Operating Cost and Avg Service Rating. Each card carries the month-on-month change against the prior month and a twelve-point sparkline.
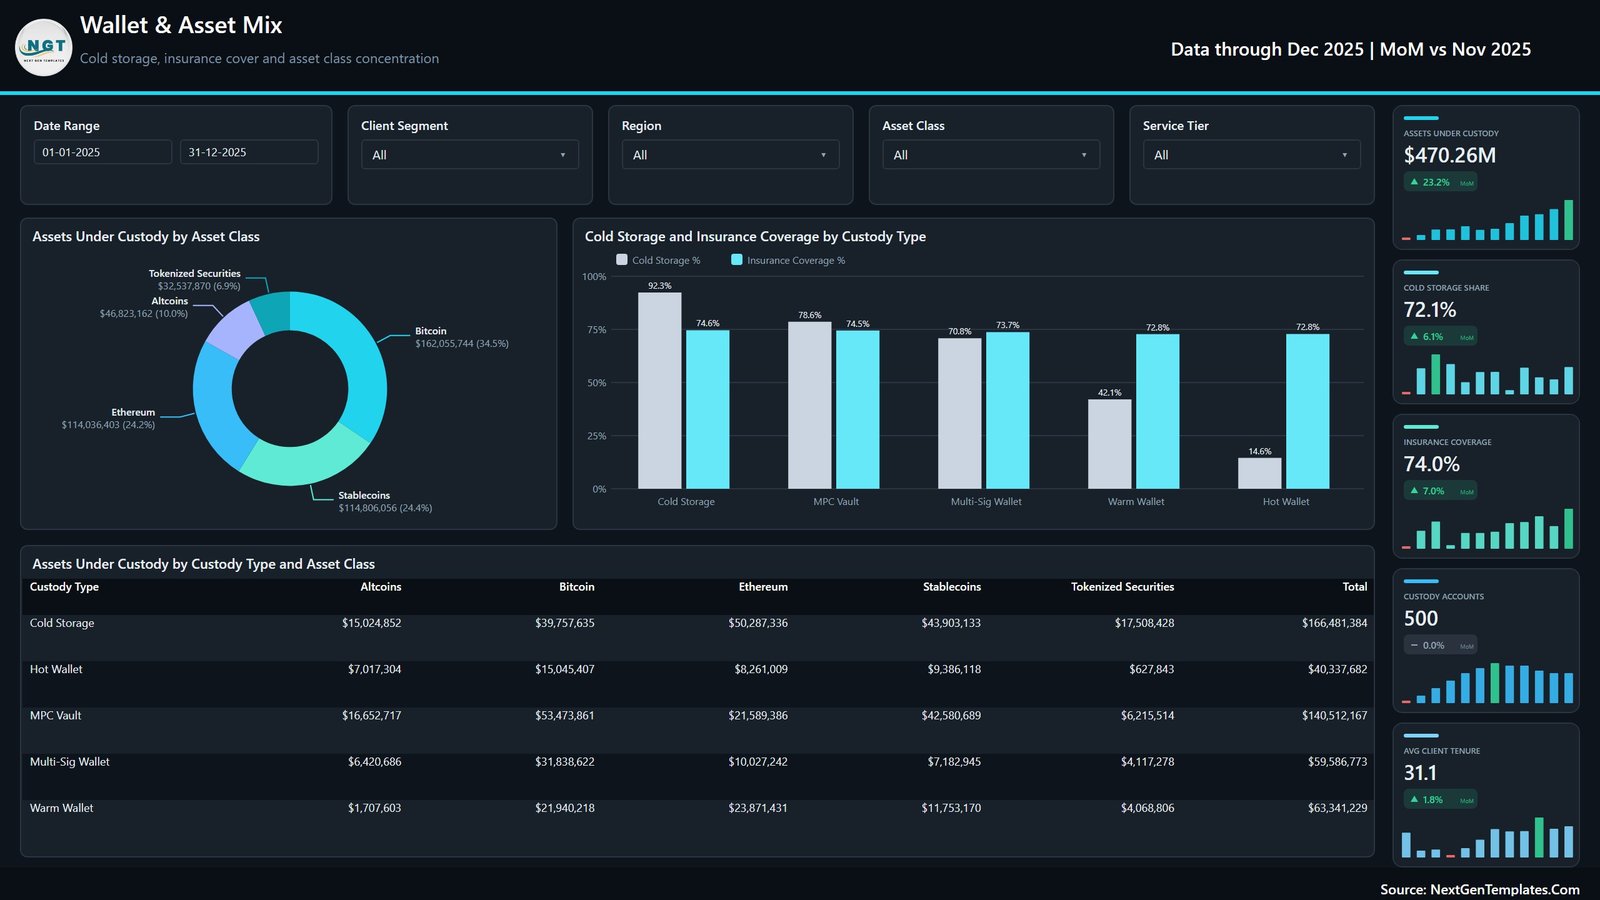
🔹 Cold storage share is a first-class measure, not a footnote. The Wallet & Asset Mix page reports cold storage share by custody type beside insurance coverage, so a wallet class with a thin cold-storage split is visible immediately instead of being averaged away. On the sample data cold storage share reads 72.1% overall and ranges from 92.3% on Cold Storage to 14.6% on Hot Wallet.
🔹 Cost sits next to revenue. Operating Cost is a real column in the model, so Custody Margin, Net Custody Margin by service tier and cost per transaction by client segment are calculated figures rather than estimates. That is the difference between a balances report and a P&L view.
🔹 Five synced slicers per page. Date Range, Client Segment, Region and Asset Class are on every page, with a fifth that changes to suit the page – Custody Type on Overview, Service Tier on Trends and Wallet Mix, Account Status on Settlement, Onboarding Channel on Clients.
🔹 Twenty-one fields, all renameable. The model covers Client Segment, Region, Asset Class, Custody Type, Service Tier, Onboarding Channel, Account Status, Assets Under Custody, Insured Value, Cold Storage Value, Deposit Value, Withdrawal Value, Custody Fee Revenue, Staking Revenue, Operating Cost, Transactions Processed, Settled Transactions, Tenure Months and Service Rating.
🔹 A standard Power BI project. No custom visuals, no external dependencies, no gateway. Open it in Power BI Desktop, point the query at your own file, recolour the theme, rename the pages.
📦 What’s Inside the Digital Asset Custodians Dashboard in Power BI
Page 1: Overview
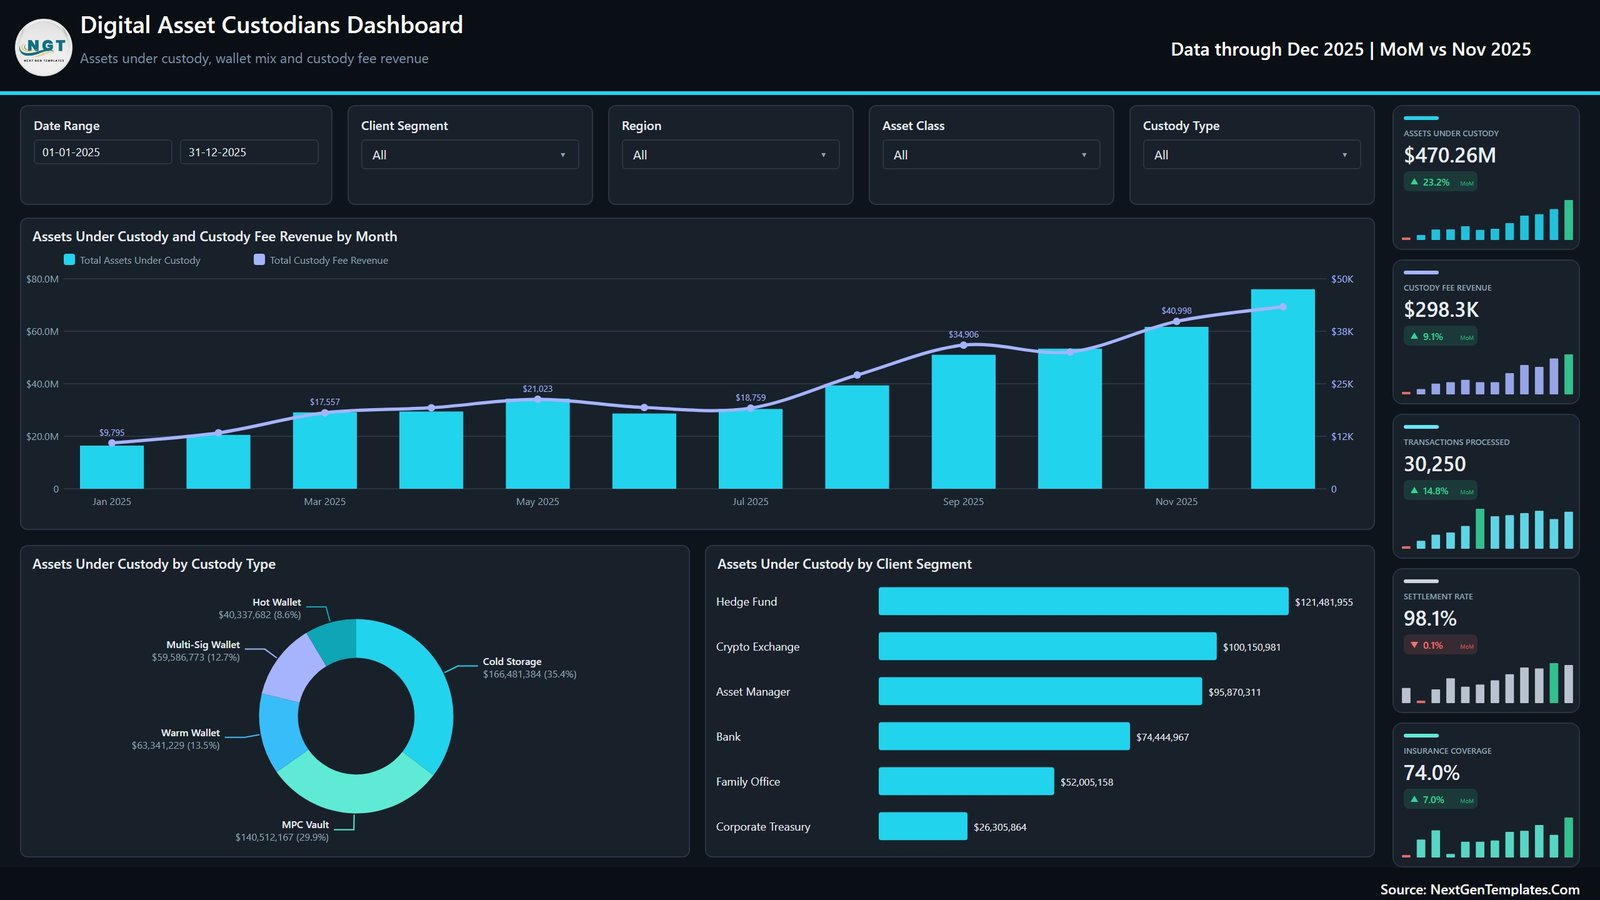
The headline page. KPI cards show Assets Under Custody $470.26M, Custody Fee Revenue $298.3K, Transactions Processed 30,250, Settlement Rate 98.1% and Insurance Coverage 74.0%, each with its month-on-month delta. Charts are Assets Under Custody and Custody Fee Revenue by Month, Assets Under Custody by Custody Type, and Assets Under Custody by Client Segment.
Page 2: Custody Trends
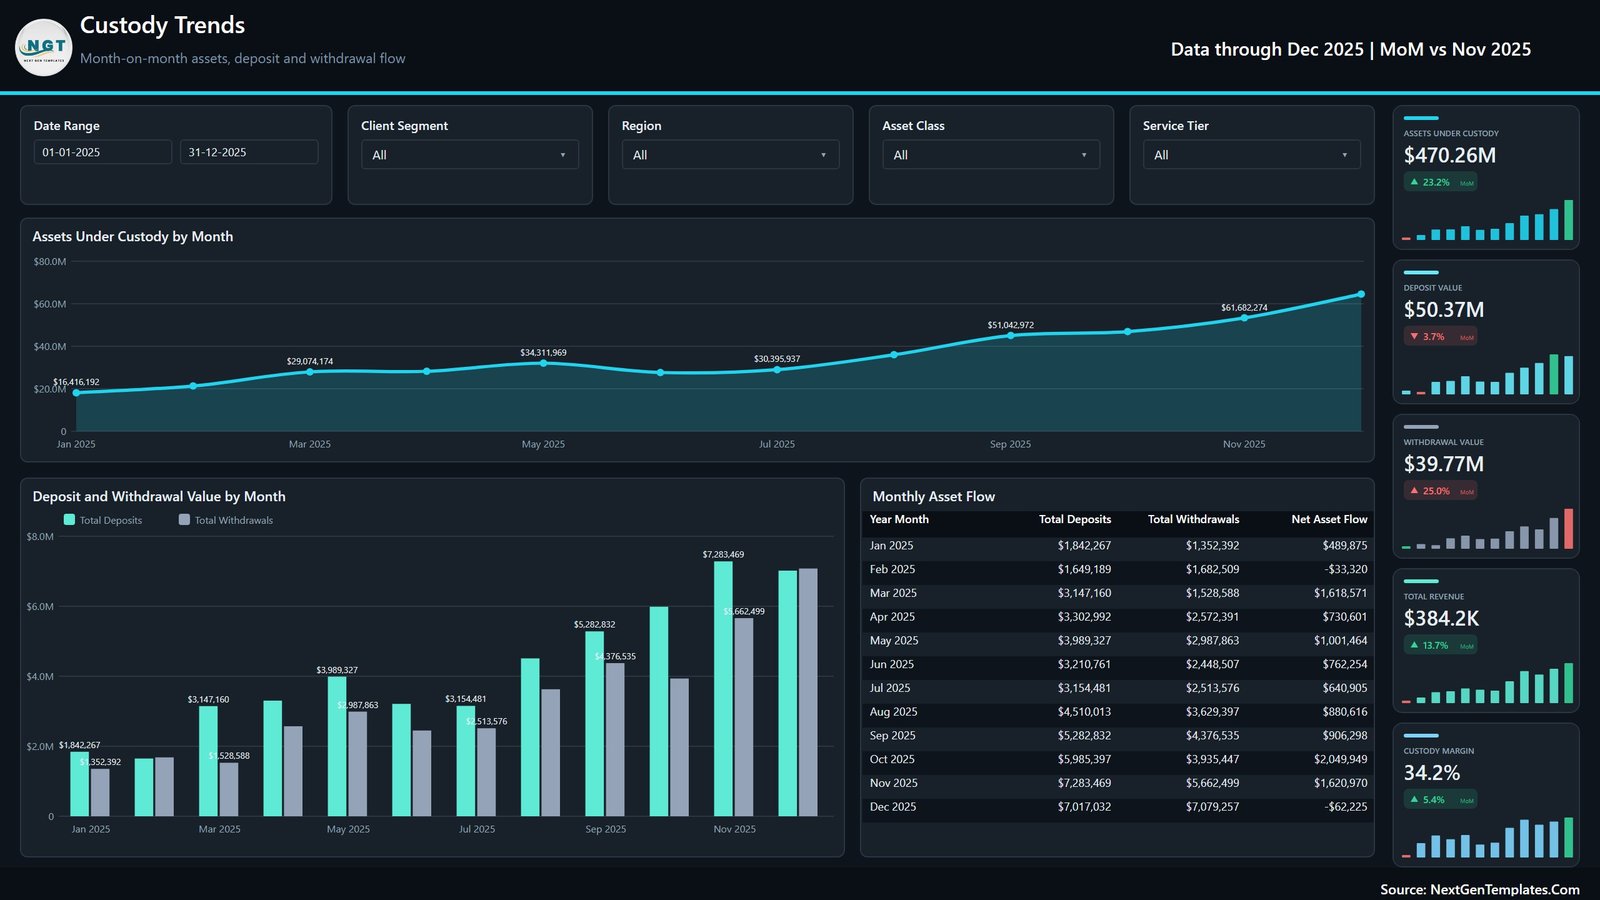
The flow page. Cards cover Deposit Value $50.37M, Withdrawal Value $39.77M, Total Revenue $384.2K and Custody Margin 34.2%. Charts are Assets Under Custody by Month, Deposit and Withdrawal Value by Month, and a Monthly Asset Flow table listing total deposits, total withdrawals and net asset flow for each of the twelve months.
Page 3: Wallet & Asset Mix
The concentration page. Cards show Cold Storage Share 72.1%, Insurance Coverage 74.0%, Custody Accounts 500 and Avg Client Tenure 31.1 months. Charts are Assets Under Custody by Asset Class, Cold Storage and Insurance Coverage by Custody Type, and a matrix of Assets Under Custody by Custody Type and Asset Class.
Page 4: Settlement Operations
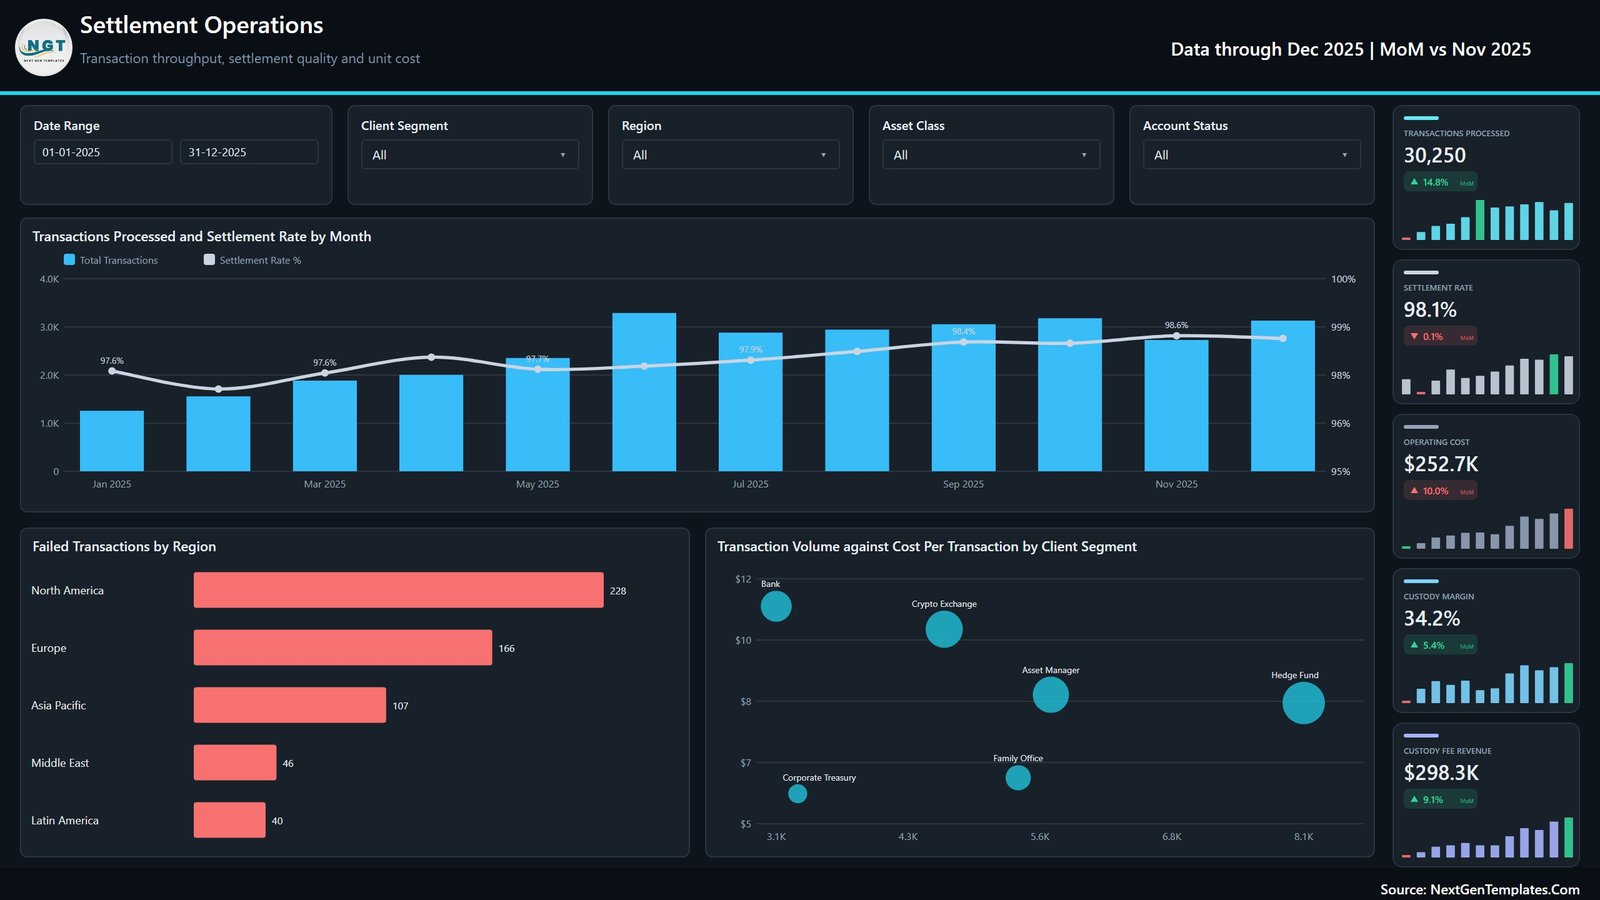
The operational quality page. Cards cover Transactions Processed 30,250, Settlement Rate 98.1%, Operating Cost $252.7K, Custody Margin 34.2% and Custody Fee Revenue $298.3K. Charts are Transactions Processed and Settlement Rate by Month, Failed Transactions by Region, and Transaction Volume against Cost Per Transaction by Client Segment.
Page 5: Clients & Channels
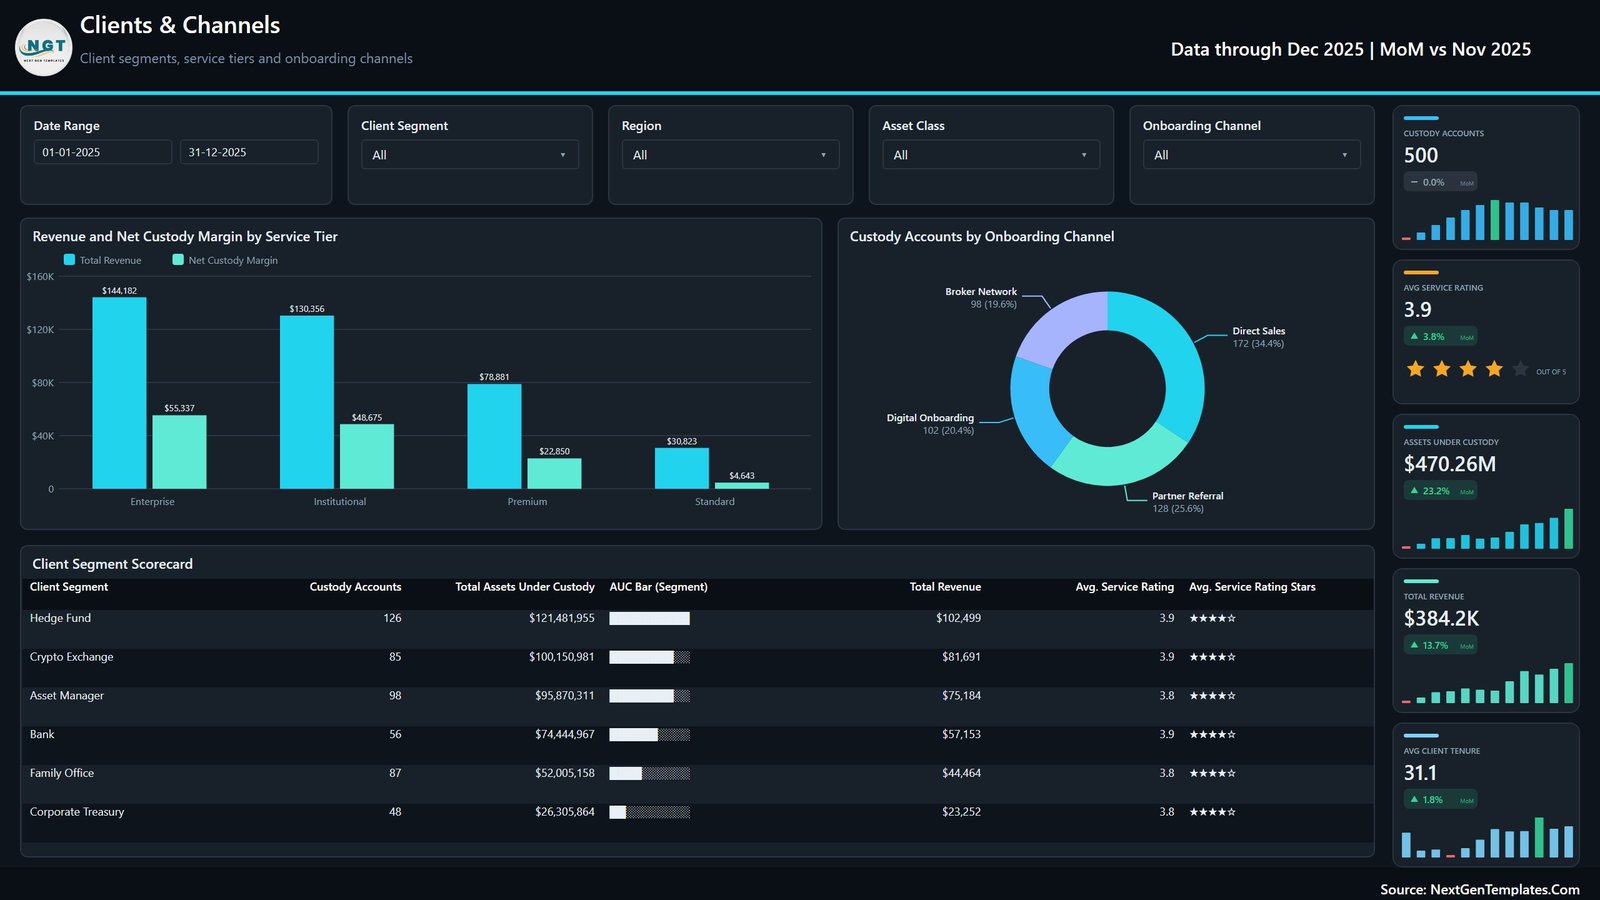
The commercial page. Cards show Custody Accounts 500, Avg Service Rating 3.9 out of 5, Assets Under Custody, Total Revenue and Avg Client Tenure. Charts are Revenue and Net Custody Margin by Service Tier, Custody Accounts by Onboarding Channel, and a Client Segment Scorecard listing accounts, assets, revenue and service rating for each of the six segments.
Page 6: Get More Dashboards
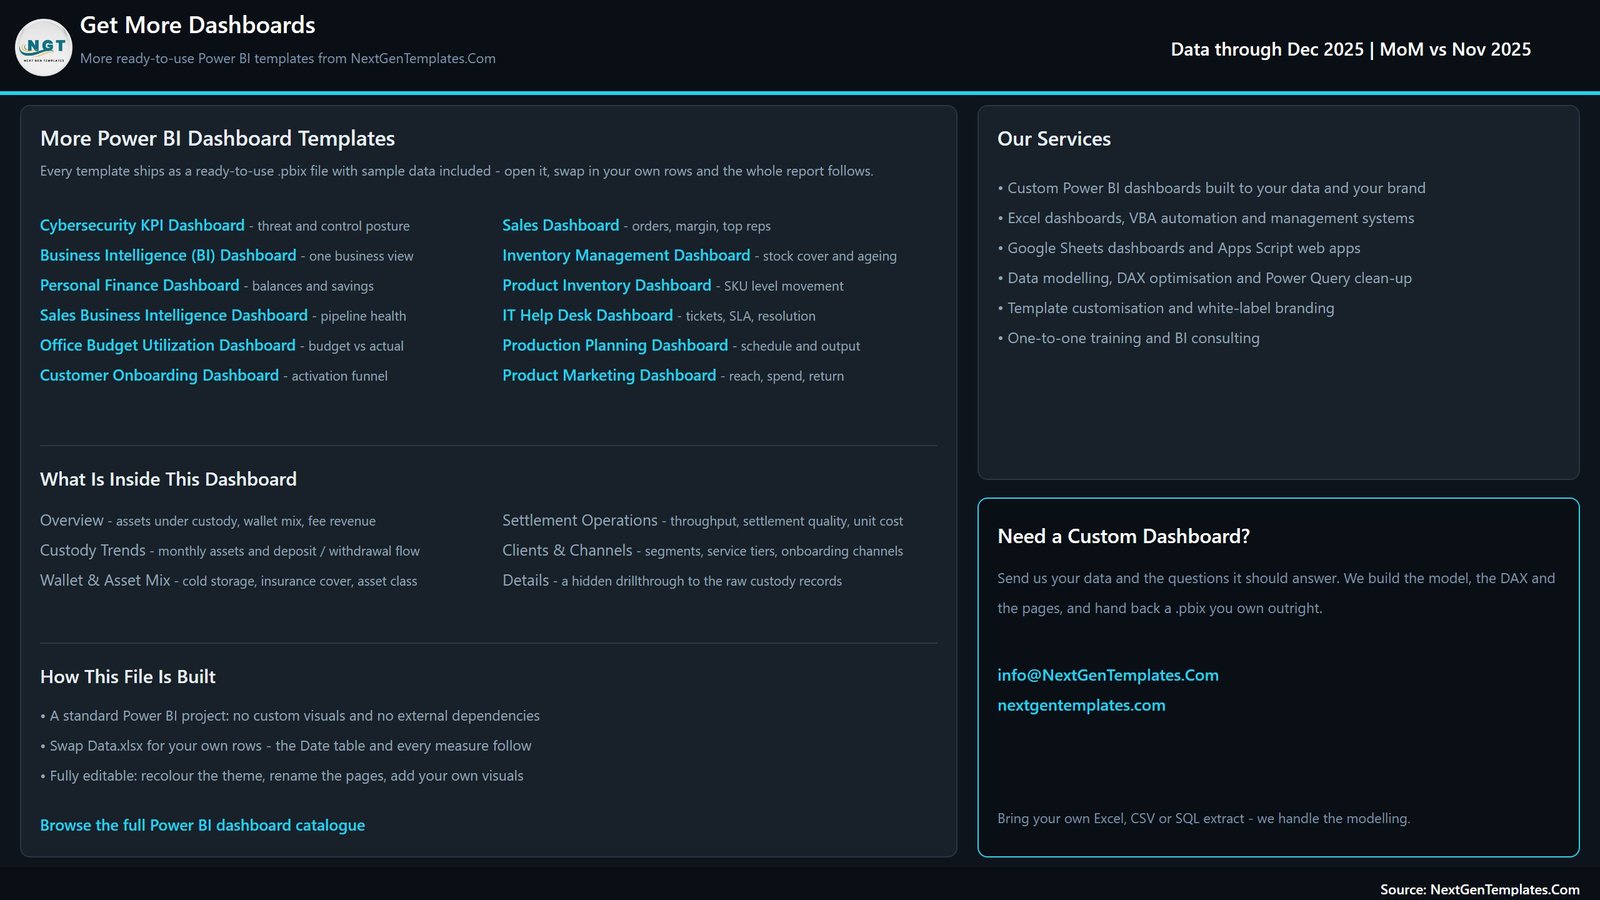
A reference page listing what is inside the file, how the project is built, and the rest of the Power BI catalogue. Delete it before you circulate the report internally.
📊 Digital Asset Custodians Dashboard in Power BI vs. Tableau / Qlik vs. Your Custody Platform’s Reports – Where This Fits
| Feature | Digital Asset Custodians Dashboard in Power BI | Tableau / Qlik build | Custody platform reporting |
|---|---|---|---|
| Cost | $17.99 one-time ✅ | $70-115 / user / month plus build time | Bundled into platform fees |
| Platform | Power BI Desktop, free from Microsoft ✅ | Paid licence per creator | Vendor web portal |
| Setup time | Swap the source file, refresh ✅ | Days of modelling and layout | Already there, but fixed |
| Several custodians in one view | Yes – one row per record, any source ✅ | Yes, if you build it | No |
| Live balances | No – you export and refresh | Only with a connector you build | Yes ✅ |
| Cold storage share by wallet type | Built in, on two pages ✅ | You would build it | Varies by vendor |
| Operating cost beside revenue | Yes, a real column ✅ | You would build it | Rarely |
| Rename fields | All 21 columns ✅ | Yes | Fixed schema |
| Year-1 cost at 5 users | $17.99 total ✅ | $4,200-6,900 | Included, not separable |
For custody and fund-servicing teams that want a board-ready monthly view without a per-seat BI licence, the Digital Asset Custodians Dashboard in Power BI sits in the sweet spot.
👥 Who This Template Is For – and Who It’s Not For
✅ This template is built for:
- Digital asset custodians and trust companies producing a monthly client or board pack from an export
- Crypto exchanges and brokers with a custody arm that already report balances, flows and fees separately
- Fund administrators and asset servicers covering tokenised holdings alongside traditional books
- Finance and operations analysts who rebuild the same custody charts by hand every cycle
- Consultants and BI teams who want a working, editable .pbix to start from rather than a blank canvas
❌ This template is NOT for:
- Anyone who needs live wallet, chain, exchange or price data – this file reads a file you supply, nothing else
- Anyone wanting a custody system, a ledger, key management or transaction signing – it is a report, not an application
- Anyone who needs proof-of-reserves attestation, an audit trail of record, or evidence for SOC 2, ISO 27001, MiCA or a qualified-custodian assessment – the file provides none of those and makes no claim to
- Anyone looking for investment guidance, valuations or price forecasts – there are none in the file
- Teams with no export at all; you need a row-level custody log to point it at
⚙️ How to Use the Digital Asset Custodians Dashboard in Power BI
- Unzip the download and open the .pbix in Power BI Desktop, free from Microsoft.
- Open the report and click through all five pages with the sample data, so you know what each measure means.
- Open Data.xlsx from the zip and look at the 21 column headers – that is the shape your own export needs.
- Paste your custody records under those headers, keeping the header row exactly as it is, and save.
- In Power BI Desktop use Transform data to point the query at your file, then Close & Apply.
- Check the KPI cards against a figure you already trust before you circulate anything.
- Rename pages, recolour the theme and delete the Get More Dashboards page for internal use.
💼 Real-World Use Cases
Marta runs client reporting at a 40-person digital asset trust company. Her monthly pack used to be three exports stitched together in a spreadsheet. She now pastes the custody log into the source file, refreshes, and the Overview and Clients & Channels pages become the first two slides of the board deck.
Dev is head of operations at a brokerage with a custody arm. He uses the Settlement Operations page to see failed transactions by region beside cost per transaction by client segment, which is what tells him whether a rising unit cost is a volume problem or a settlement problem.
Priya is a BI consultant working with two custody clients. She starts every engagement from this .pbix, renames the fields to match the client’s schema, and delivers a first working draft in an afternoon rather than a fortnight.
❓ Frequently Asked Questions
Does the Digital Asset Custodians Dashboard in Power BI connect to a blockchain, wallet or exchange?
No. The Digital Asset Custodians Dashboard in Power BI imports a flat file that you supply. It has no chain, wallet, exchange, custodian or price-feed connection, holds no keys and initiates nothing. You export from your own systems and refresh the report.
Are the numbers in the screenshots real?
No. Every figure shown – $470.26M assets under custody, 72.1% cold storage share, 30,250 transactions – comes from the 500 rows of fictional sample data that ship inside the Digital Asset Custodians Dashboard in Power BI. You replace all of it with your own records.
What KPIs does the Digital Asset Custodians Dashboard in Power BI track?
Fifteen: assets under custody, custody fee revenue, transactions processed, settlement rate, insurance coverage, deposit value, withdrawal value, total revenue, custody margin, cold storage share, custody accounts, average client tenure, operating cost, average service rating and net custody margin by tier.
How long does setup take?
Under thirty minutes if your export already has one row per custody record. Match your columns to the 21 headers in the sample file, repoint the query in Power BI Desktop, and Close & Apply. Renaming fields and recolouring the theme takes another short pass.
How does this compare with my custody platform’s built-in reports?
Platform reports are live but fixed, and they only see that platform. The Digital Asset Custodians Dashboard in Power BI is refreshed rather than live, but it takes records from any number of sources, adds operating cost beside revenue, and lets you rename every field.
Does the insurance coverage figure prove my holdings are insured?
No. Insurance coverage in the Digital Asset Custodians Dashboard in Power BI is simply insured value divided by assets under custody, calculated from the Insured Value column you fill in. It is arithmetic on your own data and is not evidence of cover, audit or regulatory standing.
Do I need a Power BI licence?
Not to use it. The Digital Asset Custodians Dashboard in Power BI opens and refreshes in Power BI Desktop, which Microsoft provides free. A Power BI Pro or Premium licence is only needed if you want to publish the report to the Power BI service and share it there.
👤 About the Author
Built by PK – Microsoft Certified Professional with 15+ years of Excel, Google Sheets, and Power BI experience. Founder of NextGenTemplates, reaching 300K+ subscribers across YouTube channels (@PK-AnExcelExpert, @NextGenTemplates, @NeoTechNavigators). Every template is hand-built and tested before release.
🔗 Explore Related Templates
Also available as: the same subject built as a workbook – the Digital Asset Custodians Dashboard in Excel is a five-page Excel companion to this report, for colleagues who do not run Power BI Desktop.
If you cover crypto more broadly, the Crypto Portfolio Dashboard in Power BI reports holdings and allocation rather than custody operations, and the DeFi (Decentralized Finance) Dashboard in Excel covers protocol and liquidity reporting. For adjacent regulated-industry reporting see the Reg Tech Dashboard in Power BI, and browse the full range of Power BI Dashboards.
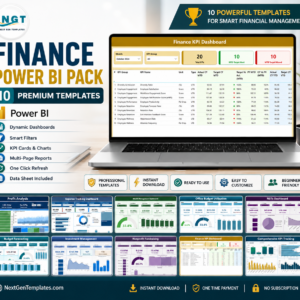
💎 Save more: the Finance Power BI Pack – 10 Premium Templates bundles ten finance reports for less than buying them separately.
Note this is the analytical Power BI Dashboard line – five full analysis pages over a record-level table. It is a different product from the shorter KPI-scorecard line such as the Personal Finance KPI Dashboard in Power BI, which is a month-picker scorecard rather than a multi-page analysis report.
📖 Click here to read the Detailed Blog Post
🎥 Visit our YouTube channel for step-by-step video tutorials
👉 YouTube.com/@NextGenTemplates
📅 Last updated: September 2026
Watch the demo video:
Compatibility and Requirements
- Opens and refreshes in Power BI Desktop, which is free from Microsoft. Power BI Desktop runs on Windows.
- Microsoft explains how to install it in Get Power BI Desktop.
- The report reads a flat file with 21 columns, so you need an export of your own custody records to replace the sample data.



















Reviews
There are no reviews yet.