

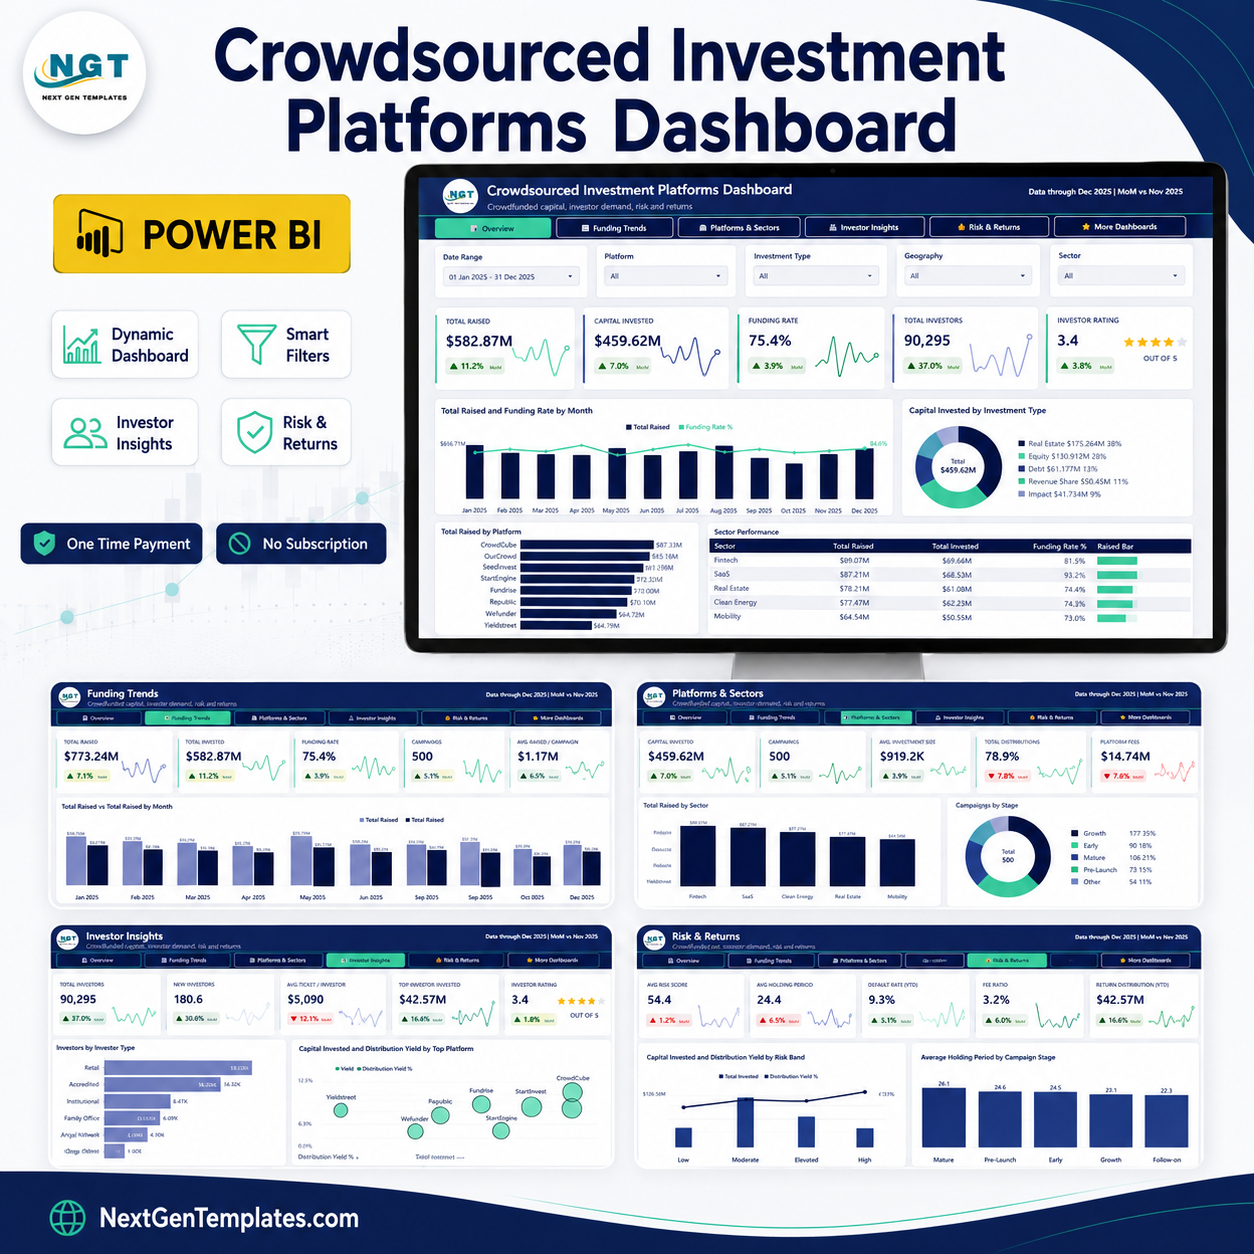

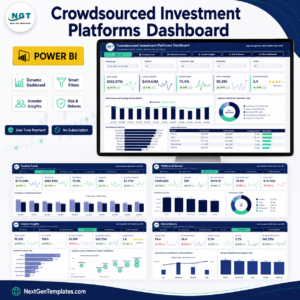
The Crowdsourced Investment Platforms Dashboard in Power BI is a ready-to-open .pbix report that turns raise-by-raise campaign data into a five-page investor and platform review. The sample model ships with 500 campaigns, $582.87M raised against a $773.24M target, 90,295 investors and a 75.4% funding rate, all wired to a full semantic model with a date table and 70+ DAX measures. Five synced slicers sit on every page, drillthrough and tooltip pages are already connected, and nothing is locked. Point the query at your own workbook, refresh, and the whole report follows. One-time payment, no subscription, and support if anything does not work as described.
Key Features of the Crowdsourced Investment Platforms Dashboard
- Five analysis pages – Overview, Funding Trends, Platforms & Sectors, Investor Insights and Risk & Returns, plus a More Dashboards page.
- 25 KPI cards – five per page, each with a month-on-month delta and its own sparkline, so a card tells you the level and the direction at once.
- Five slicers on every page – Date Range, Platform, Investment Type and Geography stay synced across all pages, and the fifth slot changes to suit the page: Sector, Campaign Stage, Funding Status, Investor Type and Risk Band.
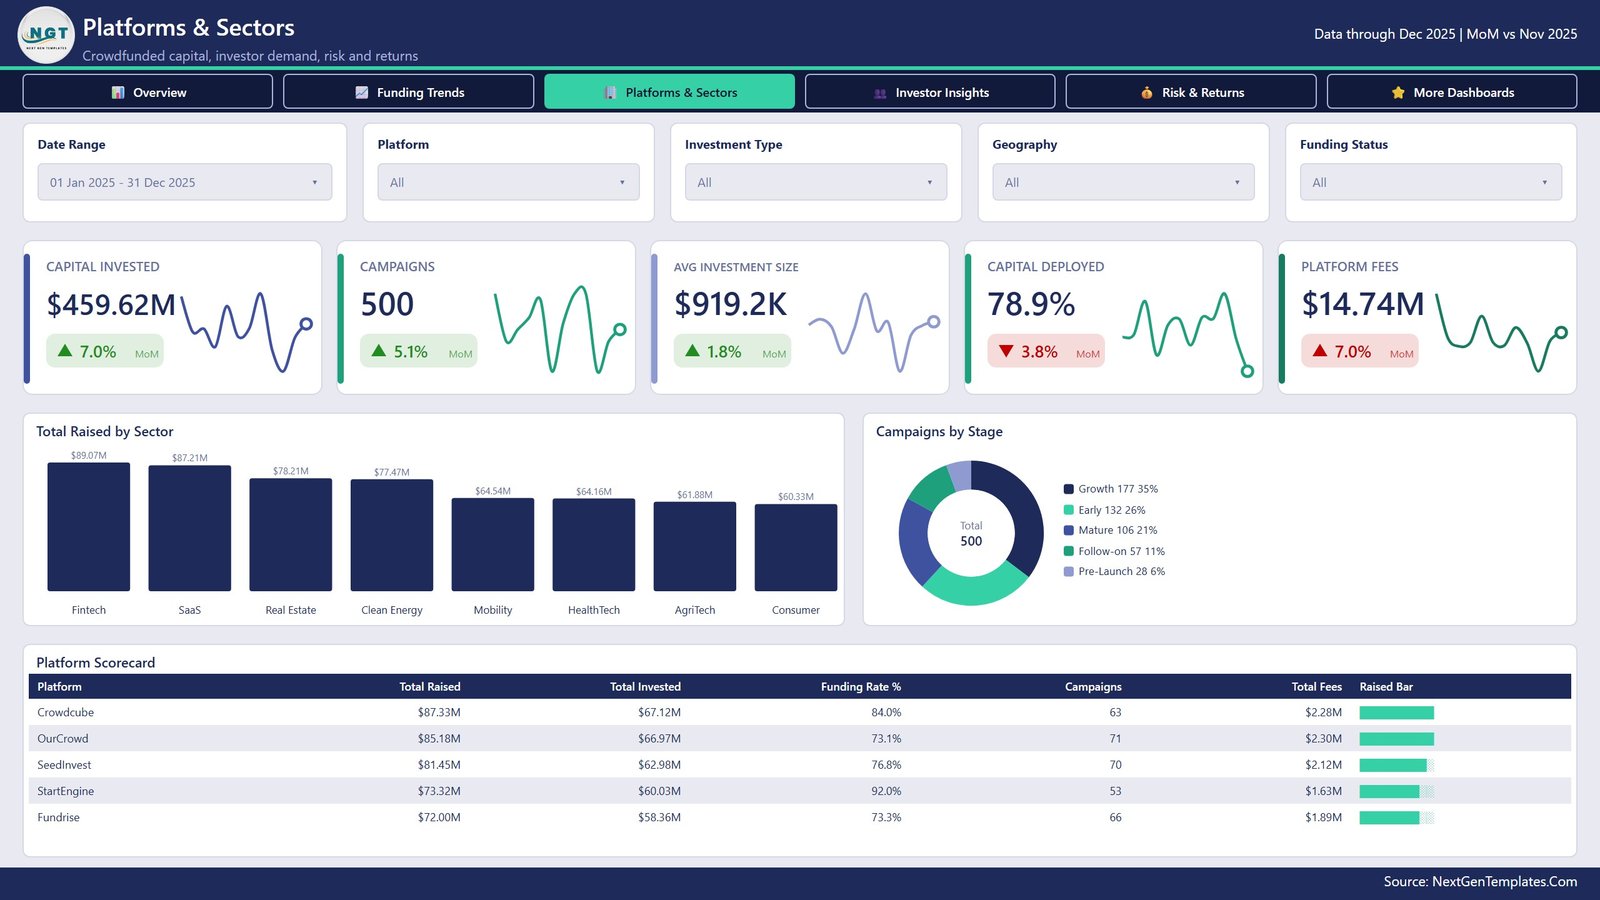
- Platform league tables – the Platform Scorecard ranks Crowdcube, OurCrowd, SeedInvest, StartEngine and Fundrise by total raised, total invested, funding rate, campaign count and fees earned.
- Sector and stage breakdowns – eight sectors from Fintech to Consumer, and five campaign stages from Pre-Launch through Mature.
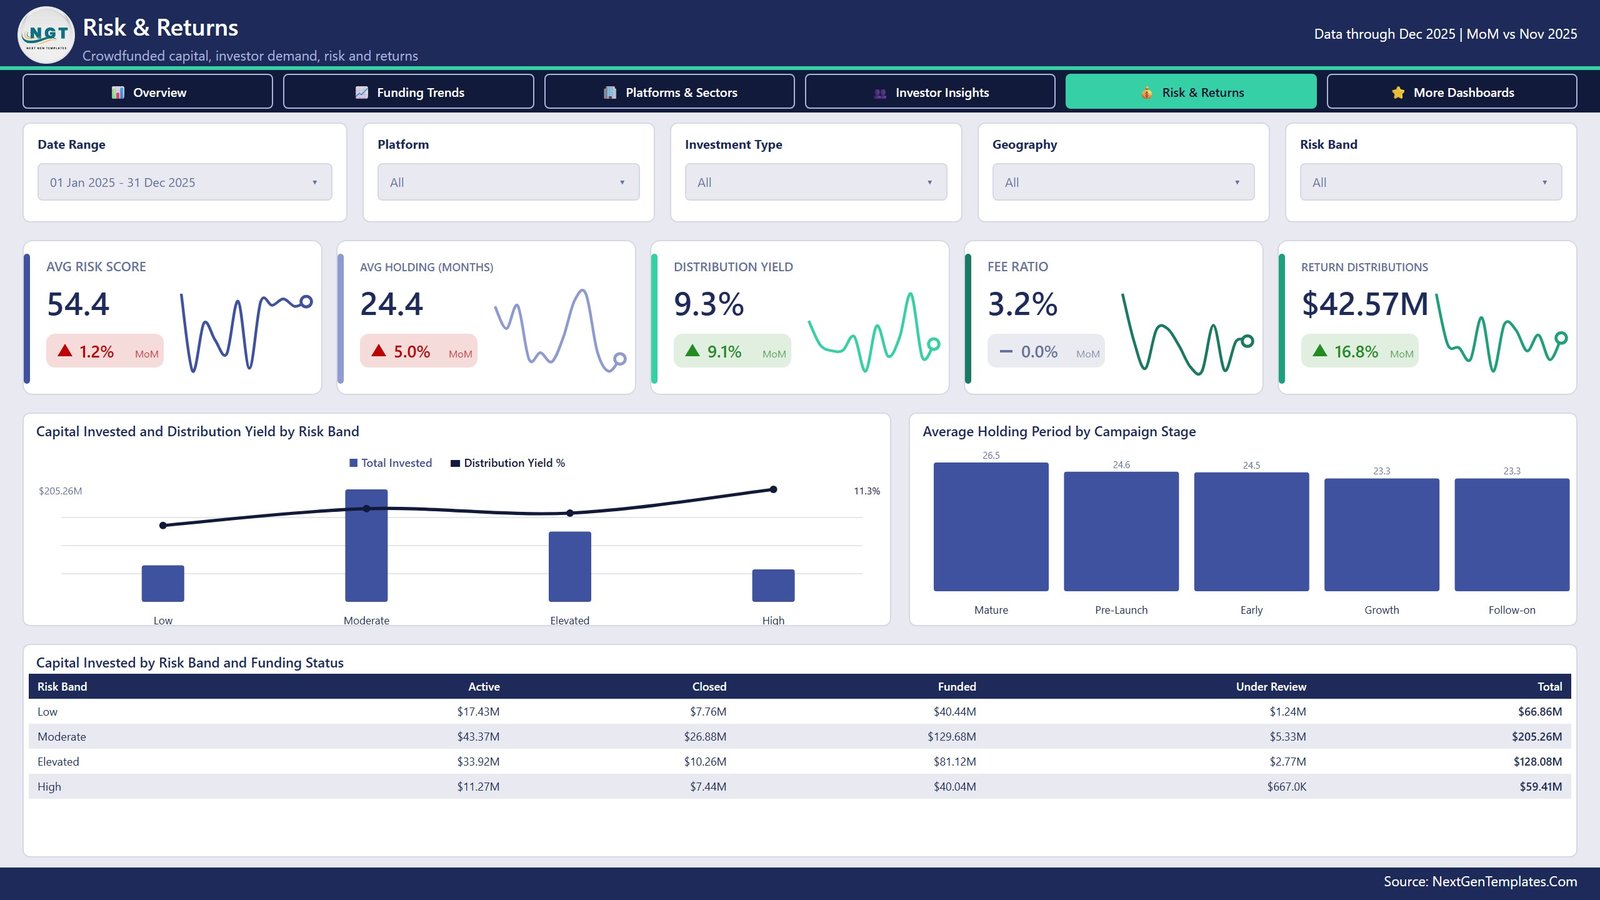
- Risk banding – Low, Moderate, Elevated and High bands carried through a combo chart and a funding-status matrix.
- 70+ DAX measures – MoM deltas, ratios, yields and averages are already written, named and formatted.
- Drillthrough and tooltip pages – a hidden Details page and two tooltip pages, already wired to the visuals.
- Nothing locked – no image-baked visuals, no protected pages, no external dependencies. Recolour it, rename it, ship it under your own logo.
What Is Inside the Crowdsourced Investment Platforms Dashboard
The download is a single ZIP containing the .pbix report, the Data.xlsx sample workbook that feeds it, and a Power BI Dashboard user manual PDF.
Page 1 – Overview
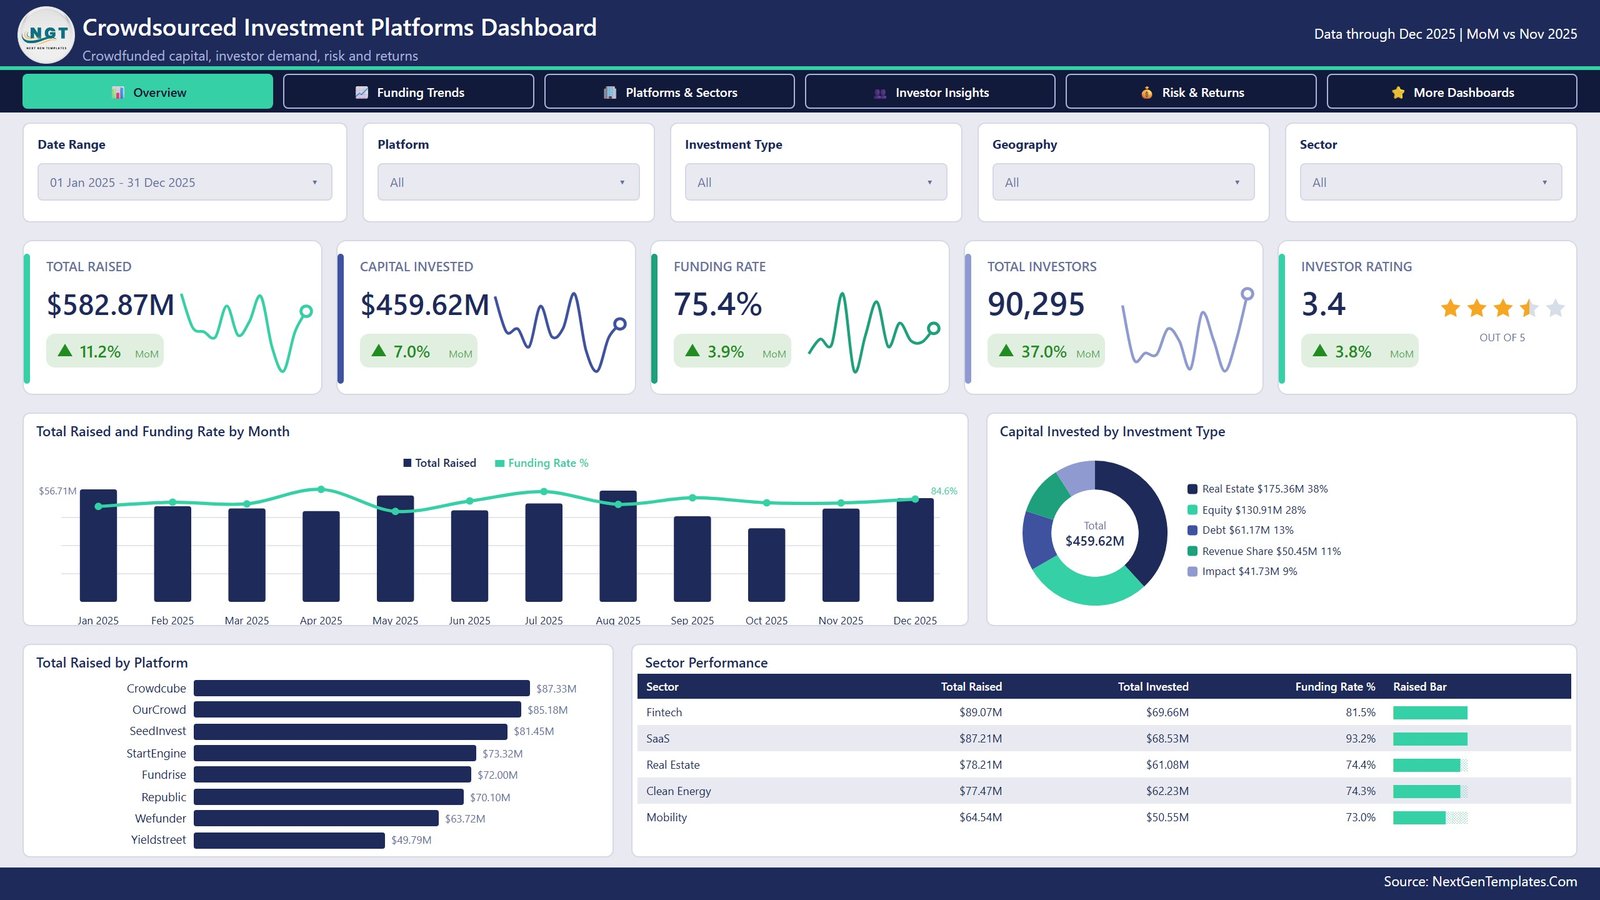
Total Raised $582.87M, Capital Invested $459.62M, Funding Rate 75.4%, Total Investors 90,295 and an Investor Rating of 3.4 out of 5. Below the cards, Total Raised and Funding Rate by Month puts twelve months of raise volume against the funding-rate line, Capital Invested by Investment Type splits the $459.62M across Real Estate, Equity, Debt, Revenue Share and Impact, Total Raised by Platform ranks eight platforms from Crowdcube at $87.33M down to Yieldstreet, and the Sector Performance table carries raised, invested and funding rate per sector.
Page 2 – Funding Trends
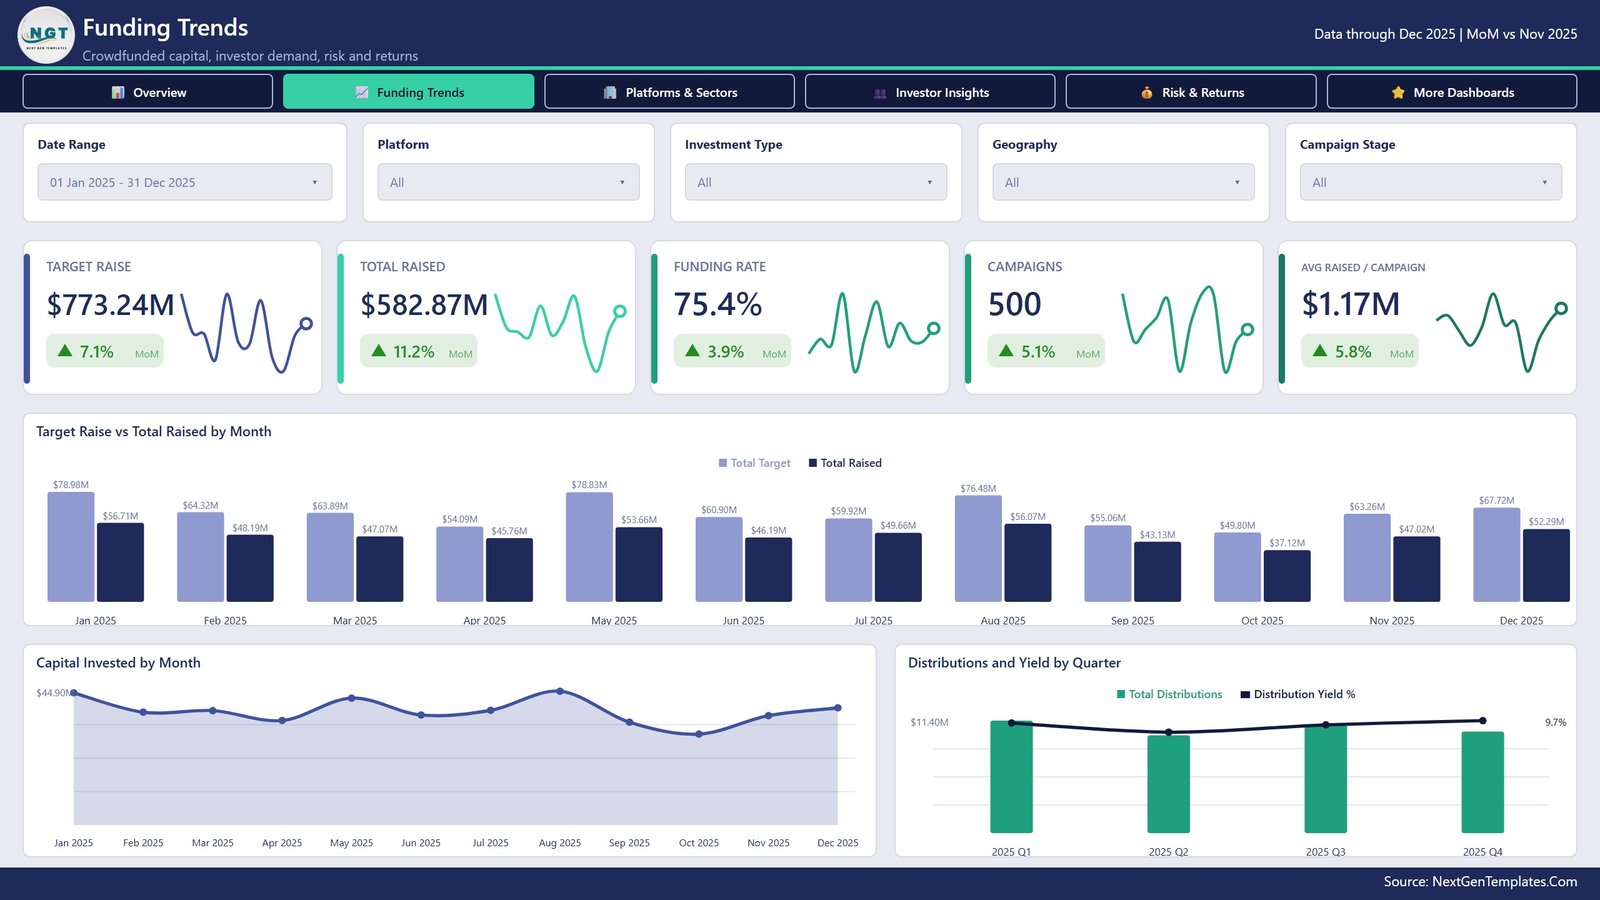
Target Raise $773.24M against Total Raised $582.87M, with 500 campaigns and $1.17M average raised per campaign. Target Raise vs Total Raised by Month shows the gap month by month, Capital Invested by Month traces deployment, and Distributions and Yield by Quarter pairs quarterly distributions with the yield line.
Page 3 – Platforms and Sectors
Capital Invested $459.62M, 500 campaigns, $919.2K average investment size, 78.9% capital deployed and $14.74M in platform fees. Total Raised by Sector ranks eight sectors, Campaigns by Stage splits the 500 campaigns across Growth, Early, Mature, Follow-on and Pre-Launch, and the Platform Scorecard table gives the per-platform league table.
Page 4 – Investor Insights
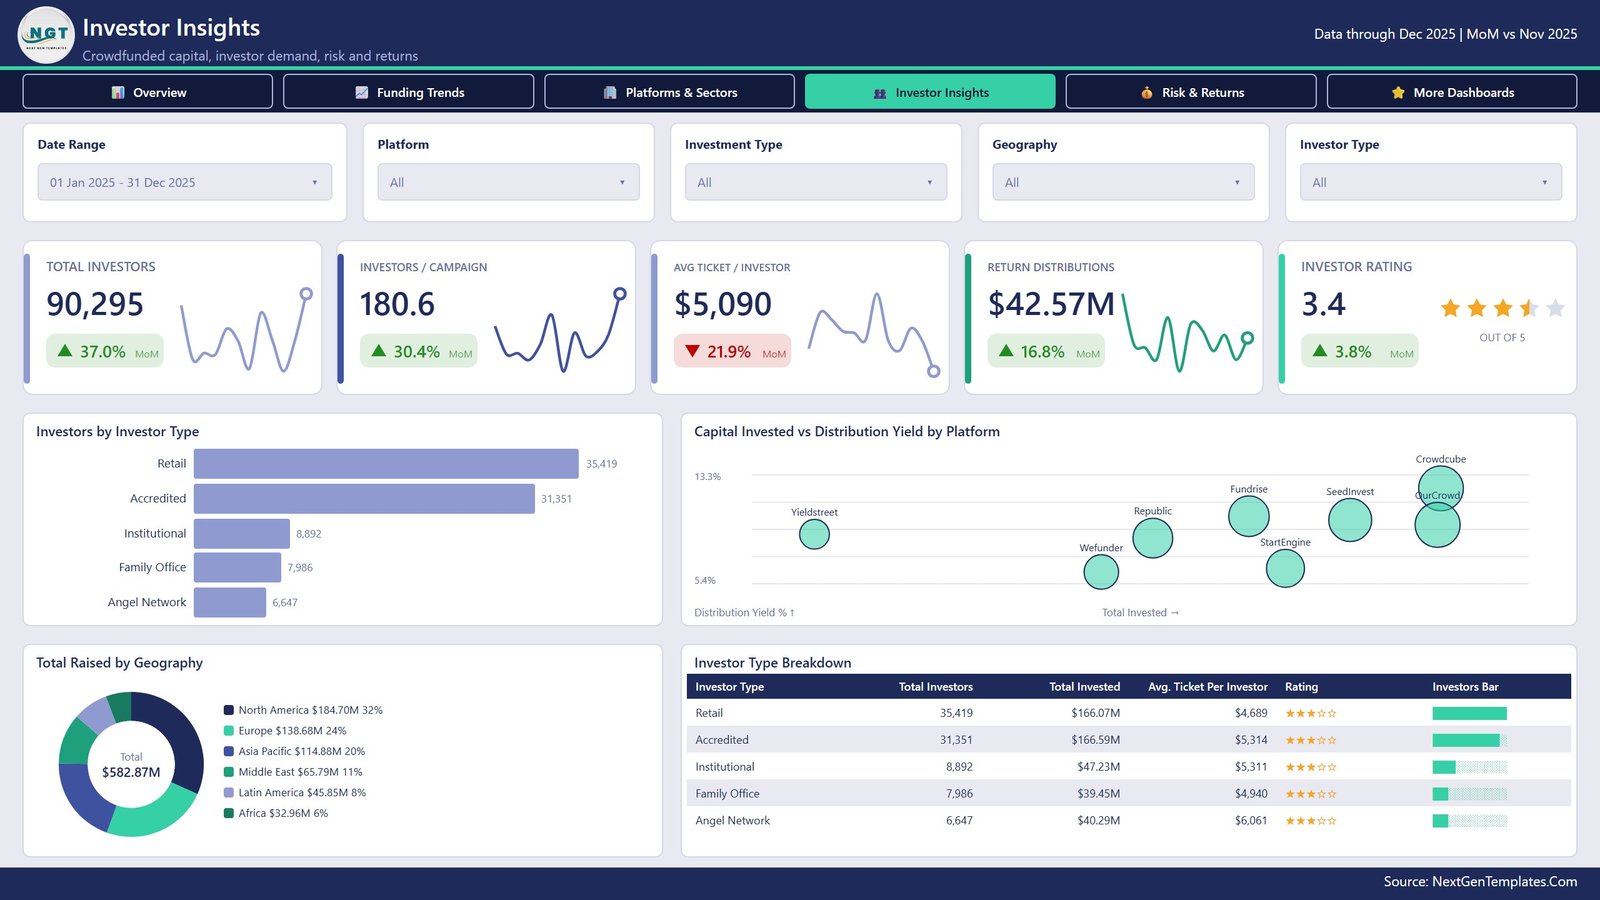
90,295 investors, 180.6 investors per campaign, $5,090 average ticket per investor and $42.57M in return distributions. Investors by Investor Type ranks Retail, Accredited, Institutional, Family Office and Angel Network, Capital Invested vs Distribution Yield by Platform plots each platform on a two-axis bubble chart, Total Raised by Geography splits six regions led by North America at $184.70M, and the Investor Type Breakdown table carries the per-type averages and ratings.
Page 5 – Risk and Returns
Average Risk Score 54.4, Average Holding 24.4 months, Distribution Yield 9.3%, Fee Ratio 3.2% and $42.57M distributed. Capital Invested and Distribution Yield by Risk Band pairs deployment with yield across Low to High, Average Holding Period by Campaign Stage compares five stages, and Capital Invested by Risk Band and Funding Status is a matrix of Active, Closed, Funded and Under Review against each band.
Power BI vs. Tableau vs. Paid Crowdfunding Analytics SaaS – Where This Fits
| What you get | This Power BI template | Tableau or Qlik build | Paid platform analytics SaaS |
|---|---|---|---|
| Cost | One payment of $17.99 | Licence from about $70 per user per month plus build time | Typically $200 to $800 per month |
| Platform | Power BI Desktop (free from Microsoft) | Tableau Desktop or Qlik Sense | Vendor web app |
| Setup time | Open, repoint one file path, refresh | Days of modelling and layout | Onboarding call, data mapping, contract |
| Real-time team collaboration | Publish to Power BI Service and share | Server or Cloud licence needed | Built in |
| Mobile access | Power BI mobile app | Vendor mobile app | Built in |
| Customisable fields | Every measure, column and visual is editable | Fully editable, but you build it | Only what the vendor exposes |
| Share with a link | Yes, via Power BI Service | Yes, with a server licence | Yes |
| Year-1 cost at 5 users | $17.99 | $4,200 or more in licences alone | $2,400 to $9,600 |
| Risk-band and stage analysis | Pre-built across four bands and five stages | You define the banding logic | Vendor fixed definitions |
| Your investor data stays local | Yes – the file lives on your machine | Yes | No – it sits in the vendor cloud |
Who This Template Is For – and Who It Is Not For
A good fit for: equity and property crowdfunding platform operators reporting to their own board; syndicate and angel-network leads who need one view across several platforms; fund-of-platform analysts comparing raise performance by sector and geography; and consultants who want a report skeleton they can rebrand for a client in an afternoon.
Not a good fit if: you need a live API feed from a specific platform, because this reads a workbook you refresh yourself; you want portfolio valuation, cap-table maths or regulatory filings; you need per-investor KYC or AML records; or you have no Power BI Desktop and no intention of installing it. This is a reporting template. It does not provide investment advice, does not forecast returns, and is not a regulated reporting tool. The sample figures are demo data, not market data.
How to Use the Crowdsourced Investment Platforms Dashboard
- Unzip the download and open the .pbix in Power BI Desktop.
- Explore the five pages with the sample data so you can see what each measure does.
- Open Transform Data and point the source query at your own copy of Data.xlsx – one file path.
- Match your columns to the sample workbook headings, or rename the steps to match your own.
- Close and Apply, then refresh. Every card, chart and table updates.
- Swap the NGT logo for your own on the header, and adjust the theme colours if you are rebranding.
- Publish to the Power BI Service if your team needs a shared link.
Real-World Use Cases
Anita runs investor relations at a property crowdfunding platform. Her board wants one number a month: how much of the target actually got raised. She filters Funding Trends to the last quarter and drops the target-versus-raised chart straight into the pack.
Marcus leads a 40-member angel syndicate spread across four platforms. He uses the Platform Scorecard and the Investor Type Breakdown to show members where the group money is actually working, and which platform charges the most in fees.
Priya is a BI consultant with a fintech client three weeks from a funding review. She rebrands this report in a morning, repoints it at the client export, and spends the rest of the engagement on the measures that are genuinely bespoke.
Frequently Asked Questions
Do I need a paid Power BI licence?
No. Power BI Desktop is free from Microsoft and opens the .pbix. A Pro or PPU licence is only needed if you want to publish and share through the Power BI Service.
Can I use my own data instead of the sample?
Yes. The report reads a single Excel workbook. Replace the sample rows with your own, keep the column headings, change the file path in Power Query and refresh.
Is the sample data real?
No. All 500 campaigns, the platform names, investor counts and yields are generated demo data used to make the visuals readable. Nothing in the file is market data or a performance claim.
Does this give investment advice or predict returns?
No. It reports the numbers you feed it. There is no forecasting model, no valuation engine and no recommendation logic anywhere in the file.
Can I edit the visuals and the DAX?
Yes. Nothing is locked or password protected. Every measure is visible in the model, every visual is editable, and there are no image-baked charts.
Will it work with Power BI on a Mac?
Power BI Desktop is Windows-only, so a Mac needs a Windows VM or a remote desktop. Once published, the Service and the mobile apps work anywhere.
What exactly is in the download?
One ZIP holding the .pbix report, the Data.xlsx sample workbook and a Power BI user manual PDF.
About the Author
Built by PK – Microsoft Certified Professional with 15+ years of Excel, Google Sheets, and Power BI experience. Founder of NextGenTemplates, reaching 300K+ subscribers across YouTube channels. Every template is hand-built and tested before release.
Explore Related Templates
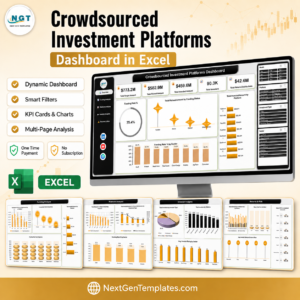
- Crowdsourced Investment Platforms Dashboard in Excel – the same five-page analysis built as an Excel workbook.
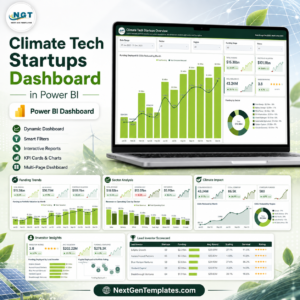
- Climate Tech Startups Dashboard in Power BI – venture funding analysis for the climate sector.
- Carbon Trading Dashboard in Power BI – volumes, pricing and settlement reporting.
- Angel Investors KPI Dashboard in Excel – a compact scorecard for syndicate leads.
- Stock Brokerage KPI Dashboard in Excel – brokerage volume and revenue KPIs.
- Browse every Power BI dashboard template or the full Power BI library.
Get the Crowdsourced Investment Platforms Dashboard in Power BI for $17.99 – one payment, no subscription, instant download, and yours to edit and rebrand. Add it to your cart and open your first refresh today.
Last updated: 27 August 2026.






Reviews
There are no reviews yet.