



The Private Equity KPI Dashboard in Excel is a comprehensive and essential tool for private equity firms, investment managers, and financial analysts to track, monitor, and optimize key performance indicators (KPIs) across their investment portfolios. Whether you are managing multiple assets, monitoring fund performance, or tracking ROI, this dashboard provides a centralized view of your investments, helping you make data-driven decisions that maximize returns and minimize risks.
With dynamic charts, real-time data updates, and customizable inputs, this dashboard allows you to visualize portfolio performance, track capital calls, distributions, and identify trends that can inform future investment strategies. This tool is ideal for private equity professionals seeking to streamline operations, enhance reporting, and improve portfolio management.

Key Features of the Private Equity KPI Dashboard in Excel:
📊 Comprehensive KPI Tracking
Track essential KPIs such as ROI, fund performance, capital calls, distributions, net asset value (NAV), and investment exit metrics—all in one dashboard.
📈 Real-Time Portfolio Monitoring
Monitor the performance of your portfolio in real time, providing you with up-to-date information about asset values, distributions, and overall portfolio health.
📅 Month-to-Date (MTD) and Year-to-Date (YTD) Performance
Track your fund’s performance over time by comparing current data to historical performance, allowing you to identify growth patterns and areas for improvement.
🎯 Goal Setting and Performance Comparison
Set specific targets for each KPI and compare actual performance against those targets, ensuring that your investments are aligned with your business goals.
🛠 Customizable Inputs
Easily input data such as capital calls, distributions, asset valuations, and exit metrics, while customizing the dashboard to suit your firm’s specific needs.
🔔 Conditional Formatting Alerts
Receive real-time alerts with color-coded indicators to highlight areas that require attention, such as underperforming assets, missed distribution goals, or underutilized funds.
💼 Investment Insights
Gain deeper insights into your portfolio’s performance by tracking key metrics such as capital deployment, returns, and risk-adjusted performance.
🚀 Why You’ll Love the Private Equity KPI Dashboard in Excel:
✅ Optimize Investment Performance – Track fund performance, ROI, and distributions in real time to ensure your investments are performing as expected.
✅ Enhance Portfolio Management – Monitor the overall health of your private equity portfolio and make informed decisions about future investments.
✅ Improve Risk Management – Measure and analyze risk-adjusted returns, ensuring your private equity firm is making sound, data-driven investment decisions.
✅ User-Friendly Interface – Designed for ease of use, even for those with limited technical knowledge, making it easy to input data and analyze investment performance.
✅ Fully Customizable – Tailor the dashboard to fit your specific private equity firm, whether you’re tracking individual investments, funds, or entire portfolios.
What’s Inside the Private Equity KPI Dashboard in Excel:
- ROI and Fund Performance KPI: Track the return on investment (ROI) and overall performance of your funds, comparing actual returns to targets.
- Capital Calls KPI: Monitor the capital raised and invested over time, tracking how much capital has been called from limited partners (LPs).
- Distributions KPI: Track the capital returned to investors, helping you measure your firm’s distribution capabilities.
- Net Asset Value (NAV) KPI: Track the net asset value of your portfolio, ensuring that assets are being allocated efficiently and generating desired returns.
- Investment Exit KPI: Measure exit performance, including sale prices, returns on exits, and the timing of asset sales.
- Risk-Adjusted Returns KPI: Track and measure the risk-adjusted return on your investments, ensuring that risk is managed effectively while maximizing profits.
How to Use the Private Equity KPI Dashboard in Excel:
1️⃣ Download the Template – Instantly access your Excel file upon purchase.
2️⃣ Input Your Data – Enter your private equity portfolio data, including fund performance, capital calls, distributions, and asset valuations.
3️⃣ Set Targets – Define your performance targets for ROI, distributions, NAV, and other KPIs to guide investment decisions.
4️⃣ Track Performance – Monitor your portfolio’s performance in real-time and make necessary adjustments to your investment strategies.
5️⃣ Generate Reports – Use the dashboard to create detailed performance reports for internal reviews, board meetings, or investor presentations.
Who Can Benefit from the Private Equity KPI Dashboard in Excel:
- Private Equity Firms
- Investment Managers
- Fund Managers
- Financial Analysts
- Portfolio Managers
- Business Owners
- Private Equity Investors
The Private Equity KPI Dashboard in Excel is the ultimate tool for private equity firms looking to track fund performance, optimize portfolio management, and enhance investor reporting.
Click here to read the Detailed blog post
https://www.pk-anexcelexpert.com/private-equity-kpi-dashboard-in-excel/
Compatibility and Requirements
- Works in Microsoft Excel desktop (Excel 2016 or later, or Microsoft 365).
- Results show in charts you can restyle. Microsoft explains Excel charts in Create a chart from start to finish.
Frequently Asked Questions
Which KPIs does the Private Equity KPI Dashboard track?
It tracks ROI and fund performance, capital calls, distributions, net asset value (NAV), investment exits and risk-adjusted returns.
Does it show MTD and YTD results?
Yes. It tracks month-to-date and year-to-date performance and compares current data with past results.
Can I set targets?
Yes. You set a target for each KPI and compare actual performance against it.
How does it highlight problems?
Conditional formatting adds color-coded indicators for areas that need attention, such as underperforming assets or missed distribution goals.
Is there a Power BI or Google Sheets version?
Yes. See the Private Equity KPI Dashboard in Power BI and the Private Equity KPI Dashboard in Google Sheets.
Related Private Equity Templates
- Private Equity KPI Dashboard in Power BI: the same KPIs in Power BI
- Private Equity KPI Dashboard in Google Sheets: the same KPIs in a browser
- Private Equity KPI Scorecard in Excel: a scorecard view with targets
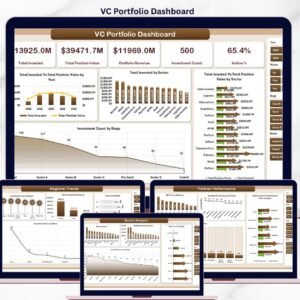
- Venture Capital Dashboard in Excel: track venture capital investments
- Finance & Accounting Command Center: 8 finance templates in one download
Browse all Excel KPI dashboards or the Excel financial tools.































Reviews
There are no reviews yet.