

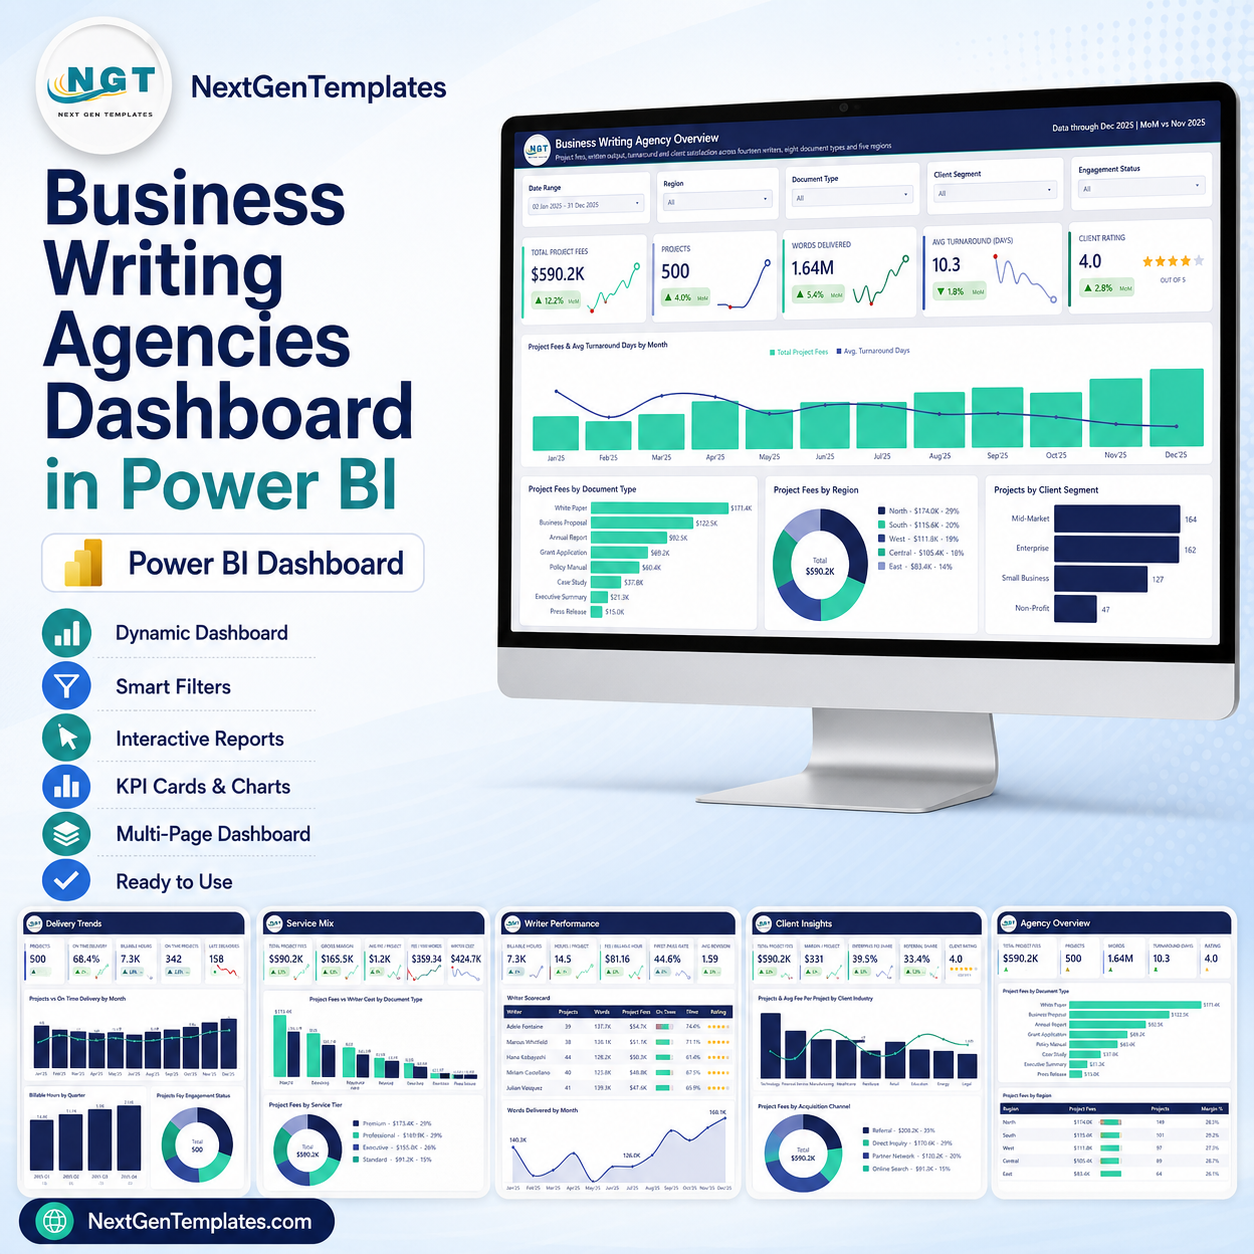
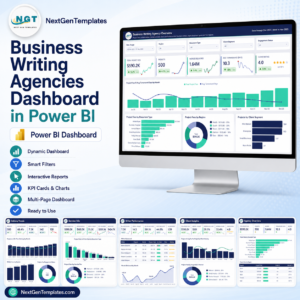
The Business Writing Agencies Dashboard in Power BI turns a flat project log into a five-page agency report. The sample model carries 500 writing projects across 14 writers, 8 document types, 6 agency branches and 5 regions, resolved by 36 DAX measures referenced across the report visuals: $590.2K of project fees, 1.64M words delivered, a 10.3-day average turnaround and a 4.0 out of 5 client rating, every figure recalculating from five synced slicers. Nine pages ship inside the file – five analysis pages, a hidden Details drillthrough, two hover tooltips and a bonus page. It arrives as one .pbix you open in the free Power BI Desktop: no subscription, no per-seat licence, and nothing leaves your machine.
Built and tested by a Microsoft Certified Professional, delivered instantly after checkout, and fully editable – rename a measure, recolour a chart, add a page.
Key Features of the Business Writing Agencies Dashboard in Power BI
- Five slicers on every page, synced across the report – Date Range, Region, Document Type, Client Segment, plus one page-specific filter (Engagement Status, Service Tier, Agency Branch, Writer or Acquisition Channel).
- Twenty-five KPI cards – five per page, each with a month-on-month delta and its own sparkline, so a card shows both the level and the direction.
- Fee and cost side by side – Project Fees against Writer Cost by document type, so gross margin is visible per deliverable rather than only in total.
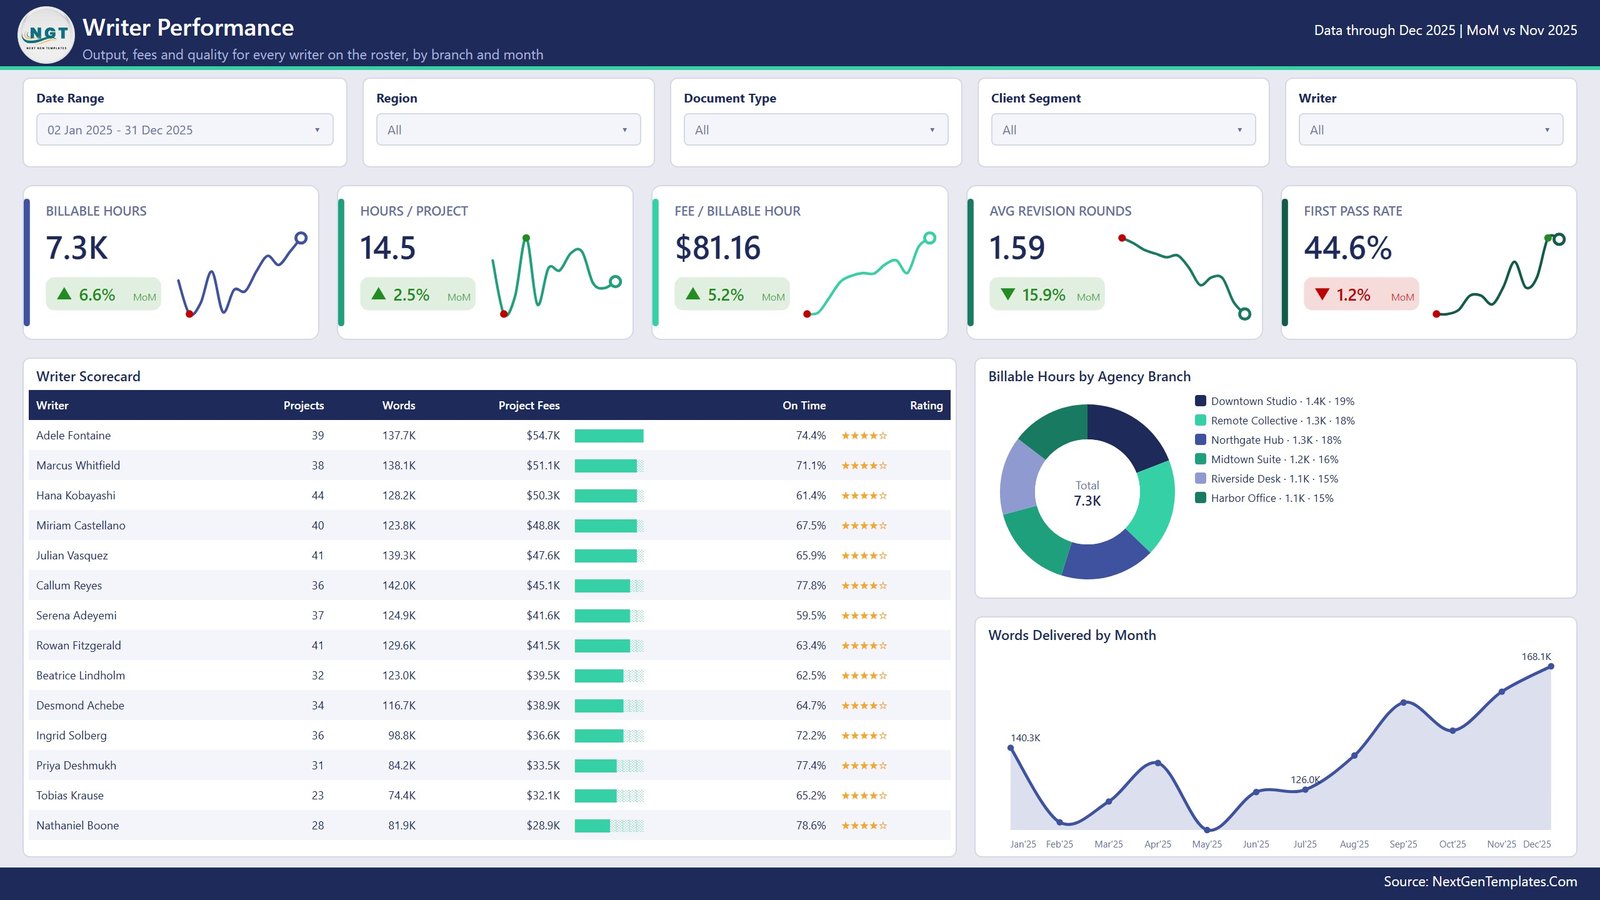
- Writer Scorecard listing all 14 writers with projects, words, fees, on-time share and star rating in one sortable table.
- Service Tier Economics Scorecard – projects, fees, fee per project, margin percentage and rating for Premium, Professional, Executive and Standard.
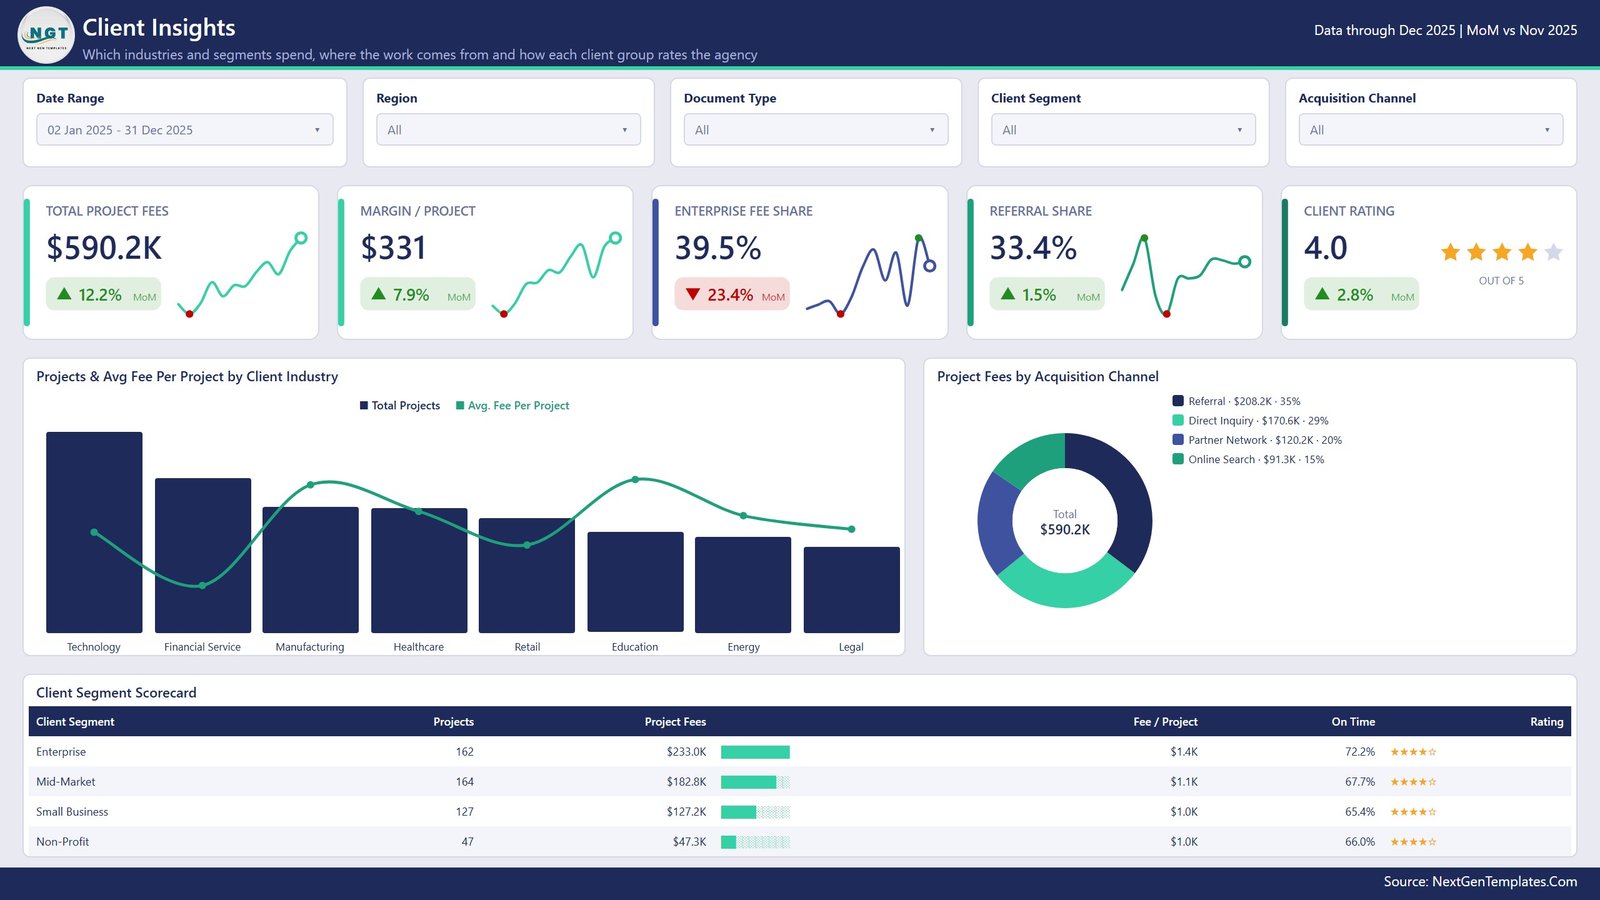
- Client Segment Scorecard covering Enterprise, Mid-Market, Small Business and Non-Profit with fee per project and on-time share.
- Hidden Details drillthrough page – right-click any visual to inspect the underlying project rows.
- Two hover tooltip pages (Category Detail and Trend Detail) that pop up over charts without leaving the page.
- Custom theme and NGT chrome – branded header band, page subtitle, source footer and a consistent teal-on-navy palette you can swap in one theme file.
What’s Inside the Business Writing Agencies Dashboard in Power BI
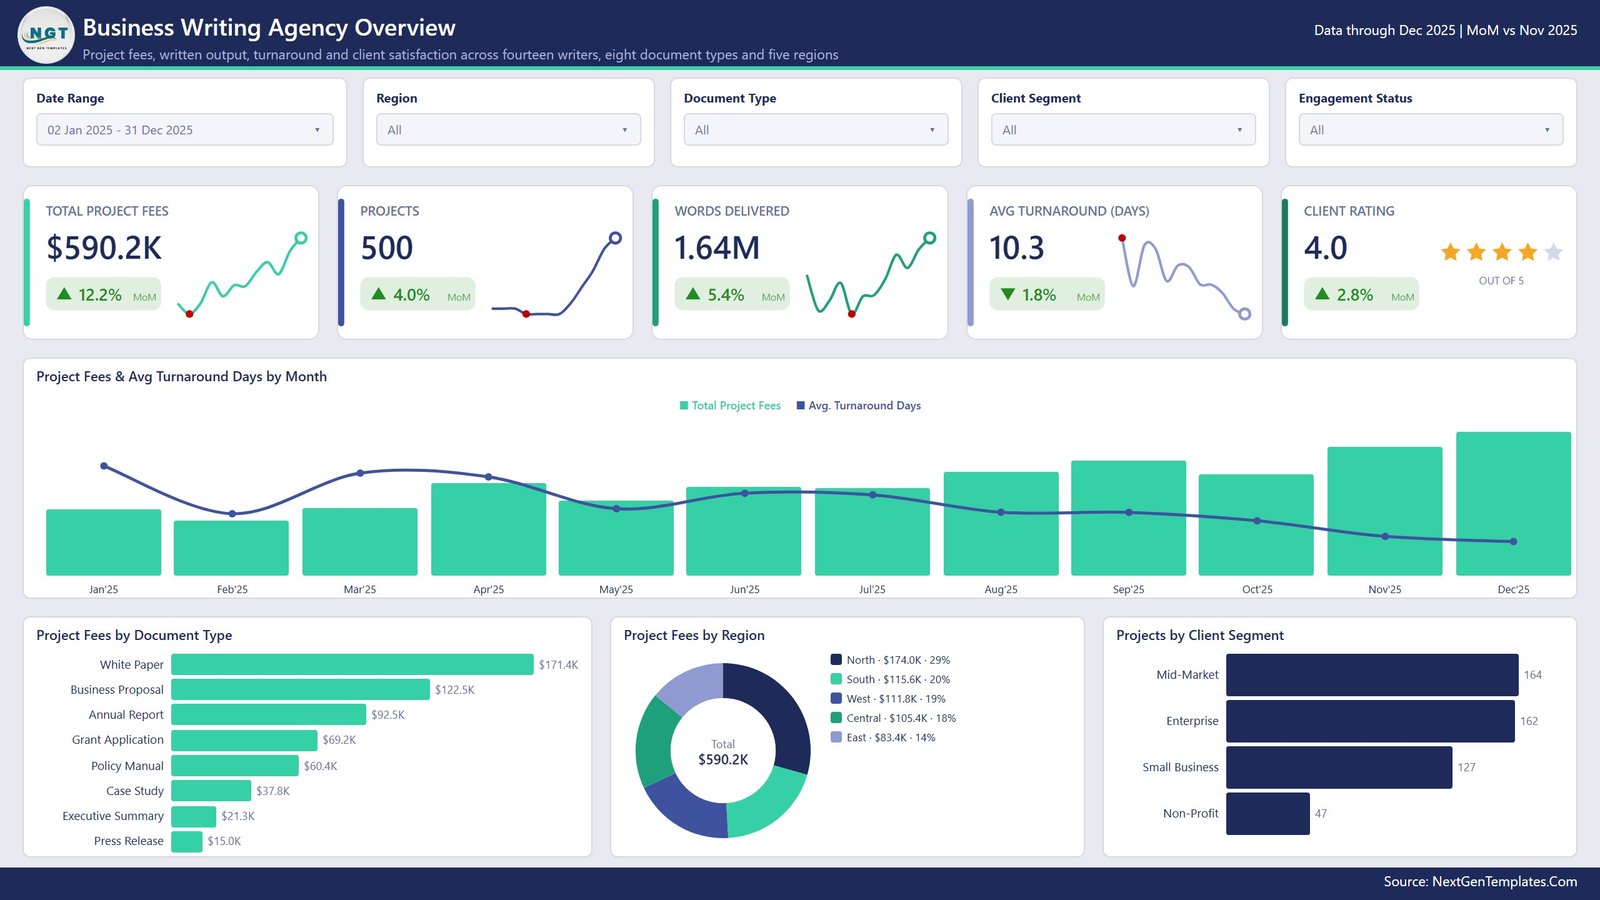
Page 1 – Business Writing Agency Overview
The landing page answers “how did the agency do” in one screen: Total Project Fees $590.2K, Projects 500, Words Delivered 1.64M, Avg Turnaround 10.3 days and Client Rating 4.0. Below it, Project Fees & Avg Turnaround Days by Month pairs revenue with speed, then Project Fees by Document Type, Project Fees by Region and Projects by Client Segment split the same total three ways.
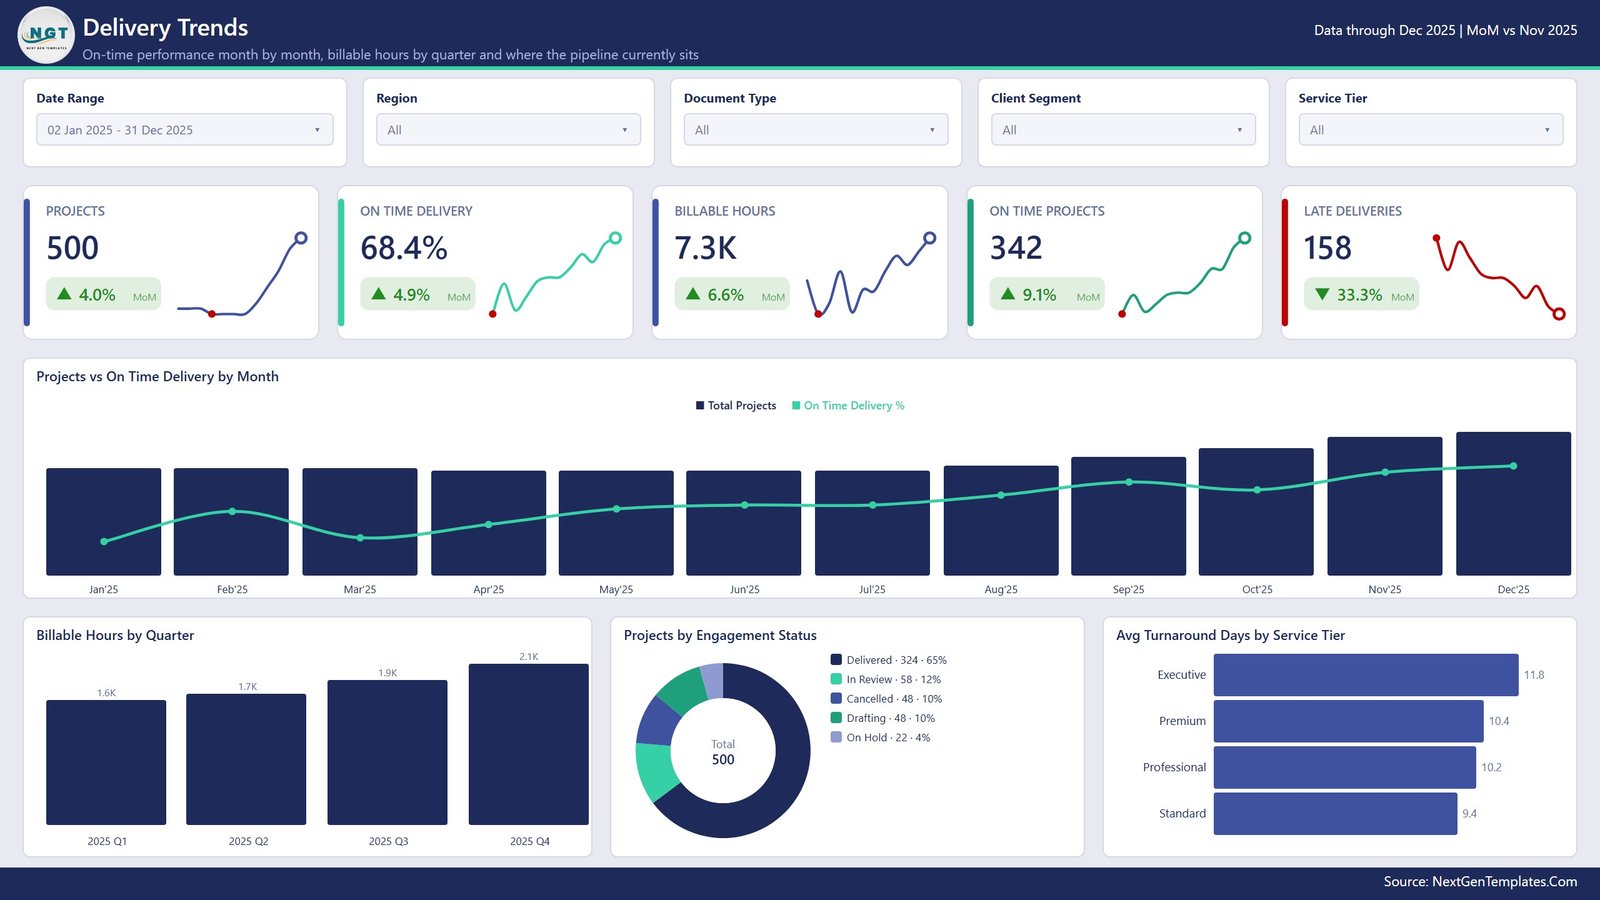
Page 2 – Delivery Trends
Delivery is tracked on its own page: Projects 500, On Time Delivery 68.4%, Billable Hours 7.3K, On Time Projects 342 and Late Deliveries 158. Projects vs On Time Delivery by Month shows whether volume is costing you punctuality, while Billable Hours by Quarter, Projects by Engagement Status and Avg Turnaround Days by Service Tier explain where the time goes.
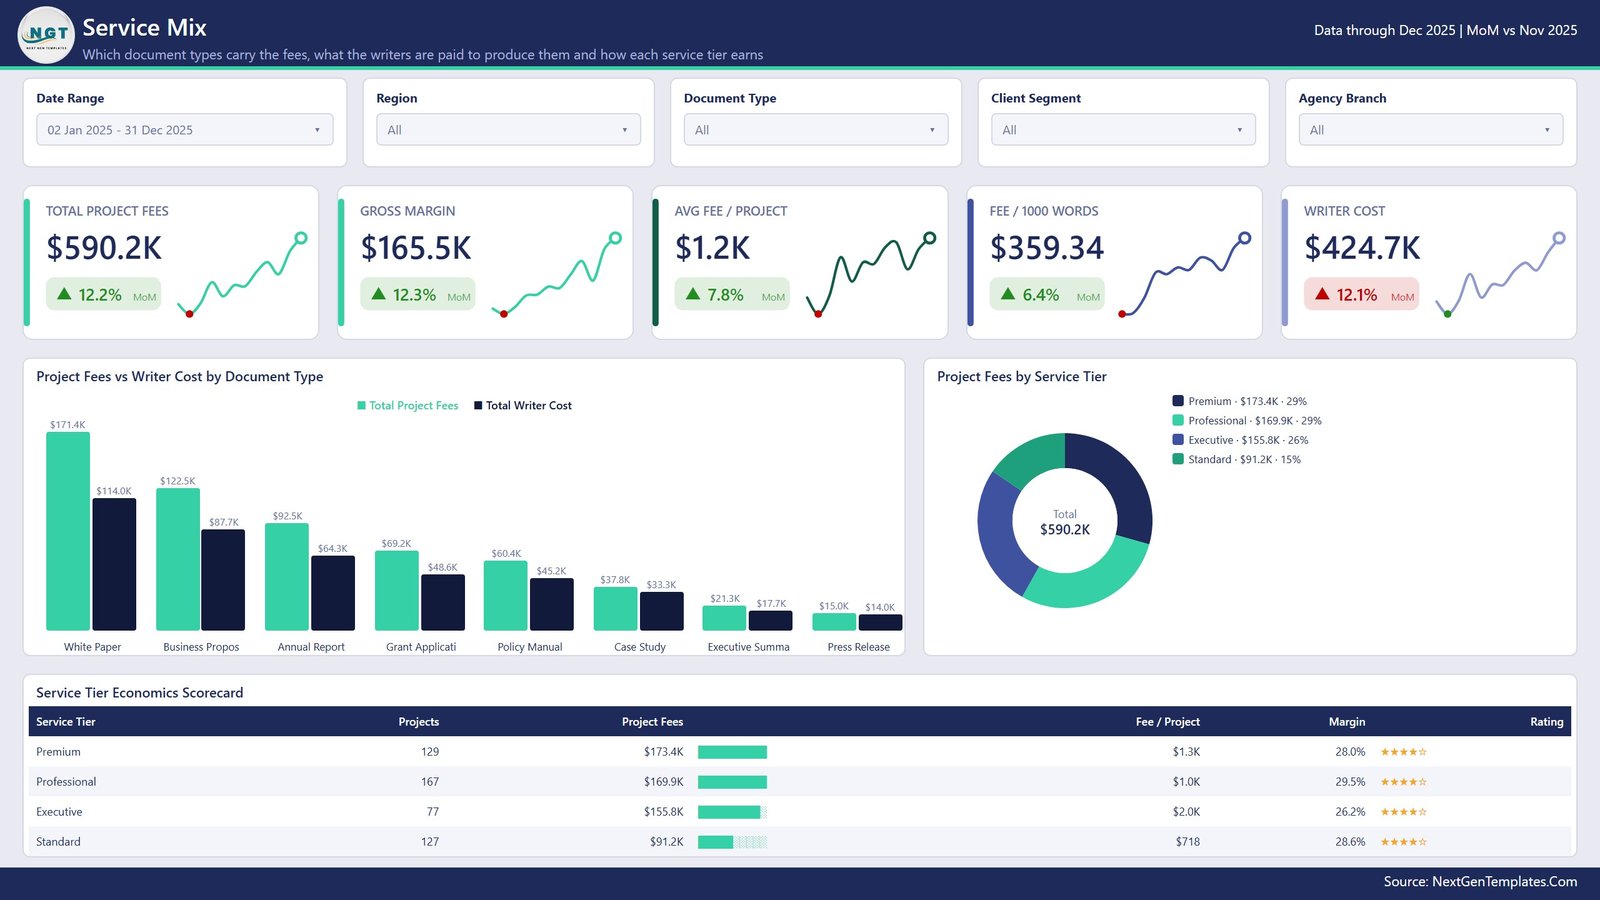
Page 3 – Service Mix
This is the margin page. Gross Margin $165.5K sits beside Total Project Fees $590.2K and Writer Cost $424.7K, with Avg Fee per Project $1.2K and Fee per 1000 Words $359.34. Project Fees vs Writer Cost by Document Type ranks the eight deliverables by what they earn and what they cost, and the Service Tier Economics Scorecard turns that into margin percentage per tier.
Page 4 – Writer Performance
Capacity and quality per writer: Billable Hours 7.3K, Hours per Project 14.5, Fee per Billable Hour $81.16, Avg Revision Rounds 1.59 and First Pass Rate 44.6%. The Writer Scorecard lists every writer on the roster, Billable Hours by Agency Branch splits capacity across the six studios, and Words Delivered by Month tracks output.
Page 5 – Client Insights
Where the money comes from: Margin per Project $331, Enterprise Fee Share 39.5%, Referral Share 33.4% and Client Rating 4.0. Projects & Avg Fee Per Project by Client Industry compares eight industries, Project Fees by Acquisition Channel splits referral, direct inquiry, partner network and online search, and the Client Segment Scorecard closes the page.
The pages you will not see in the tab bar
Three more pages ship hidden: a Details drillthrough that exposes the project-level rows behind any visual, and two 280×360 tooltip pages, Category Detail and Trend Detail, that appear on hover. A ninth page links back to the rest of the catalogue.
Business Writing Agencies Dashboard vs. Tableau vs. Agency Ops SaaS – Where This Fits
| This template | Tableau or Qlik build | Agency ops SaaS (Scoro, Productive) | |
|---|---|---|---|
| Cost | One-time purchase | Per-user subscription plus build time | Recurring per-user subscription |
| Platform | Power BI Desktop (free) | Paid BI platform | Vendor-hosted web app |
| Setup time | Open the .pbix, repoint the source | Days to model and design | Onboarding plus data migration |
| Real-time team collaboration | Via Power BI Service if you publish | Via the vendor’s server | Yes, built in |
| Mobile access | Power BI mobile app once published | Vendor mobile app | Yes |
| Customisable fields | Every measure, column and visual | Yes, with developer effort | Limited to vendor’s schema |
| Share with link | Yes, after publishing to your workspace | Yes | Yes |
| Year-1 cost at 5 users | Purchase price only | 5 paid seats for 12 months | 5 paid seats for 12 months |
| Writer-level margin view | Built in (fee vs writer cost) | You build it | Usually an add-on module |
| Works offline | Yes, on the desktop file | Partly | No |
Who This Template Is For – and Who It’s Not For
A good fit if you run a business writing, copywriting, technical documentation or content agency with a handful of writers and a project log you already keep in Excel or a CRM export; if you bill by project or by word and want margin per deliverable; or if you want a Power BI starting point you can edit rather than a locked reporting tool.
Not for you if you need live editing by several people at once inside the file – Power BI Desktop is single-author, so use the Power BI Service or a Google Sheets version for that. It is also not a project management tool: there is no task assignment, invoicing or time-clock. And it does not connect to any writing platform out of the box – you point it at your own export.
How to Use the Business Writing Agencies Dashboard in Power BI
- Download the .pbix and open it in Power BI Desktop (free from Microsoft).
- Open Transform Data and repoint the Data query at your own project export – keep the 19 column names and every visual redraws.
- Refresh. The date table rebuilds from your Delivery Date column, so the month and quarter axes follow your data.
- Set the Date Range slicer to the period you report on; the other four slicers are synced across pages.
- Right-click any bar or table row and choose Drillthrough to Details to see the projects behind the number.
- Edit the theme file if you want your agency’s colours instead of the NGT palette.
- Publish to your Power BI workspace if you want the report on the web and on mobile.
Real-World Use Cases
Priya runs a 14-writer B2B content studio. She opens Service Mix on the first Monday of the month, sorts the Service Tier Economics Scorecard by margin, and finds that Standard tier work earns 28.6% margin on the lowest fee per project – the case for retiring the tier or repricing it.
Daniel is an operations lead at a proposal-writing firm. Delivery Trends shows Late Deliveries falling 33.3% month on month while Billable Hours rise. He filters Service Tier to Executive, sees the 11.8-day average turnaround, and rebalances the roster before the quarter closes.
Amara handles client relationships. Client Insights tells her Enterprise accounts carry 39.5% of fees on 162 projects at $1.4K per project, and that Referral is her largest acquisition channel – so she puts the referral programme, not paid search, in next quarter’s plan.
Frequently Asked Questions
Do I need a Power BI licence to use this?
No. Power BI Desktop is free from Microsoft and opens the .pbix fully. A licence is only needed if you publish the report to the Power BI Service to share it online.
How is On Time Delivery calculated, and why is On Time Projects higher than Delivered?
On Time Delivery compares Turnaround Days against Committed Days across every project row in the sample, including the ones still Drafting, In Review, On Hold or Cancelled. That is why the card reads 342 on-time projects while only 324 carry a Delivered status. If you want on-time measured on completed work only, filter Engagement Status to Delivered – the sample then reads 70.7%. It is a two-second change and we would rather you knew before you bought.
Does Referral Share mean 33.4% of my revenue?
No – Referral Share on the Client Insights page is a share of project count (167 of 500). The donut beside it shows Referral at 35% of fees. Both are correct; they simply use different bases, and the measure names are easy to edit if you prefer one basis for both.
Can I replace the sample data with my own?
Yes. Keep the 19 column headers in the source file and every measure, chart and scorecard follows your rows. Add columns freely; only renaming or removing one of the 19 breaks a visual.
How many writers, document types and clients does it handle?
The sample uses 14 writers, 8 document types, 6 branches, 5 regions, 4 service tiers and 4 client segments, but nothing is hard-coded to those counts – the visuals expand to whatever your data contains.
Is this the same as a KPI scorecard dashboard?
No. This is the analytical line: month-by-month charts, scorecard tables and drillthrough. The KPI scorecard products are a different build with a month picker and traffic lights. Both exist in the catalogue; pick the one that matches how you report.
Are there any known cosmetic issues?
Two, both minor and both fixable in Power BI Desktop: on Service Mix the category axis abbreviates longer document names (“Business Propos”), and the combo charts show values on hover rather than as printed data labels. Widening the axis or switching data labels on takes a click each.
About the Author
Built by PK – Microsoft Certified Professional with 15+ years of Excel, Google Sheets, and Power BI experience. Founder of NextGenTemplates, reaching 300K+ subscribers across YouTube channels. Every template is hand-built and tested before release.
Explore Related Templates
- Creative Agencies Dashboard in Power BI – the studio-side view: campaigns, retainers and creative utilisation.
- Copywriting & Content Creation Dashboard in Power BI – content performance rather than agency economics.
- Creative Agencies Dashboard in Excel – the same agency questions without Power BI Desktop.
- Coaching Networks Dashboard in Excel – another people-delivered services model, in Excel.
- Browse every Power BI dashboard template or the wider Power BI catalogue.
Ready to see your agency’s margin per deliverable? Add the Business Writing Agencies Dashboard in Power BI to your cart, open it in Power BI Desktop within minutes of checkout, and point it at your own project log. Full walkthrough on the blog post, and video tutorials at youtube.com/@PKAnExcelExpert.
Last updated: 18 August 2026.
















Reviews
There are no reviews yet.