

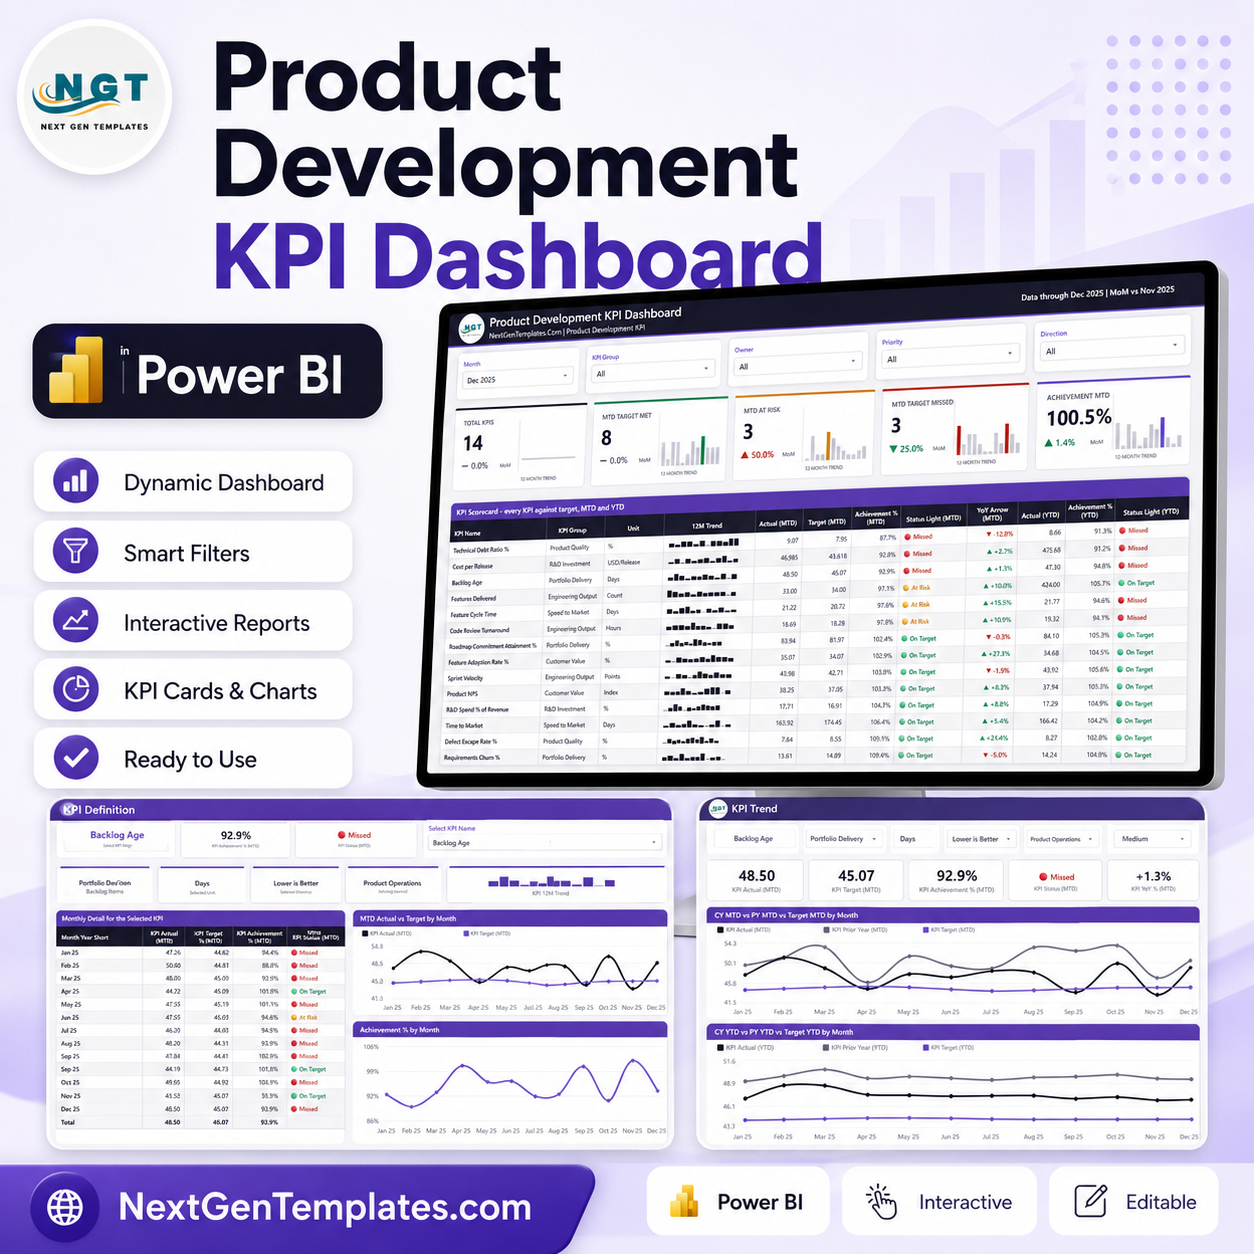
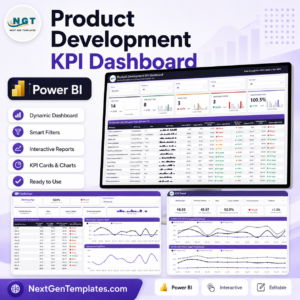
The Product Development KPI Dashboard in Power BI is a month-picker KPI scorecard for product and R&D reporting. It puts 14 KPIs across six groups on a single page with month-to-date and year-to-date actuals, targets you set yourself, traffic lights and a 12-month sparkline per row. The download is one .pbix holding 6 report pages and 38 DAX measures, plus a four-sheet Excel data pack seeded with 168 target rows and 336 actual rows of demo figures and a PDF user manual. It is a scorecard, not an analytics report: you type your own roadmap, release, defect, cycle-time and cost numbers into the workbook and refresh. The file is fully editable with no locked visuals, no subscription and no add-ins to install beyond the free Power BI Desktop. Product Development KPI Dashboard in Power BI
Key Features of the Product Development KPI Dashboard in Power BI
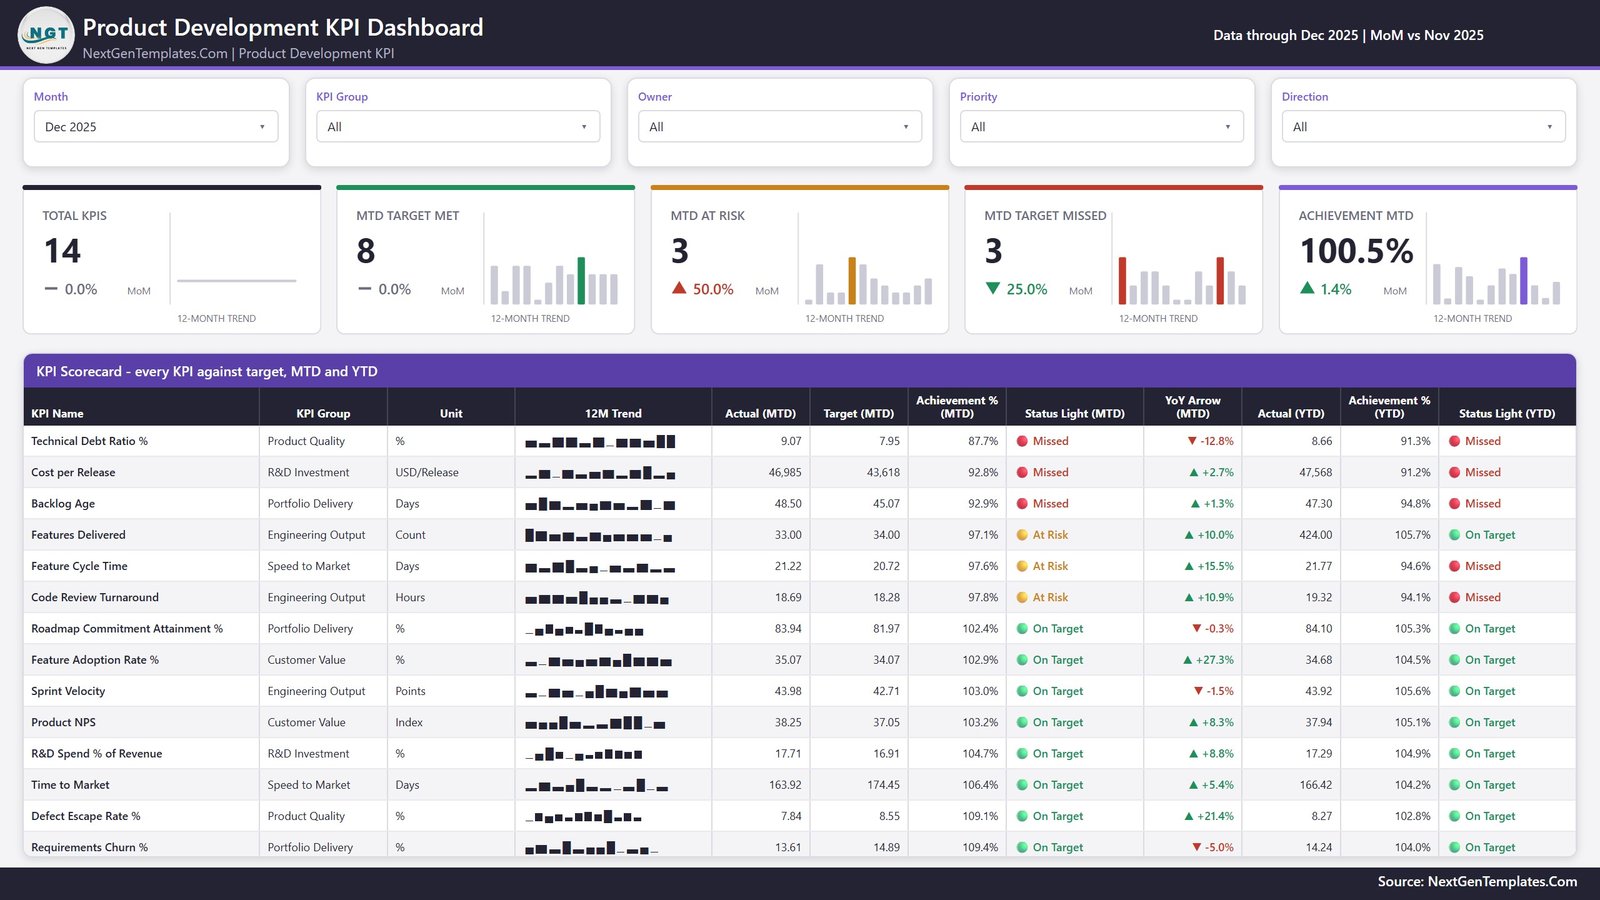
- One scorecard, 14 KPIs, six groups. Speed to Market, Engineering Output, Product Quality, Portfolio Delivery, R&D Investment and Customer Value each own a slice of the table, so a release review reads top to bottom without switching pages.
- Five slicers on the scorecard page: Month, KPI Group, Owner, Priority and Direction. Filter to one team’s KPIs, or to every lower-is-better metric, in one click. Product Development KPI Dashboard in Power BI
- Five header cards with sparklines: Total KPIs, MTD Target Met, MTD At Risk, MTD Target Missed and Achievement MTD, each carrying a 12-month trend and a month-on-month delta.
- Twelve scorecard columns: KPI Name, KPI Group, Unit, 12M Trend, Actual (MTD), Target (MTD), Achievement % (MTD), Status Light (MTD), YoY Arrow (MTD), Actual (YTD), Achievement % (YTD) and Status Light (YTD).
- Direction-aware maths. Every KPI is flagged UTB (upper is better) or LTB (lower is better) in the data pack, so cutting cycle time or backlog age scores above 100% rather than below it.
- Targets and thresholds are yours. The traffic-light bands and every monthly target come from the workbook. Nothing in the file recommends a number.
- A custom theme in one file. Recolour the report by editing the registered theme JSON rather than 90-odd visuals. Product Development KPI Dashboard in Power BI
What’s Inside the Product Development KPI Dashboard in Power BI
The report has four pages you can see and two hidden tooltip pages (KPI Detail and Trend Detail, both 280 x 360) that appear when you hover a chart.
Page 1 – KPI Scorecard
The month picker, the four attribute slicers, the five header cards and the full KPI Scorecard table, sorted by MTD achievement so the weakest KPI sits at the top. In the sample month every KPI shows its own light: eight On Target, three At Risk and three Missed.
Page 2 – KPI Trend
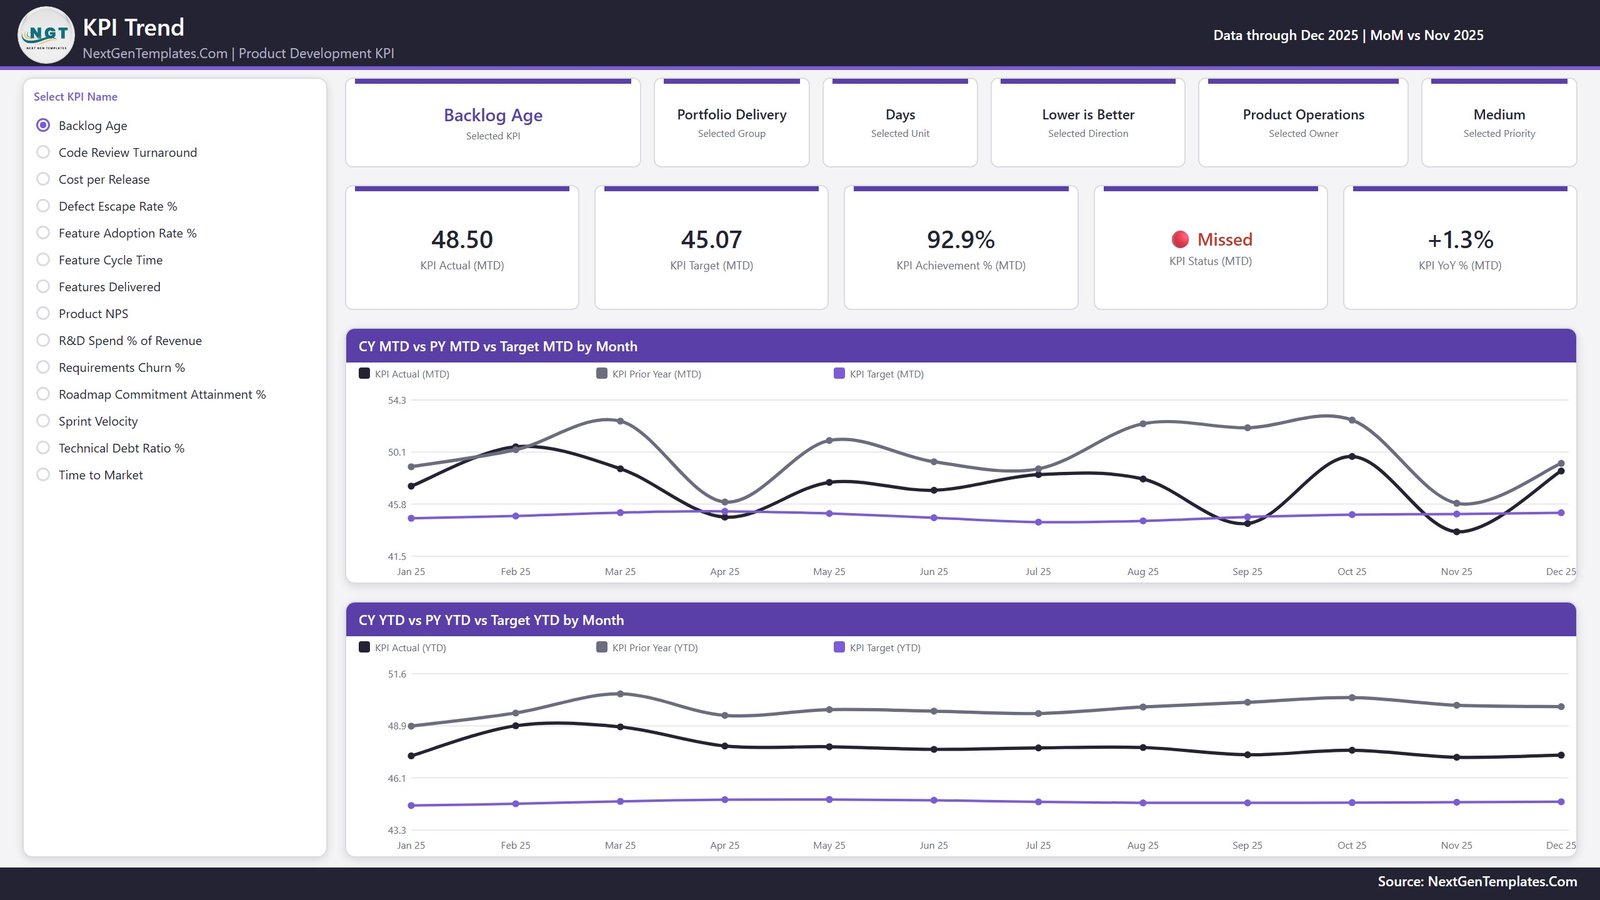
A list slicer of all 14 KPI names on the left. Pick one and the page redraws: six context cards (selected KPI, group, unit, direction, owner and priority), five value cards (actual, target, achievement, status and year-on-year change), then CY MTD vs PY MTD vs Target MTD by Month and CY YTD vs PY YTD vs Target YTD by Month as line charts across twelve months. Product Development KPI Dashboard in Power BI
Page 3 – KPI Definition
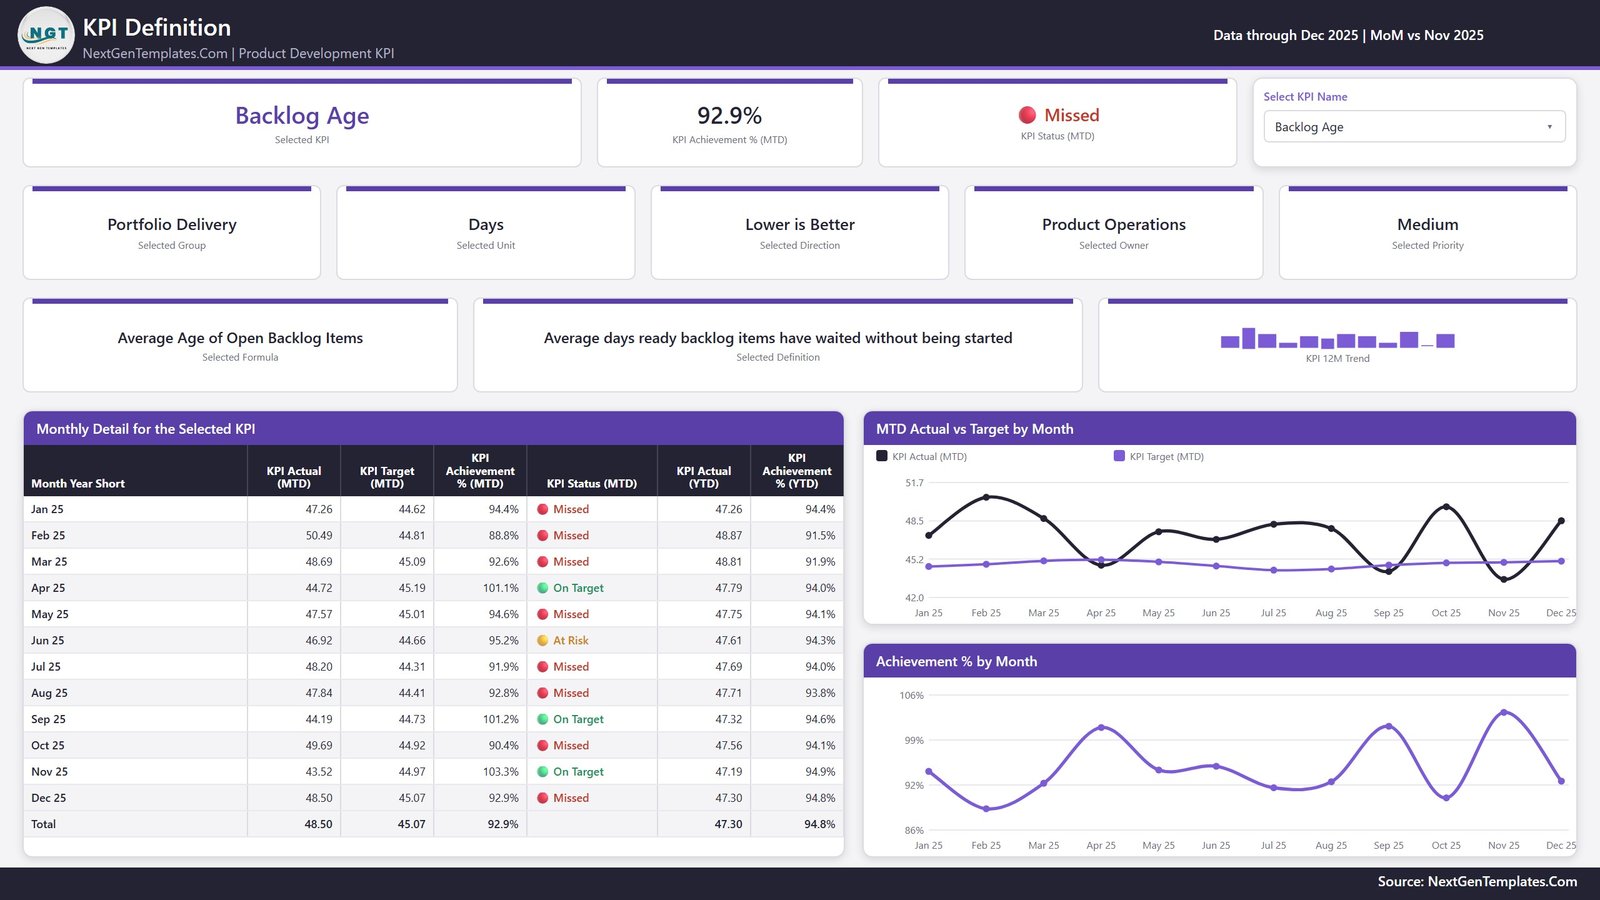
The same KPI selection, carried across by a synced slicer, plus the parts a reviewer always asks for: the Selected Formula, the plain-English Selected Definition, the owning team, the priority and a 12-month trend. Below sit the Monthly Detail for the Selected KPI table and two charts, MTD Actual vs Target by Month and Achievement % by Month. Note that this page is reached by the slicer, not by a right-click drillthrough – there is no drillthrough defined in this build.
Page 4 – Get More Templates
An in-file help and catalogue page. It carries the short customising notes – how the month picker works, how to swap in your own data, how UTB and LTB scoring behaves, where the theme lives – alongside links to other NextGenTemplates dashboards. It ships inside the .pbix so the guidance travels with the file. Product Development KPI Dashboard in Power BI
The data pack
Data.xlsx has four sheets. Read Me explains the layout. Input_ Target holds 168 rows of monthly MTD and YTD targets. Input_ Actual holds 336 rows of actuals for the current and prior year. KPI Definition holds the 14 KPIs across nine columns – group, name, unit, formula, definition, UTB/LTB type, owner and priority. Add a row there and the KPI appears everywhere; delete one and it disappears everywhere. All shipped figures are demo data.
Power BI Scorecard vs. Tableau or Qlik vs. a Paid Product Analytics SaaS – Where This Fits
| This template (Power BI) | Tableau or Qlik build | Paid product analytics SaaS | |
|---|---|---|---|
| Cost | 12.99 one time | Licence plus build time | Recurring per seat, per month |
| Platform | Power BI Desktop (free) | Tableau Desktop or Qlik Sense | Vendor’s web app |
| Setup time | Open, paste your numbers, refresh | Model and design from scratch | Onboarding plus data plumbing |
| Real-time team collaboration | Via Power BI Service if you publish it | Via that vendor’s server | Built in |
| Mobile access | Power BI mobile app once published | Vendor mobile app | Built in |
| Customizable fields | Every KPI, target, owner and threshold | Whatever you build | Only what the vendor exposes |
| Share with link | Yes, after publishing to your workspace | Yes, on that server | Yes |
| Year-1 cost at 5 users | 12.99 plus any Power BI licences you already hold | Several hundred and up | Typically four figures and up |
| Data source | An Excel workbook you own and edit | Whatever you connect | The vendor’s own instrumentation |
| Editable file you keep | Yes – the .pbix is yours | Yes | No |
Who This Template Is For – and Who It’s Not For
It is for a head of product or engineering who already collects these numbers and wants one page to review them; a PMO or product operations analyst preparing a monthly release or portfolio review; an R&D manager reporting spend and delivery to a leadership team; and anyone who wants a Power BI scorecard they can rename and recolour rather than build from an empty canvas.
It is not for anyone expecting a live connection to an issue tracker – it does not connect to Jira, Azure DevOps, Asana, Linear or any other tool, and no connector is included. It is not a project plan, a sprint board or a ticket system. It does not measure anything on its own: every figure is one you type in. It will not tell you what a good cycle time or velocity is, because it ships no benchmarks. And it is not a compliance or design-control record for any standard. Product Development KPI Dashboard in Power BI
How to Use the Product Development KPI Dashboard in Power BI
- Unzip the download. You get the .pbix, Data.xlsx and the PDF user manual.
- Open Data.xlsx and read the Read Me sheet first.
- On the KPI Definition sheet, replace the 14 sample KPIs with your own – keep the nine columns, and set each one’s unit, formula text, owner, priority and UTB/LTB direction.
- Fill Input_ Target with one target row per KPI per month, and Input_ Actual with your actuals. Both take MTD and YTD values.
- Open the .pbix in Power BI Desktop, point the query at your copy of the workbook and click Refresh.
- Pick your month on the scorecard. Use the KPI Group, Owner, Priority and Direction slicers to narrow the review.
- Select a KPI on the KPI Trend page; the KPI Definition page follows the same selection through its synced slicer.
- To restyle, edit the registered theme JSON inside the report rather than each visual.
Real-World Use Cases
Priya, Director of Product at a 40-person software company. She runs a monthly product review. Rather than rebuilding slides, she updates two sheets, refreshes, and opens the scorecard on the screen. The three Missed lights set the agenda; the KPI Trend page answers “is this one month or a pattern?” in a click.
Daniel, PMO analyst in a hardware business. He reports roadmap commitment attainment and backlog age to a steering group. The Owner slicer lets him show each function only its own KPIs, and the KPI Definition page settles the recurring argument about how a metric is calculated, because the formula is on screen next to the number.
Aisha, R&D finance partner. She tracks cost per release and R&D spend as a share of revenue beside the delivery metrics, so the spend conversation and the output conversation happen off one page instead of two decks. Product Development KPI Dashboard in Power BI
Frequently Asked Questions
Does this connect to Jira or my issue tracker?
No. There is no connector to Jira, Azure DevOps, Asana, Linear, GitHub or any other tracker, and none is included or implied. The dashboard reads one Excel workbook that you fill in yourself. If you want an automated feed you would need to build that export separately.
Are the sample numbers real?
No. Every figure in the file is demo data, generated to show the layout working across twelve months and a prior year. Delete it and enter your own.
Does it tell me what my targets should be?
No. Targets, thresholds and traffic-light bands are all placeholders you set. The template carries no benchmark velocity, cycle time, defect rate or spend ratio, and it does not endorse any delivery methodology.
Can I add or remove KPIs?
Yes. The KPIs come from the KPI Definition sheet, so adding a row adds the KPI to the scorecard, the trend page and the definition page after a refresh. Nothing is hard-coded to 14.
What software do I need?
Power BI Desktop, which Microsoft provides free, plus Excel or any tool that can save an .xlsx. You can publish the report to the Power BI Service if your organisation licences it.
Is this the same as your Product Development Dashboard in Power BI?
No – they are different templates. This one is a KPI scorecard: a month picker, a KPI-per-row table, traffic lights and per-KPI trend and definition pages. The Product Development Dashboard in Power BI is an analytical report built around charts and category breakdowns of a transaction-level table. Many buyers use both.
Does it make my organisation compliant with any standard?
No. It is a reporting file. It makes no ISO/IEC, design-control, audit or certification claim, and it should not be relied on as a controlled quality record.
About the Author
Built by PK – Microsoft Certified Professional with 15+ years of Excel, Google Sheets, and Power BI experience. Founder of NextGenTemplates, reaching 300K+ subscribers across YouTube channels. Every template is hand-built and tested before release.
Explore Related Templates
- Product Development Dashboard in Power BI – the analytical companion to this scorecard.
- Product Development KPI Scorecard in Excel – the same scorecard idea for teams without Power BI.
- Research and Development Dashboard in Power BI – for R&D portfolio and project reporting.
- Product Development Dashboard in Google Sheets – a browser-based alternative.
- Retail and E-commerce Product Development KPI Dashboard in Excel – the retail-flavoured scorecard.
- Browse every Power BI KPI Dashboard template, or the wider Power BI catalogue.
Buy once, keep the file. Download the .pbix, the data pack and the manual, edit anything you like, and use it on as many of your own reports as you need. Read the full walkthrough on the Product Development KPI Dashboard in Power BI blog post.
Last updated: 17 August 2026.






























Reviews
There are no reviews yet.