

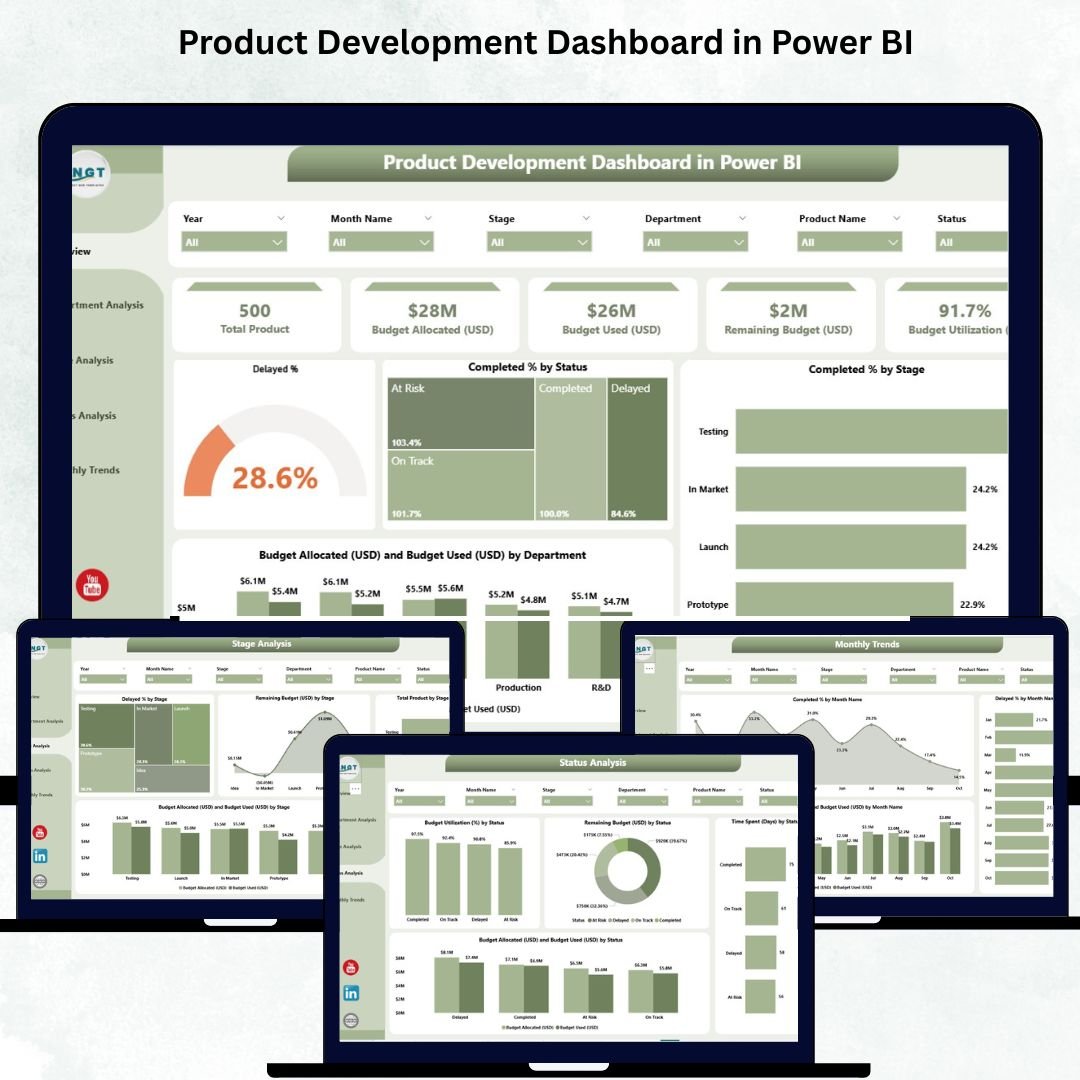

The Product Development Dashboard in Power BI is a game-changing analytics solution designed for organizations that want to accelerate innovation, improve efficiency, and manage projects smarter. In a world where speed and precision define success, this dashboard brings real-time visibility to your entire product lifecycle — from concept to launch.
Built in Microsoft Power BI, it connects seamlessly with Excel data sources to provide a dynamic, interactive, and data-driven overview of product progress, budgets, and departmental performance. Whether you oversee R&D, production, or marketing, this dashboard helps teams stay on schedule, within budget, and aligned with strategic goals.
✨ Key Features of the Product Development Dashboard in Power BI
✅ 📊 Overview Page – Complete Project Snapshot
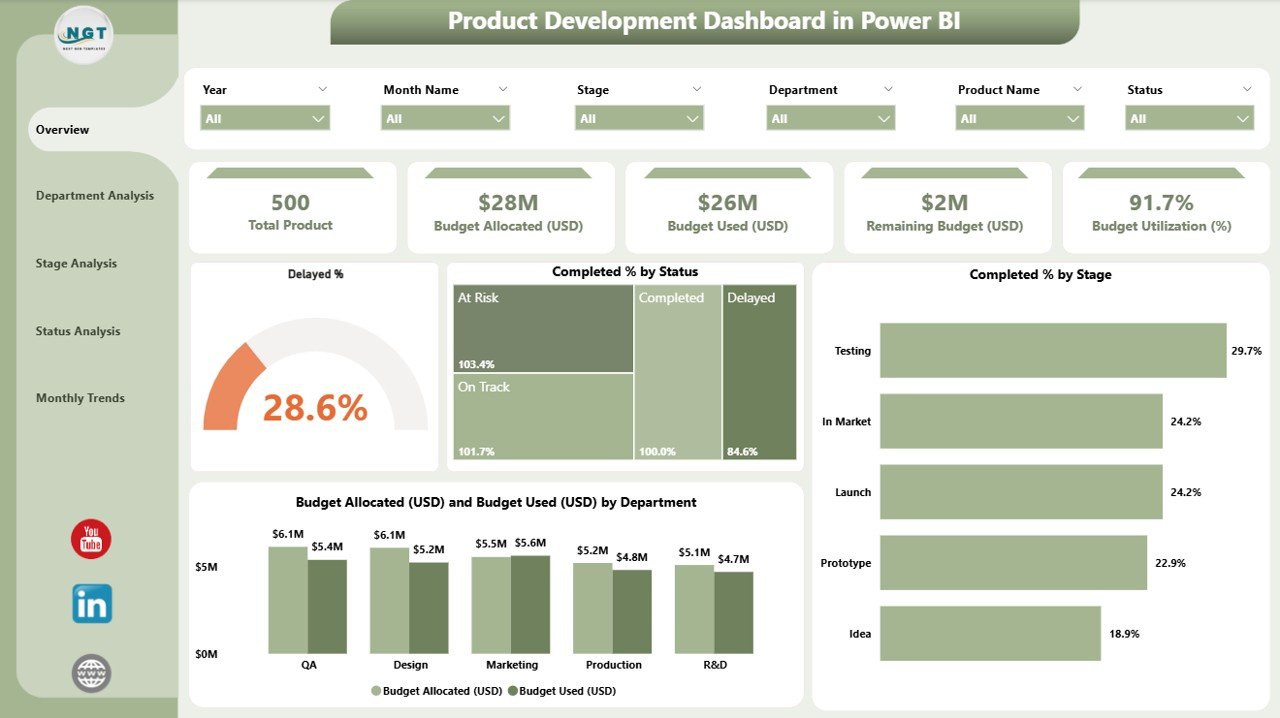
Get an at-a-glance summary of all active projects with interactive visuals.
Includes five key performance cards:
Delayed Percentage (%)
Completed Percentage (%)
Total Projects
Budget Allocated (USD)
Budget Used (USD)
Charts Displayed:
Delayed % by Status
Completed % by Stage
Budget Allocated vs. Budget Used by Department
Project Distribution by Status
💡 Perfect for executives and managers who need quick insights into development efficiency and cost control.
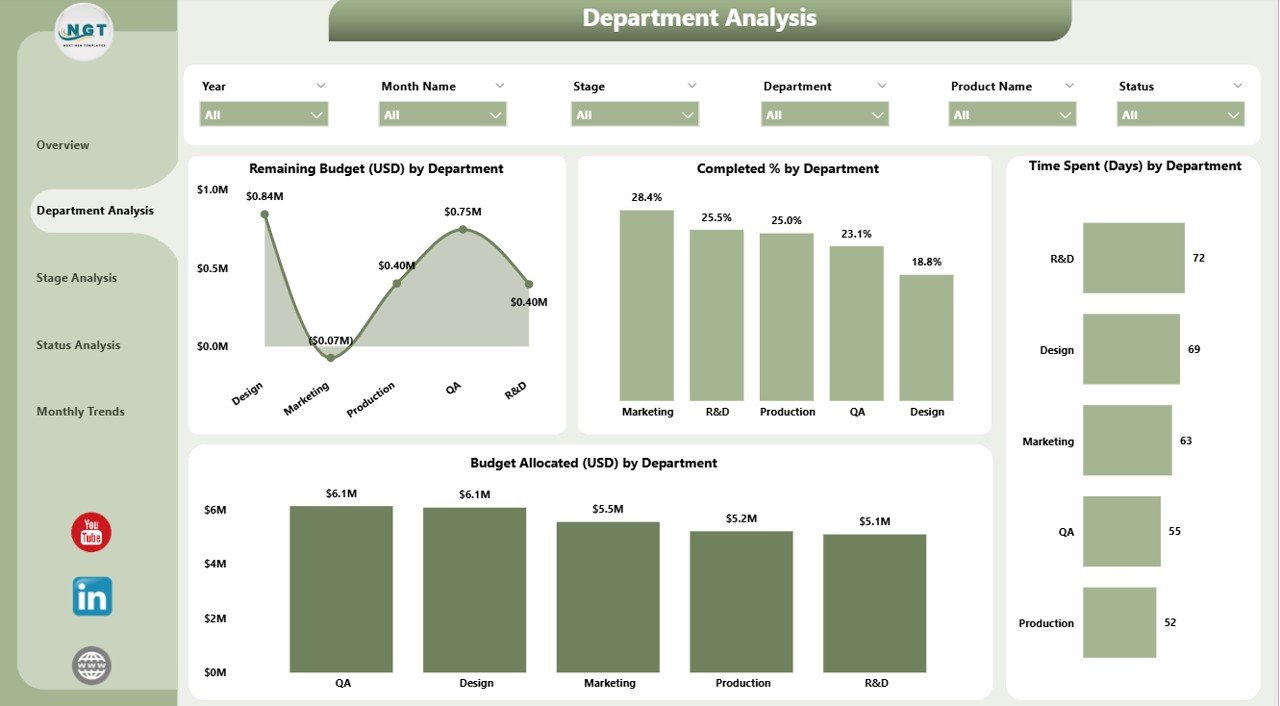
✅ 🏢 Department Analysis Page – Compare Department Performance
Understand how different departments perform in terms of time, cost, and outcomes.
Visuals include:
Remaining Budget (USD) by Department
Completed % by Department
Time Spent (Days) by Department
Budget Allocation (USD) by Department
📈 Identify departments excelling in delivery and spot areas of overspending or inefficiency instantly.
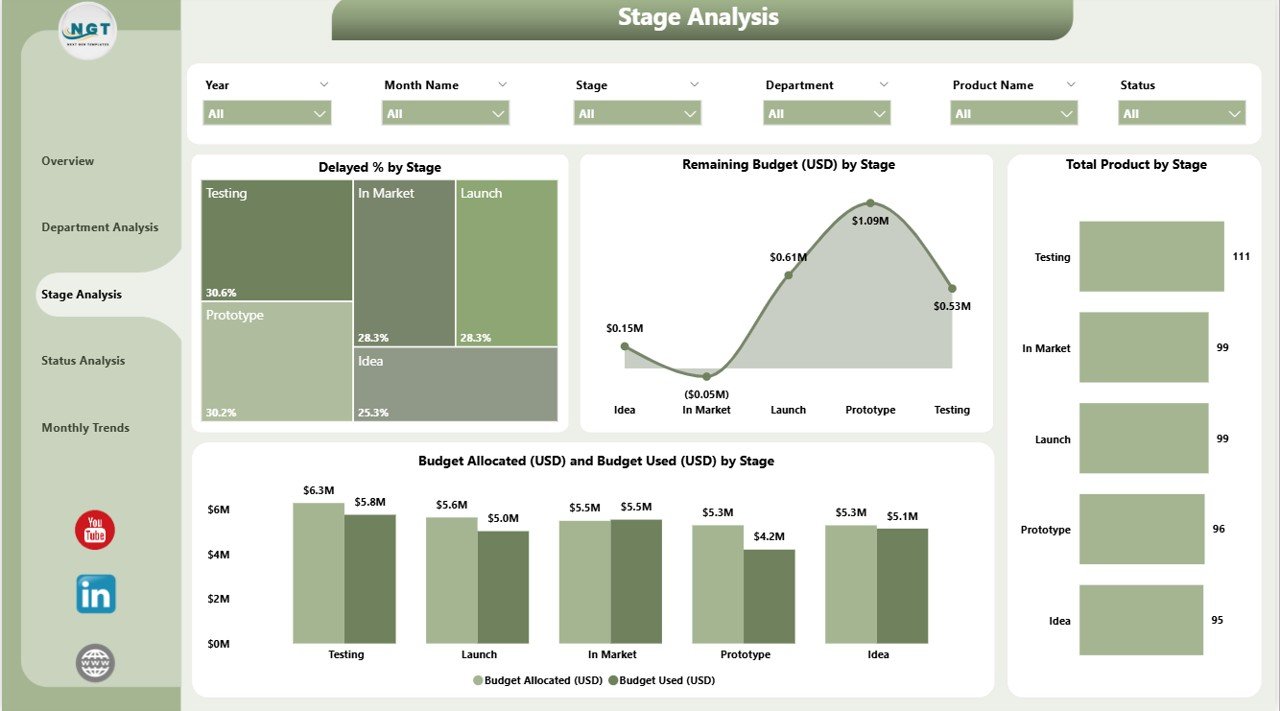
✅ 🧩 Stage Analysis Page – Track Each Development Phase
Monitor product performance through every development stage — from idea to launch.
Charts include:
Delayed % by Stage
Remaining Budget (USD) by Stage
Total Products by Stage
Budget Used (USD) by Stage
⚙️ Pinpoint where bottlenecks occur and allocate resources efficiently across stages.
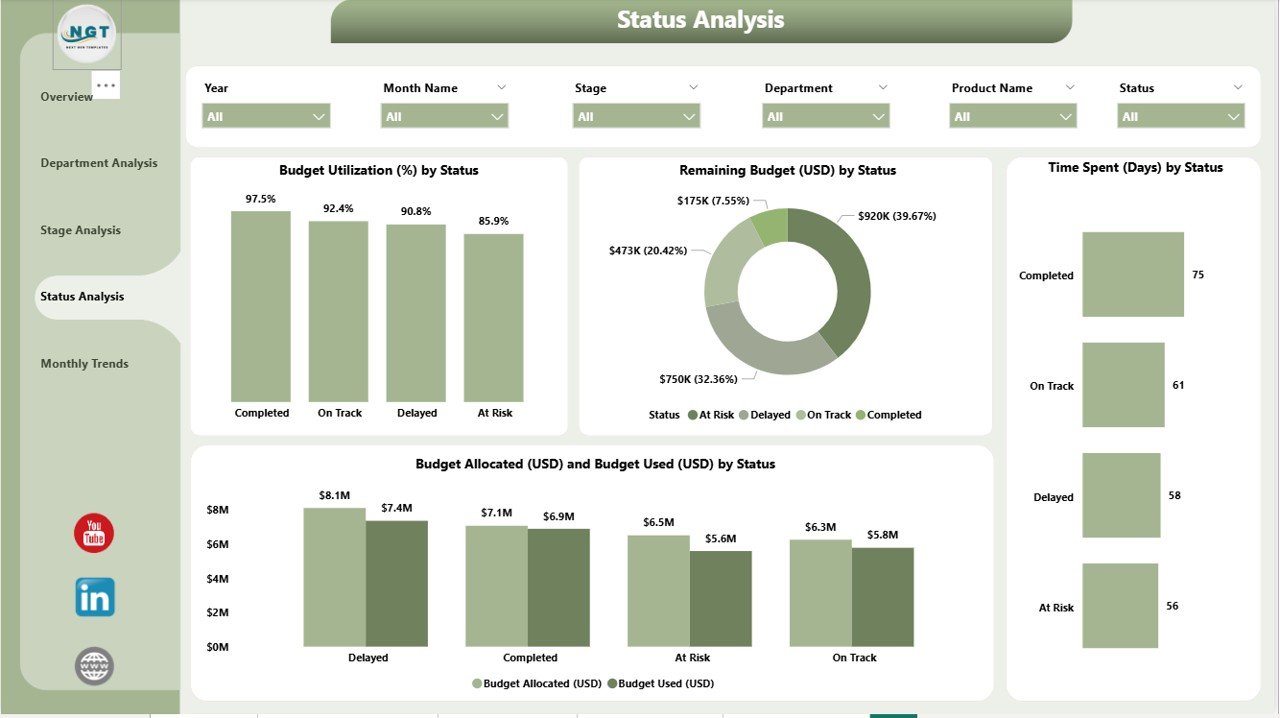
✅ 📌 Status Analysis Page – Monitor Real-Time Progress
Analyze projects based on their current status (In Progress, Completed, Delayed, Pending Approval).
Visuals include:
Budget Utilization (%) by Stage
Remaining Budget (USD) by Status
Time Spent (Days) by Status
Budget Allocated vs. Budget Used (USD) by Stage
🧭 Detect risks early and make informed adjustments to keep every project on track.
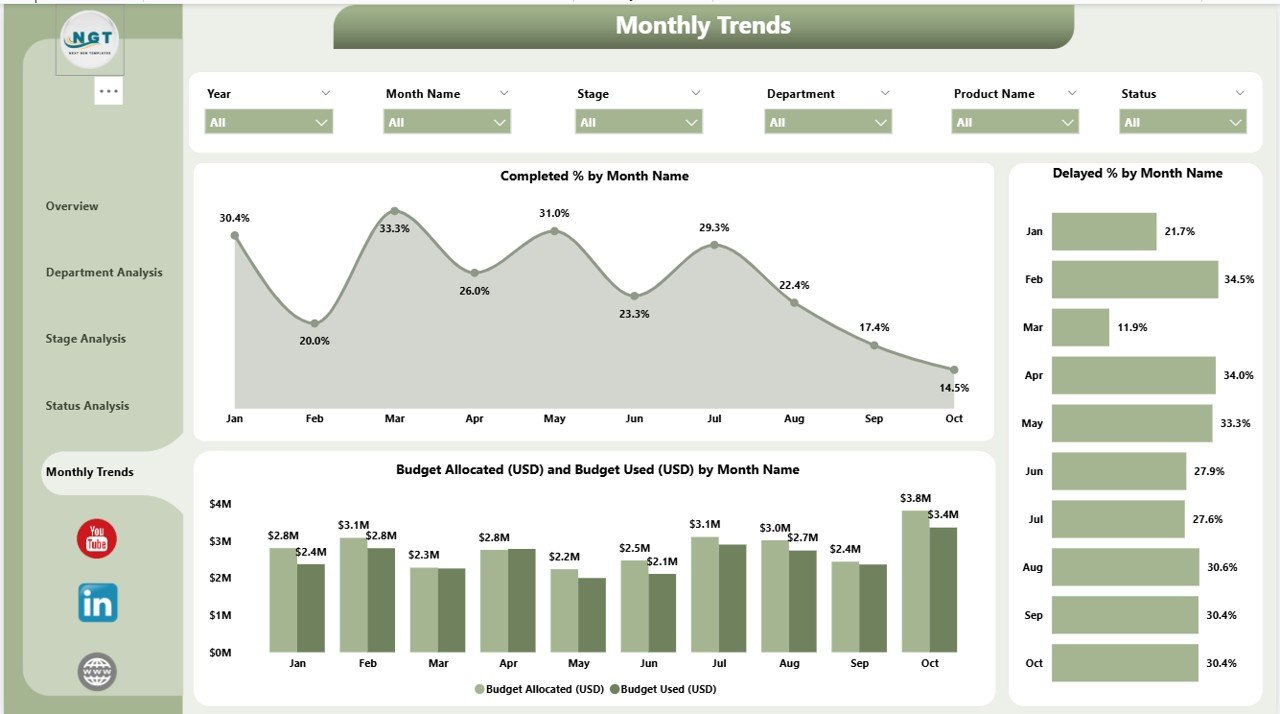
✅ 📅 Monthly Trends Page – Time-Based Performance Overview
Track month-over-month trends to understand productivity, efficiency, and cost movement.
Charts include:
Completed % by Month
Delayed % by Month
Budget Allocated vs. Budget Used (USD) by Month
📆 Use trend analysis to forecast upcoming project needs, optimize schedules, and balance budgets.
📦 What’s Inside the Dashboard
📁 Power BI (.PBIX) File – Fully interactive dashboard with filters and slicers.
📊 Excel Data Source File – Cleanly structured with project, budget, and status details.
⚙️ Auto-Refresh Setup – Just update your Excel file, and the visuals refresh automatically.
💡 No complex setup needed — plug in your data and start monitoring instantly!
👥 Who Can Benefit from This Dashboard
🏢 Product Managers – Gain total visibility over project timelines and costs.
💼 R&D Teams – Track innovation projects and resource usage.
🏭 Manufacturing Units – Analyze production stages and efficiency.
💰 Finance Teams – Control budget allocation and monitor spending.
📊 Executives & Stakeholders – Get strategic insights through visual summaries.
💡 Advantages of the Product Development Dashboard in Power BI
✅ Centralized Data Visibility – Access all key metrics from one dashboard.
✅ Real-Time Insights – Track projects as they evolve with automatic updates.
✅ Enhanced Collaboration – Ensure all departments work from the same dataset.
✅ Smarter Budget Control – Compare allocated vs. used budgets instantly.
✅ Improved Time Management – Identify and resolve delays proactively.
✅ Customizable & Scalable – Tailor KPIs and visuals to your business needs.
⚡ Turn your product development process into a transparent, data-driven workflow.
🧠 Best Practices for Using the Dashboard
✔️ Keep your Excel dataset clean and updated.
✔️ Use slicers to filter data by department, stage, or project status.
✔️ Set up scheduled data refreshes for real-time insights.
✔️ Highlight critical KPIs with conditional formatting.
✔️ Share your Power BI report securely via Power BI Service.
These practices ensure consistent, reliable, and actionable insights from your dashboard.
🔗 Click here to read the Detailed Blog Post
🎥 Visit our YouTube channel to learn step-by-step video tutorials
Watch the step-by-step video tutorial:
Compatibility and Requirements
- Built for Power BI Desktop, which is a free download from Microsoft: Get Power BI Desktop.
- The download includes the .pbix file and an Excel data source file. Update the Excel file and refresh the report to see new data.
Frequently Asked Questions
How many report pages does it have?
Five: Overview, Department Analysis, Stage Analysis, Status Analysis and Monthly Trends.
Which cards are on the Overview page?
Delayed Percentage, Completed Percentage, Total Projects, Budget Allocated (USD) and Budget Used (USD).
Which project statuses does it use?
In Progress, Completed, Delayed and Pending Approval. The Status Analysis page breaks down budget and time spent by each one.
Can I filter the report?
Yes. Use the slicers to filter by department, stage or project status.
Related Product Development Templates
- Product Development Dashboard in Excel: the same topic for Excel users
- Product Development Dashboard in Google Sheets: a browser-based version
- Product Development KPI Dashboard in Excel: track product development KPIs against targets
- R&D KPI Dashboard in Excel: KPIs for research and development teams
- Power BI Dashboard Mega Collection: 15 Power BI dashboards in one bundle
Browse all Power BI dashboards or the Excel project management templates.




Reviews
There are no reviews yet.