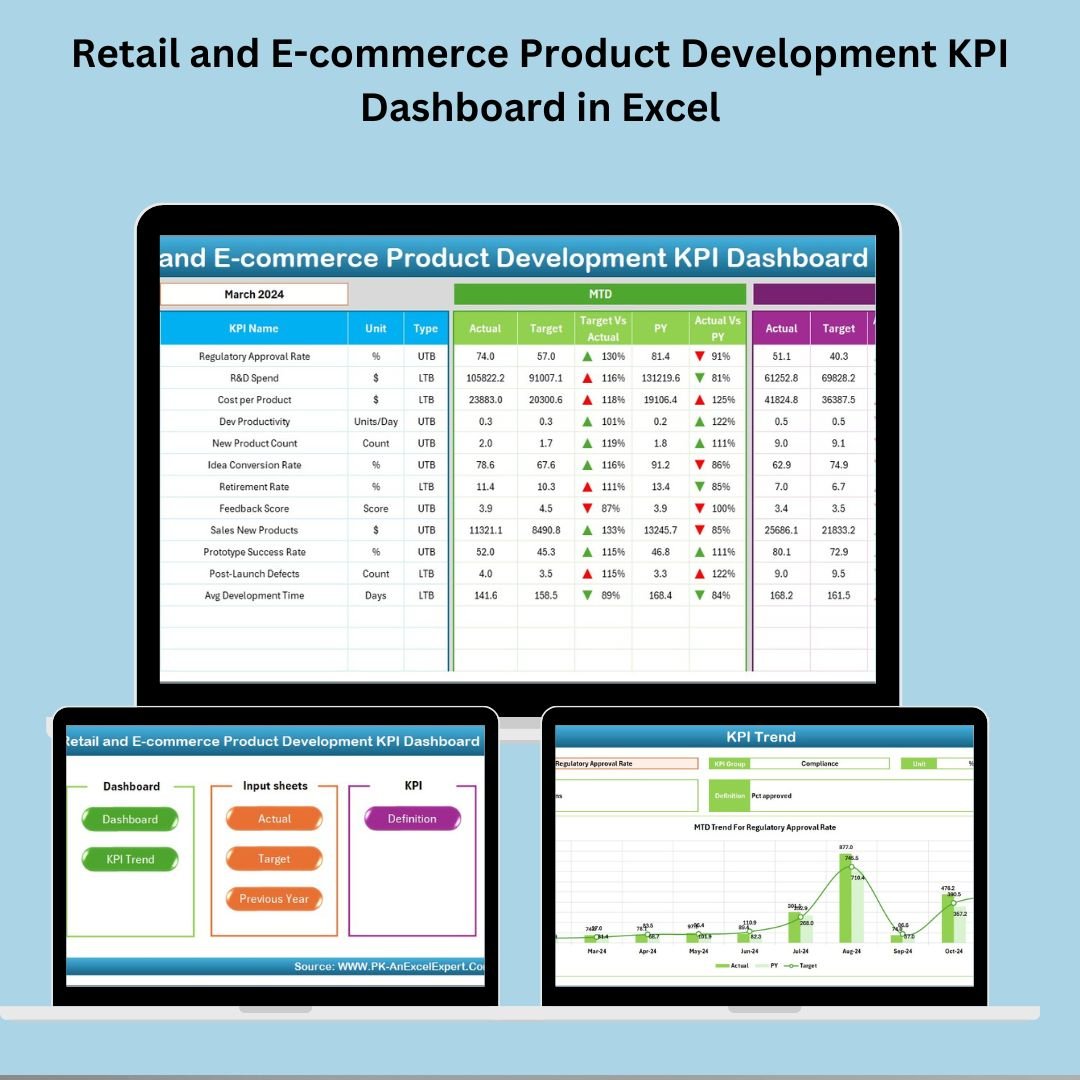
Introducing the Retail and E-commerce Product Development KPI Dashboard in Excel — your ultimate all-in-one Excel dashboard to streamline and optimize product lifecycle performance! In today’s fast-moving e-commerce and retail space, success is driven by metrics. This powerful dashboard template empowers you to track development timelines, feature delivery, budget variance, and ROI — all in real time, using just Excel. No complex BI tools or coding needed! 🎯📊
This template is perfect for product teams, analysts, and decision-makers who need to stay ahead with agile, data-informed development strategies. Whether you’re launching new SKUs, refining product features, or reviewing performance metrics, this tool brings everything into focus — fast, visual, and easy to use! 🚀
🔑 Key Features of Retail and E-commerce Product Development KPI Dashboard in Excel

✅ Interactive Dashboard with Real-Time KPI Updates
Choose any month and instantly view MTD and YTD performance against targets and past results.
✅ Dynamic Charts with Conditional Formatting
Up/down arrows and visual cues help you interpret performance at a glance.
✅ Fully Editable & Excel-Only
Built using PivotTables and formulas—no macros, no external tools. Just plug-and-play!
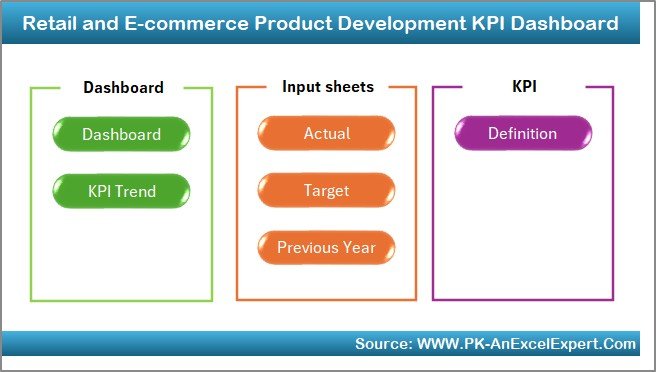
✅ Intuitive Navigation
Six-clickable buttons guide you through Dashboard, Trend, Data Input, Targets, and Definitions.
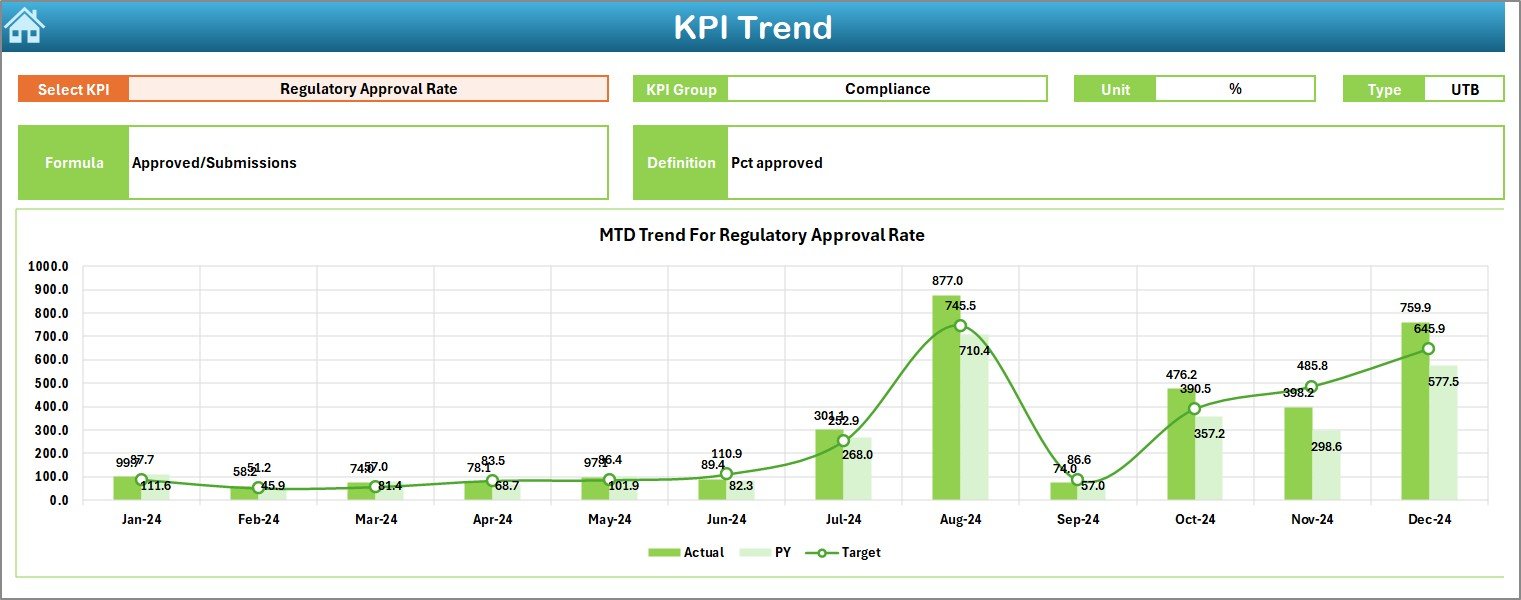
✅ Pivot-Driven Trend Analysis
Slice and drill into each KPI’s monthly and yearly patterns for smarter sprint planning.
📂 What’s Inside the Product Development KPI Dashboard?
This Excel template includes 7 essential worksheets, seamlessly connected for full KPI monitoring:
1️⃣ Home Sheet – One-click buttons for effortless navigation
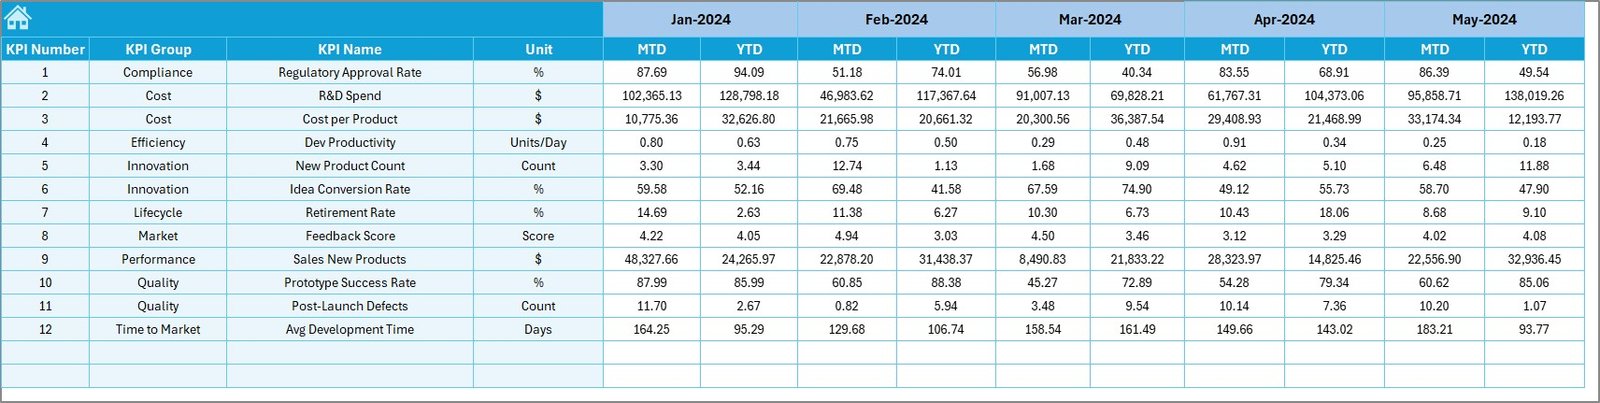
2️⃣ Dashboard Sheet – Visual MTD/YTD summary with smart icons
3️⃣ KPI Trend Sheet – Track a single KPI across months and years
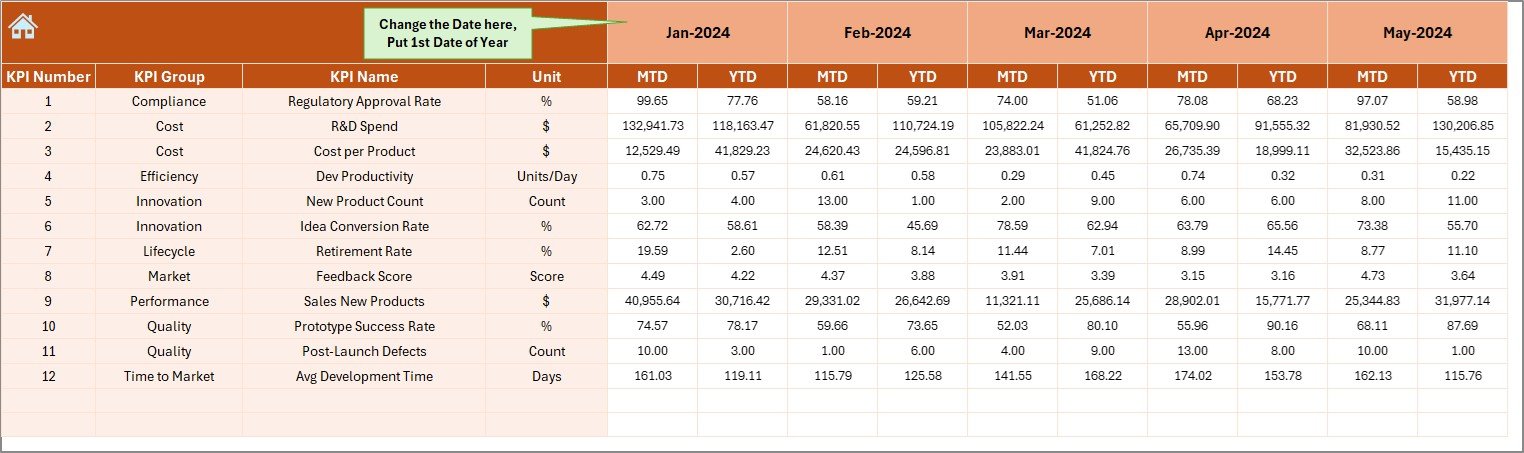
4️⃣ Actual Numbers Input – Monthly MTD/YTD entries with auto-shifting month logic
5️⃣ Target Sheet – Set clear, editable targets for each KPI
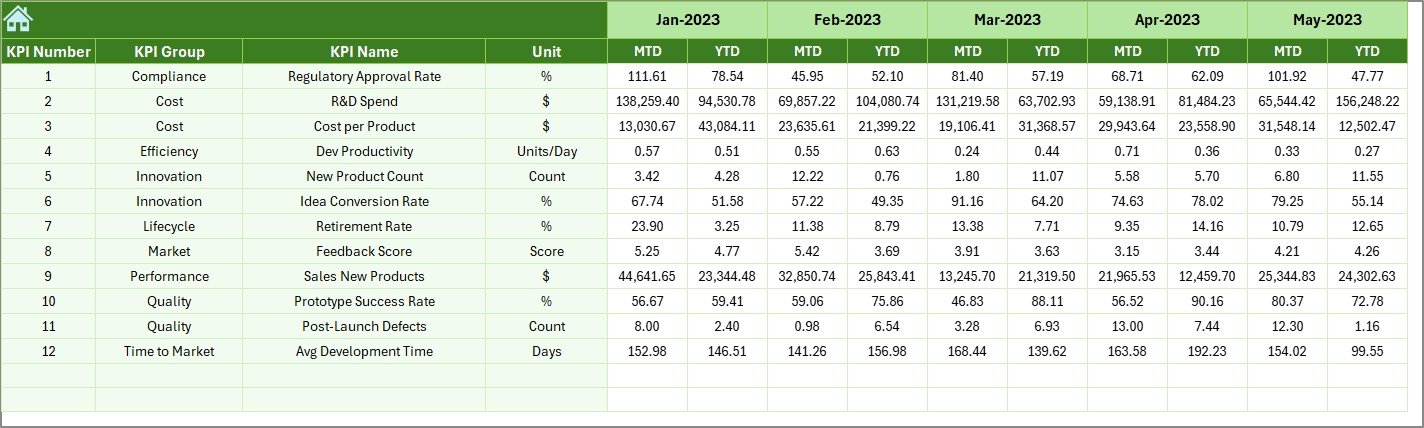
6️⃣ Previous Year Sheet – Compare current vs. historical data
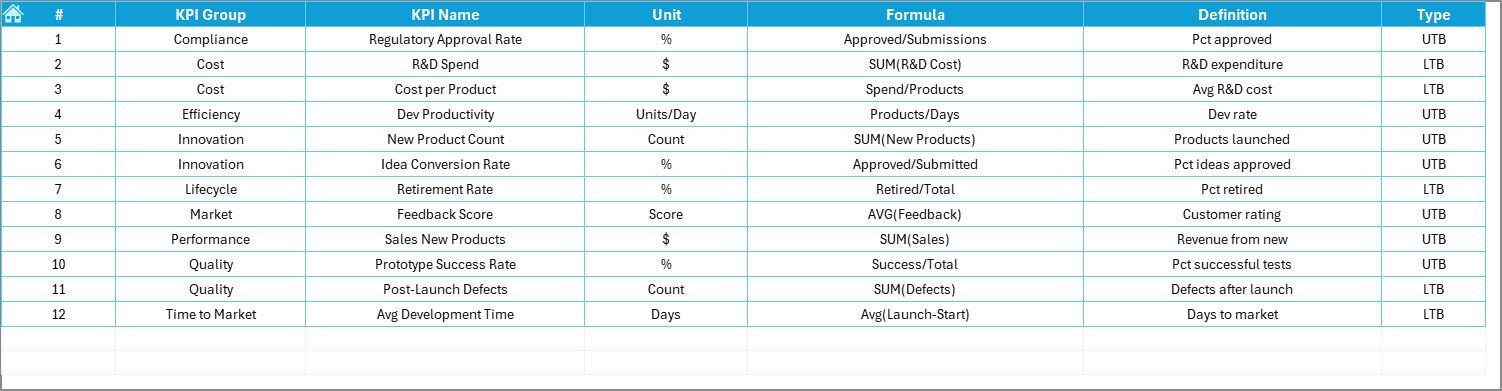
7️⃣ KPI Definition Sheet – Clear formulas, units, and descriptions for all KPIs
All components are linked and dynamically updated using Excel formulas and PivotTables—no VBA required.
🛠️ How to Use the Dashboard
-
Download the Template – Open it in Microsoft Excel
-
Customize the Fiscal Start Month – Update cell E1 on the Input sheet
-
Enter Monthly Data – Use Actual, Target, and PY sheets
-
View Results Instantly – Select a month on the Dashboard and analyze
-
Track Trends – Use the KPI Trend sheet for detailed performance breakdown
-
Adjust KPI List – Add/remove rows in the Definition and Input sheets as needed
It’s that simple! Get up and running in minutes. 🔧📥
👥 Who Can Benefit from This KPI Dashboard?
🎯 Product Managers – Track product development cycles and launch timelines
📊 Analysts & BI Teams – Monitor development cost variance and sprint performance
🛒 Retail & E-commerce Leaders – Get visibility into ROI and feature delivery rates
🧩 Cross-Functional Teams – Align marketing, dev, ops, and finance with shared KPIs
💡 Startups & SMEs – Save costs while gaining enterprise-level insights using Excel
👉 Click here to read the Detailed blog post
🔗 Visit our YouTube channel to learn step-by-step video tutorials


Reviews
There are no reviews yet.