

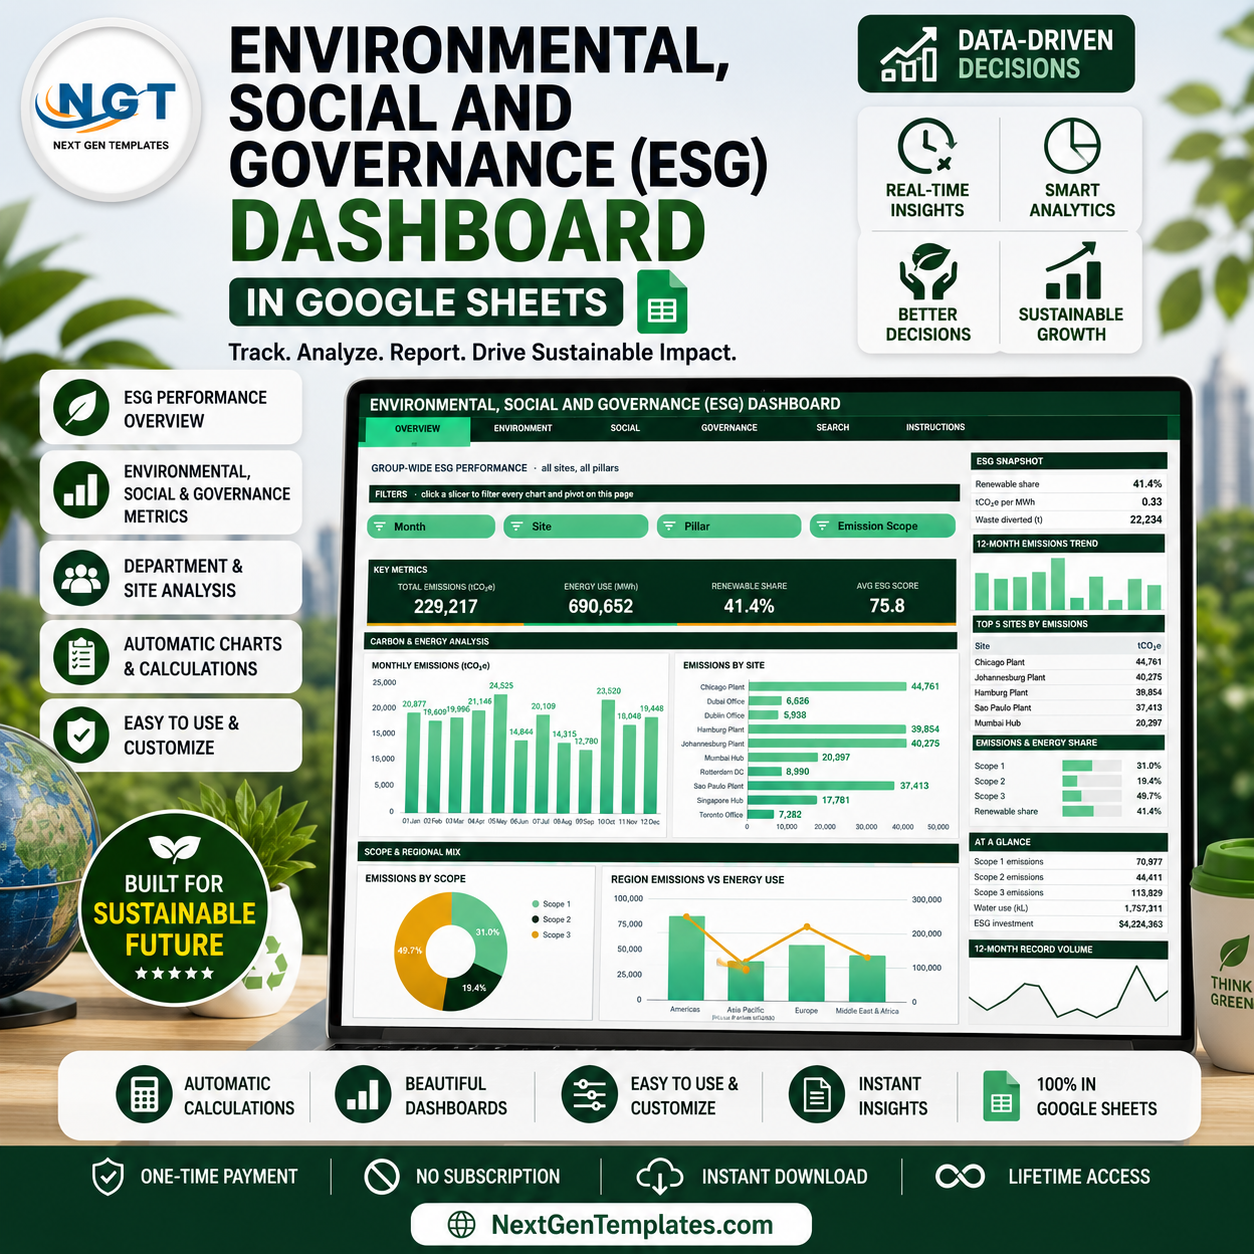
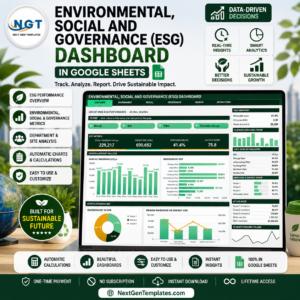
The Environmental, Social, and Governance (ESG) Dashboard in Google Sheets turns 500 sample ESG submissions – spread across 10 sites, 4 regions, 7 departments and 12 ESG categories – into six linked pages you can read in about a minute. The sample data totals 229,217 tCO2e of emissions, 690,652 MWh of energy, 105,572 training hours and $4,224,363 of community investment. Swap those rows for your own and every KPI, pivot table and chart follows. It is built on native Google Sheets pivot tables and slicers, so it stays fast as the data set grows. NextGenTemplates reaches 300K+ subscribers across its YouTube channels and every template is hand-built and tested before release. Instant download, lifetime access, and a copy link that drops an editable version straight into your own Drive.
A note on scope: this is a tracking and reporting workbook. It organises the ESG numbers your teams already collect and shows them clearly. It does not certify, audit, assure or file anything on your behalf, and it is not a substitute for advice from your own reporting or legal advisers.
Key Features of the Environmental, Social, and Governance (ESG) Dashboard
- Six pages, one navigation strip. Overview, Environment, Social, Governance, Search and Instructions. The tab strip sits at the top of every page, so moving between pillars is a single click.
- Four slicers on every analysis page. Overview filters by Month, Site, Pillar and Emission Scope; Environment by Site, Emission Scope, Month and ESG Category; Social by Department, Region, Site and Month; Governance by Pillar, ESG Category, Status and ESG Lead.
- 16 KPI cards. Four per analysis page – for example Total Emissions (tCO2e), Energy Use (MWh), Renewable Share and Avg ESG Score on the Overview.
- 16 charts driven by real pivot tables. Each chart reads a pivot parked to the right of its page, so you can scroll across and inspect the numbers behind any visual.
- Scope 1, 2 and 3 split. Emissions break down by scope, by site, by region and by month, with a stacked column that puts all three scopes on one axis per site.
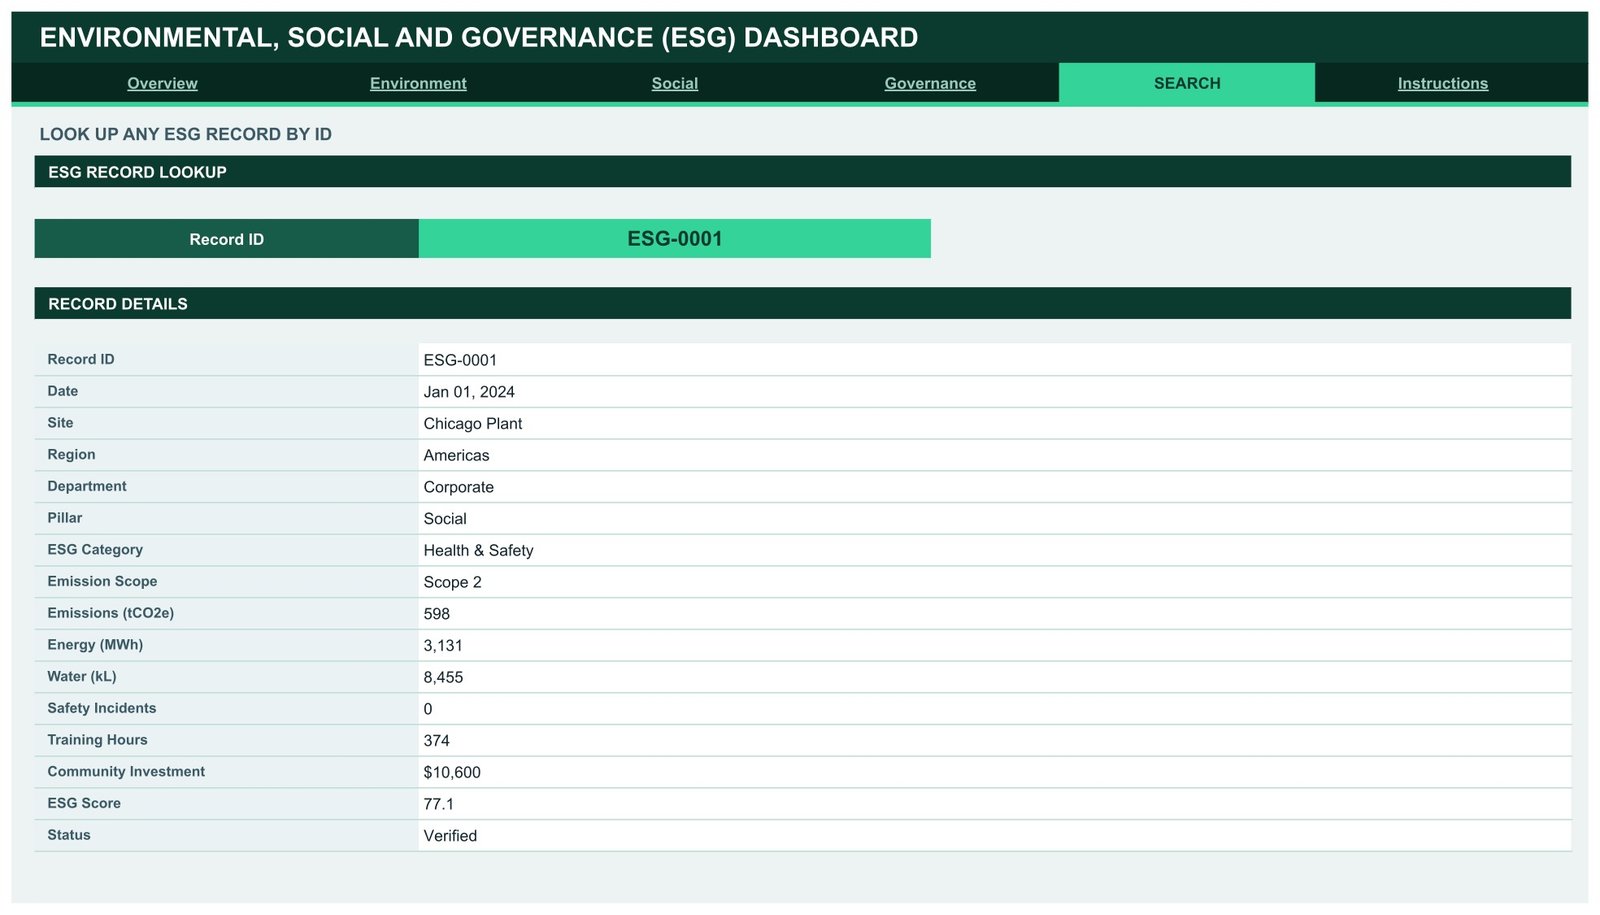
- Record-level lookup. The Search page returns all 16 fields for any single Record ID – date, site, region, department, pillar, ESG category, scope, emissions, energy, water, safety incidents, training hours, community investment, ESG score and review status.
- 1,000-row auto-expand. Pivots, slicers and formulas already cover rows up to 1001. Paste new submissions anywhere in that range and the dashboard updates itself.
- Editable theme. One palette block at the top of the bundled Apps Script controls the whole design – ink #0B3B2E, accent #34D399 and gold #E0A32E – so rebranding is a three-value edit.
What’s Inside the Environmental, Social, and Governance (ESG) Dashboard
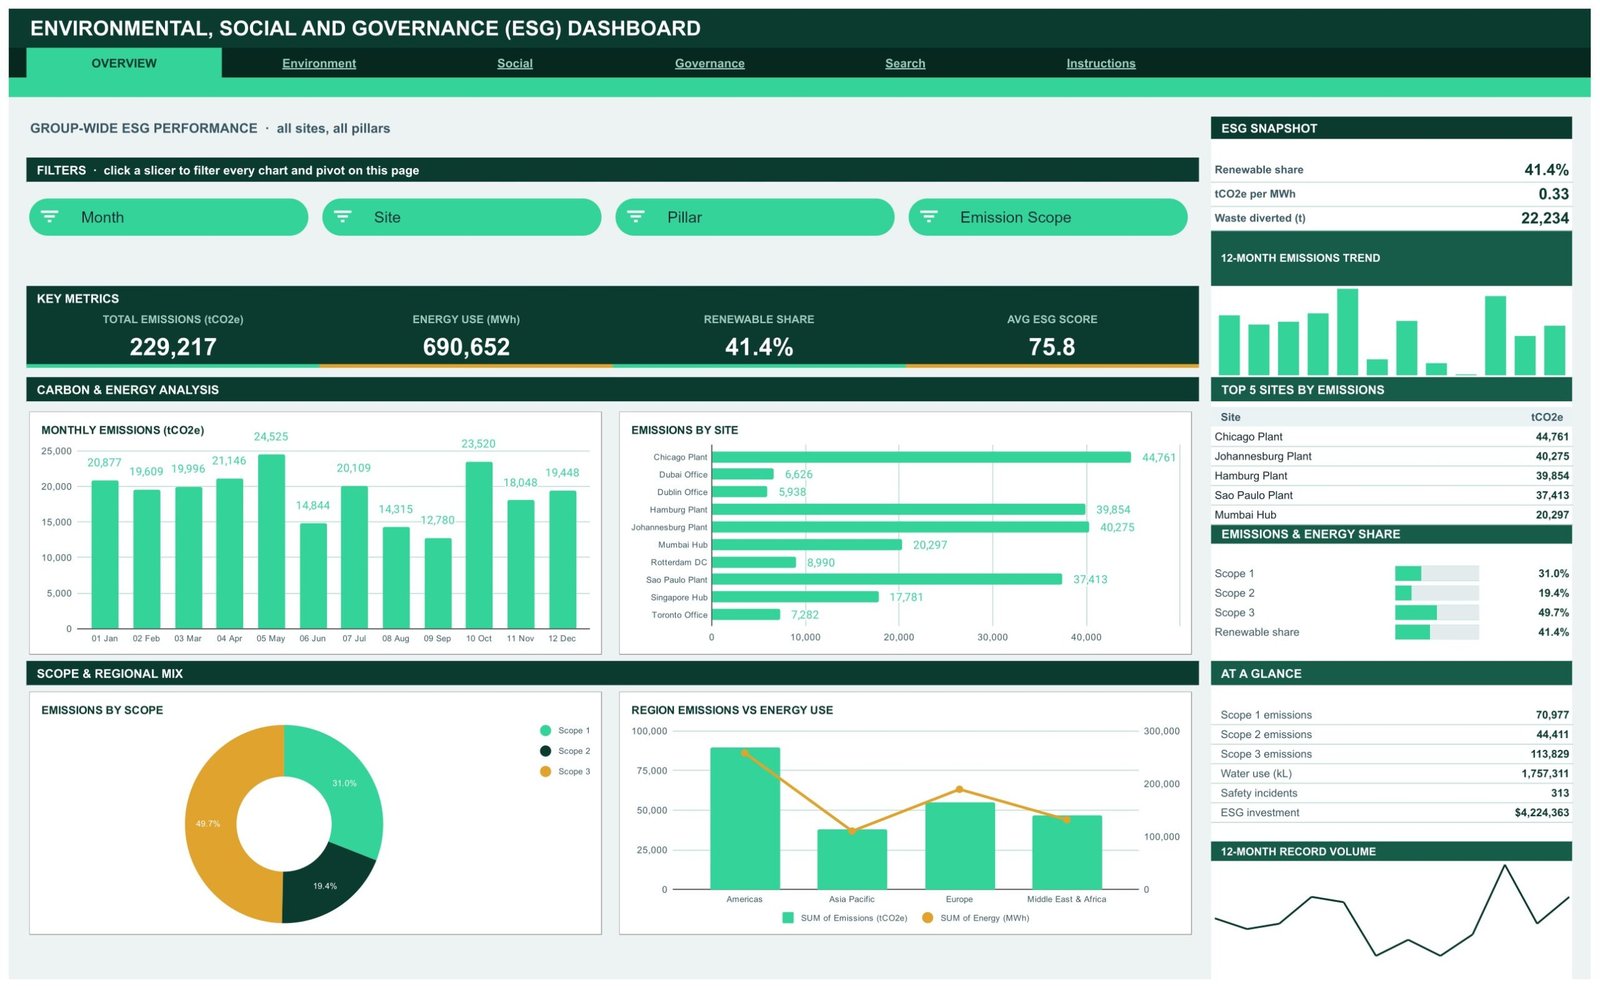
Overview – Group-Wide ESG Performance
The landing page reports all sites and all three pillars together. Four KPI cards carry Total Emissions, Energy Use, Renewable Share and Avg ESG Score, and the charts below cover Monthly Emissions by Month, Emissions by Site, Emissions by Scope and Region Emissions vs Energy Use. A right-hand rail adds an ESG Snapshot, a 12-month emissions trend, Top 5 Sites by Emissions and an At a Glance list running from Scope 1 emissions down to total ESG investment.
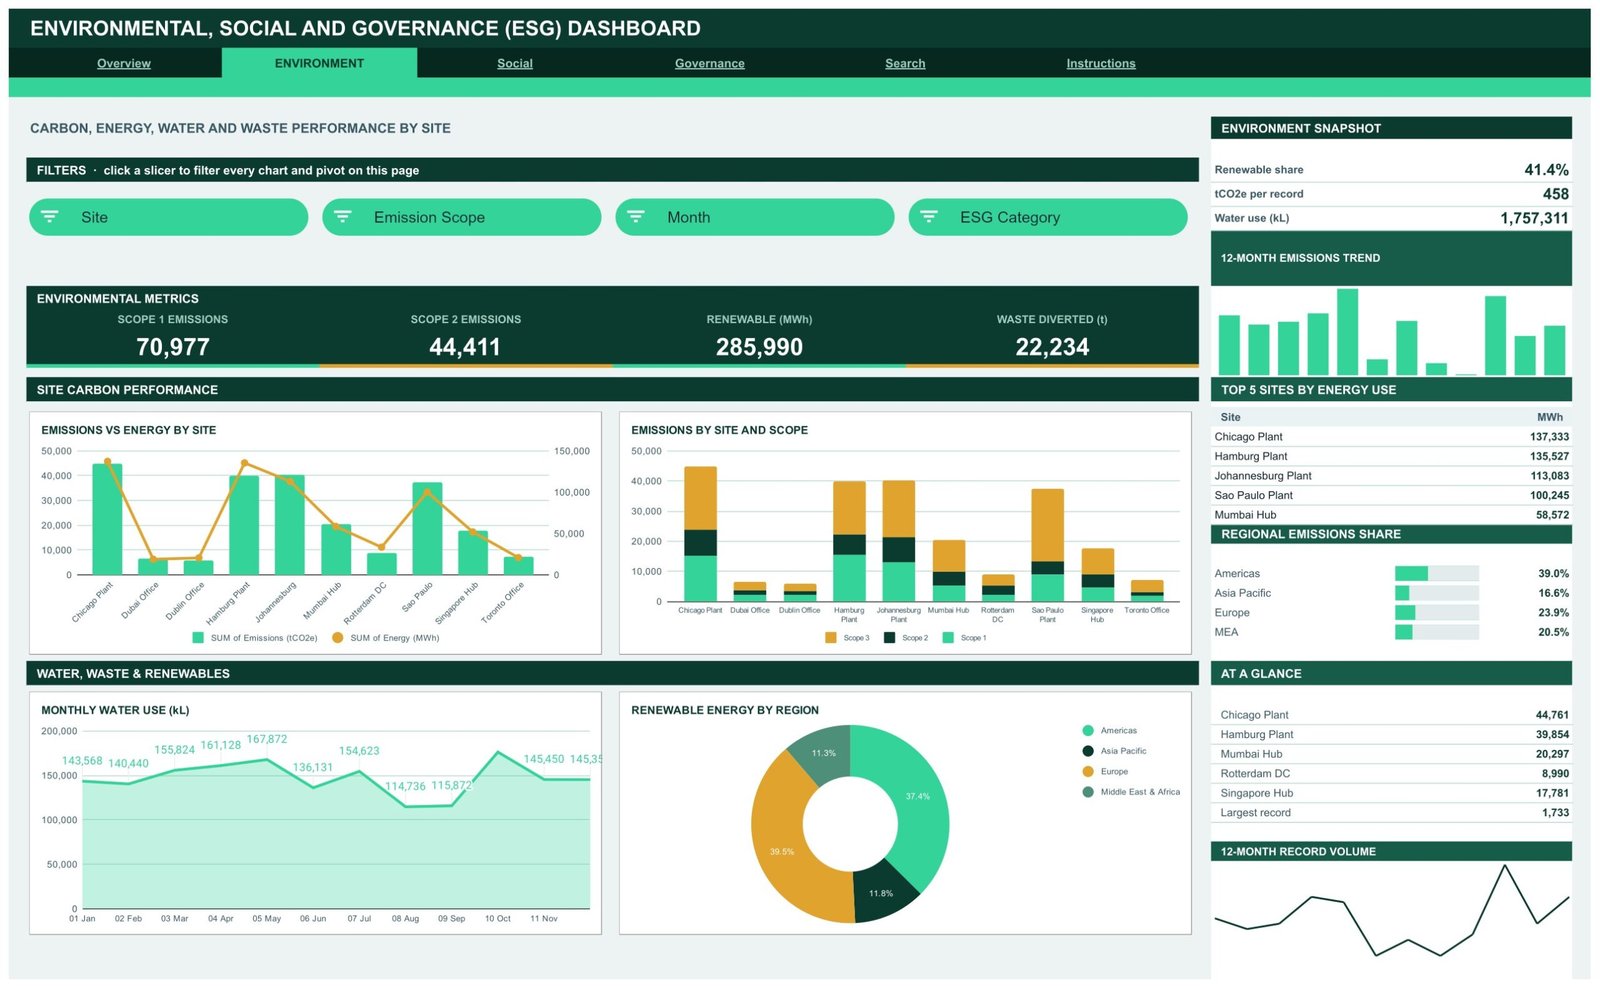
Environment – Carbon, Energy, Water and Waste by Site
The environmental pillar in detail. KPI cards show Scope 1 Emissions, Scope 2 Emissions, Renewable MWh and Waste Diverted. Charts cover Emissions vs Energy by Site, Emissions by Site and Scope, Monthly Water Use and Renewable Energy by Region, with a sidebar listing the Top 5 Sites by Energy Use and the regional emissions share.
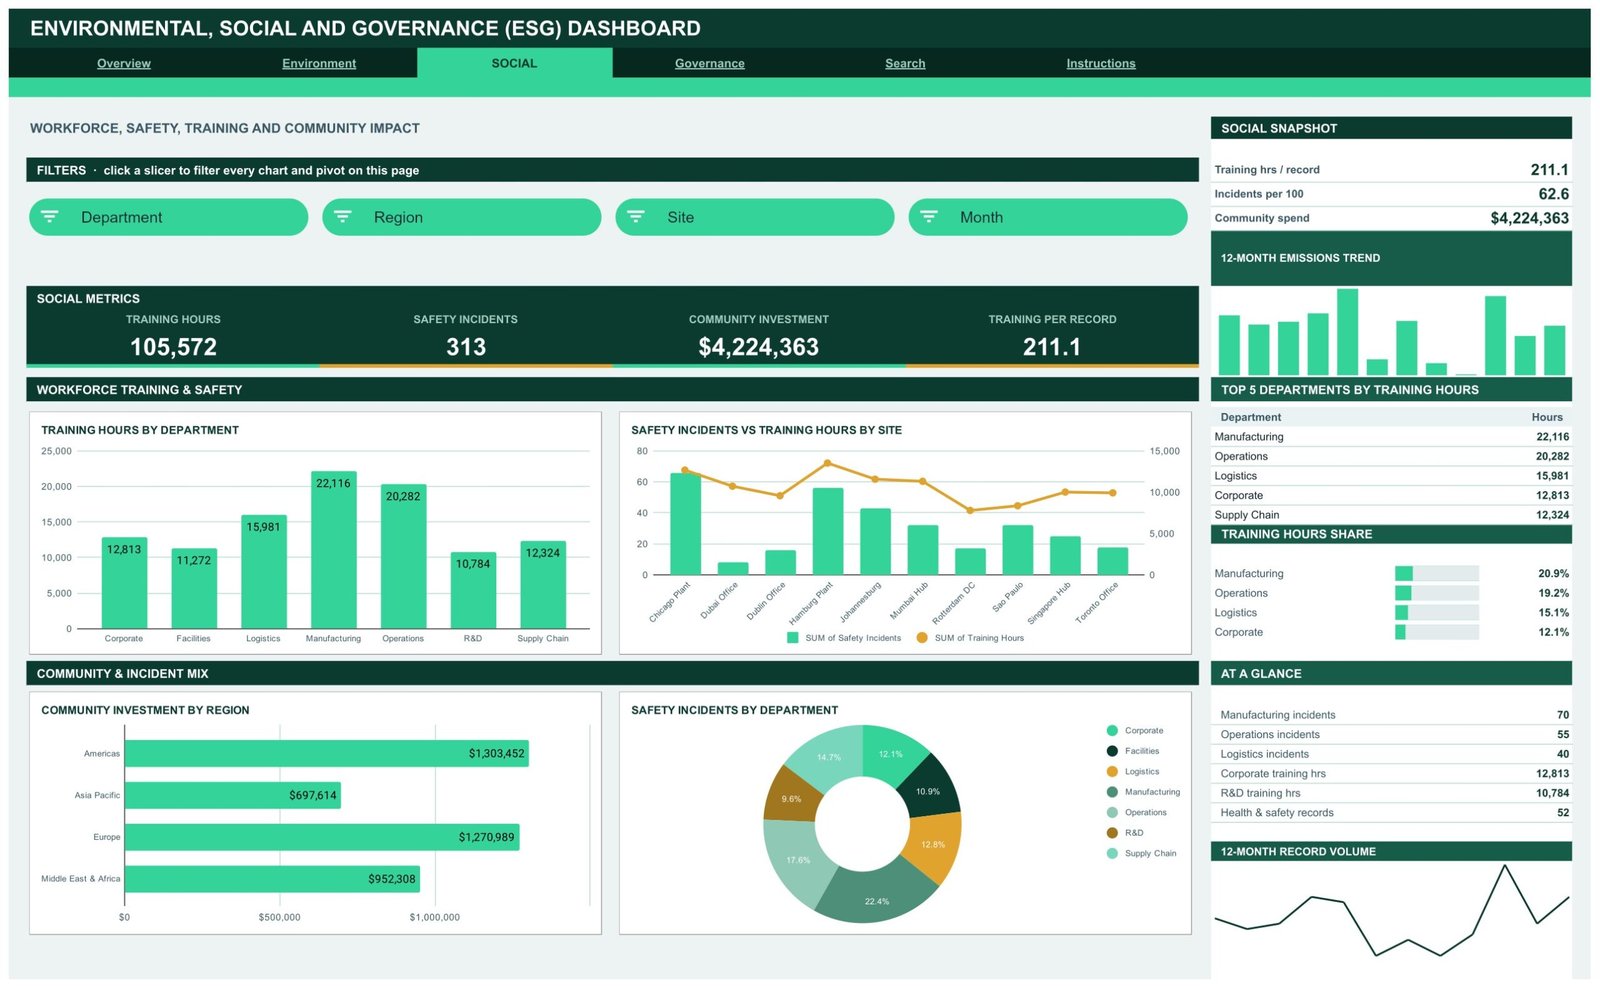
Social – Workforce, Safety, Training and Community Impact
Training Hours, Safety Incidents, Community Investment and Training per Record head this page. Below them sit Training Hours by Department, Safety Incidents vs Training Hours by Site, Community Investment by Region and Safety Incidents by Department. The sidebar ranks the Top 5 Departments by Training Hours and shows each department’s share of the training total.
Governance – Board Oversight, Ethics and ESG Scoring
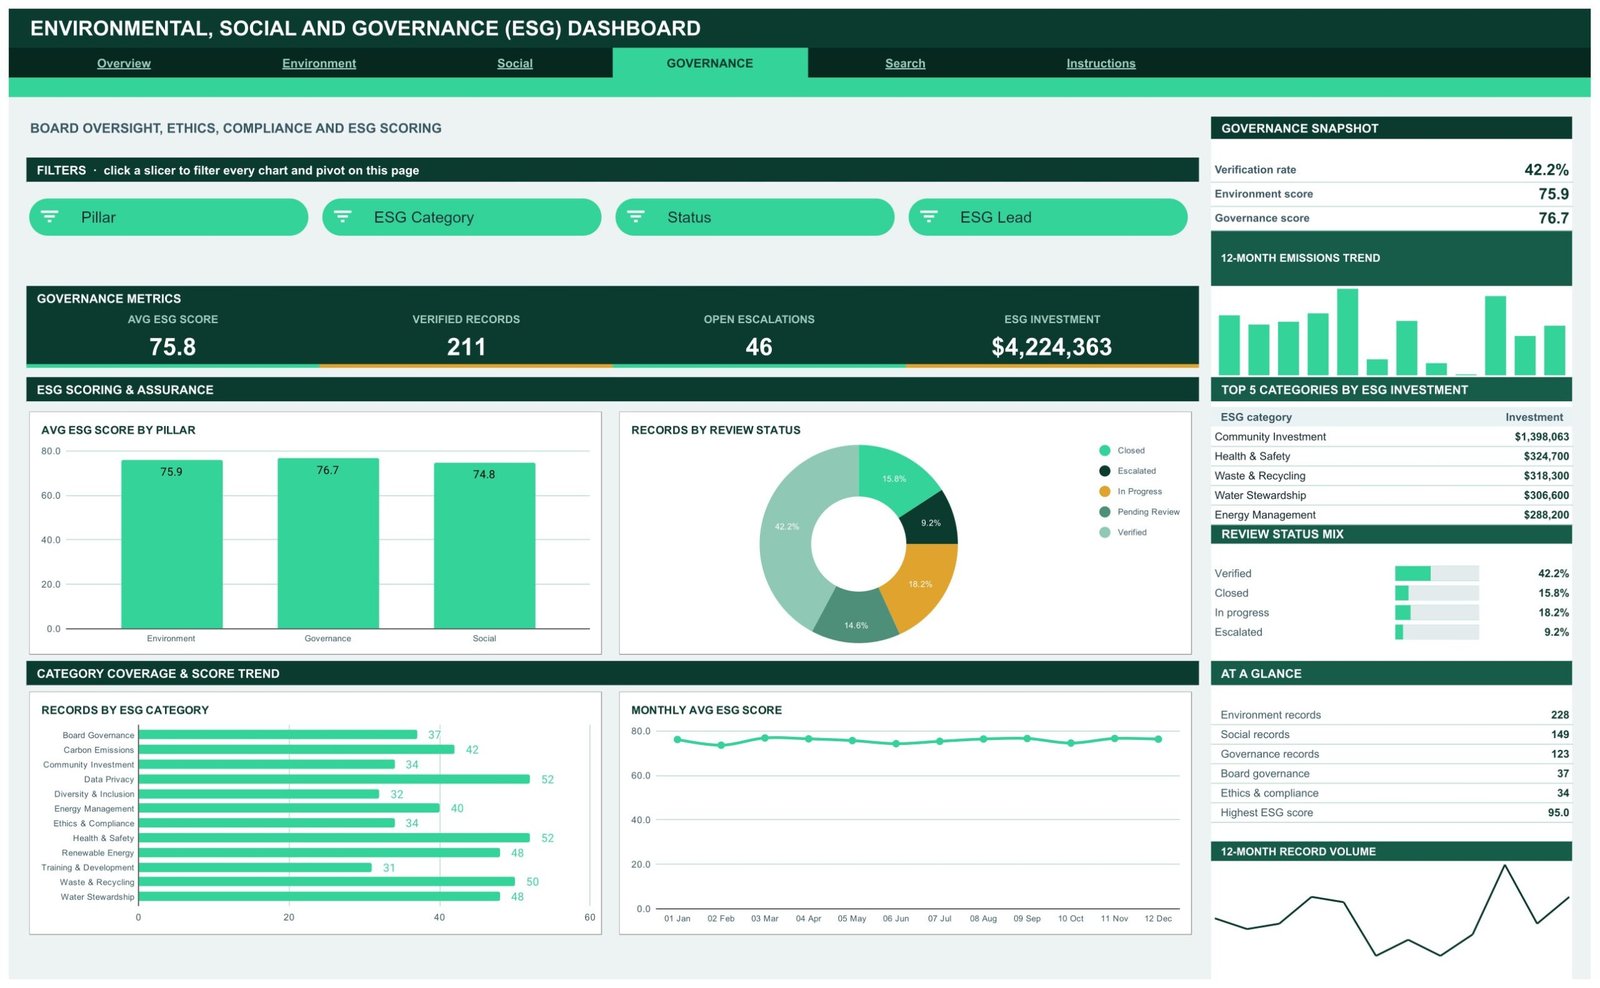
Avg ESG Score, Verified Records, Open Escalations and ESG Investment sit at the top. Avg ESG Score by Pillar compares Environment, Governance and Social side by side; Records by Review Status splits the queue into verified, closed, in progress, pending review and escalated; Records by ESG Category ranks all 12 categories from Board Governance to Water Stewardship; and Monthly Avg ESG Score tracks the score across twelve months.
Search – ESG Record Lookup
Pick a Record ID and the page prints that submission in full. Useful when a chart flags an outlier and somebody asks which site, department and reviewer it came from.
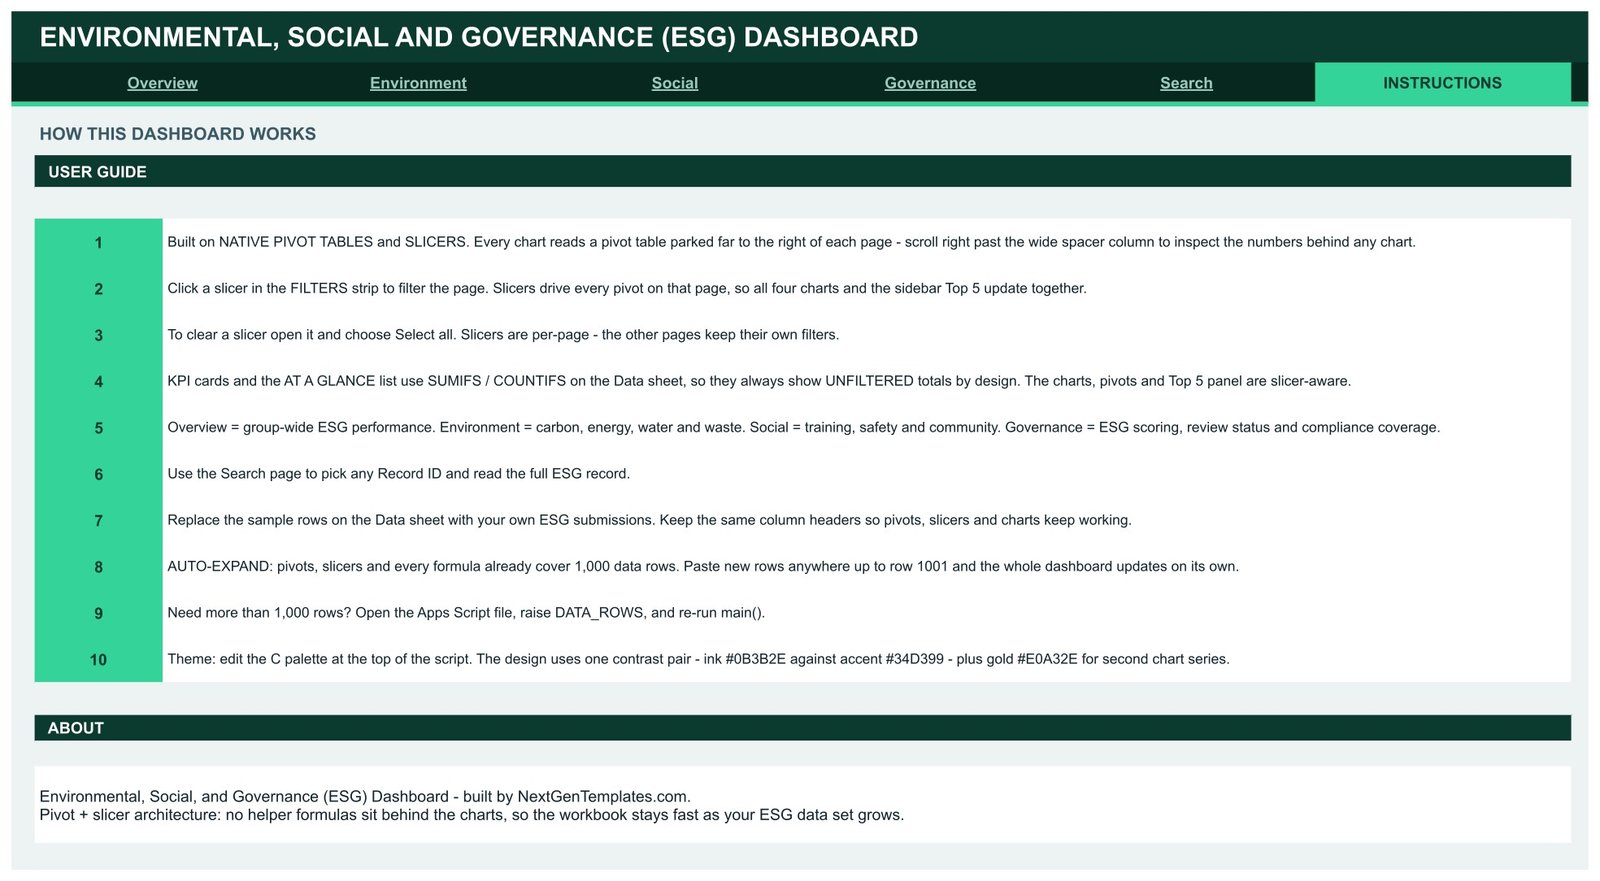
Instructions – How the Dashboard Works
A ten-step guide covering the pivot-and-slicer architecture, how to clear a slicer, why the KPI cards deliberately stay unfiltered, how to swap in your own rows, and how to raise the row limit beyond 1,000 in the bundled Apps Script.
ESG Dashboard in Google Sheets vs. Excel vs. Paid ESG Software – Where This Fits
| This template (Google Sheets) | Excel ESG workbook | Paid ESG platform (Workiva, Sphera) | |
|---|---|---|---|
| Cost | $9.99 one time | $20-$40 one time, plus Microsoft 365 | $15,000-$100,000+ per year |
| Platform | Any browser, Google Sheets | Desktop Excel | Vendor web app |
| Setup time | Under 10 minutes | 15-30 minutes | 6-16 weeks with a consultant |
| Real-time team collaboration | Yes, native | Only via OneDrive co-authoring | Yes |
| Mobile access | Yes, Sheets app | Limited | Yes |
| Customisable fields | Yes, edit the Data sheet | Yes | Vendor-controlled |
| Share with a link | Yes | No, files are emailed | Yes, seat-based |
| Year-1 cost at 5 users | $9.99 | $40 plus licences | $25,000+ |
| Scope 1/2/3 breakdown | Yes, by site, region and month | Depends on the workbook | Yes |
| Framework-specific disclosure exports | No – this is a tracking and reporting tool | No | Yes |
Who This Template Is For – and Who It’s Not For
It fits sustainability leads at mid-sized manufacturers and multi-site operators who currently keep ESG numbers in a dozen unlinked spreadsheets; HR and EHS managers who need training hours and safety incidents on the same page as the emissions data; finance and corporate-affairs teams preparing an internal ESG pack for the board; and consultants who want a clean starting layout per client.
It does not fit teams that need certified regulatory filings or third-party assurance – buy software or engage an assurance provider for that. It is also the wrong tool if you need automated meter or ERP feeds, if your data set runs to hundreds of thousands of rows, or if you want emission factors calculated for you. This dashboard reports the figures you supply; it does not compute carbon accounting from activity data.
How to Use the Environmental, Social, and Governance (ESG) Dashboard
- Download the PDF, open it and click the Google Sheets copy link. An editable copy lands in your Drive.
- Open the Instructions page and read the ten steps – two minutes, and it explains everything the slicers do.
- Go to the Data sheet and replace the sample rows with your own submissions. Keep the 16 column headers exactly as they are.
- Rename sites, regions, departments and ESG categories to match your organisation. The slicers pick up the new values automatically.
- Click through the four analysis pages and use the slicers to filter a single site, month, scope or reviewer.
- Use the Search page to pull any individual record when a number needs explaining.
- Need more than 1,000 rows? Open the bundled Apps Script, raise DATA_ROWS and re-run main().
- Share the sheet with your team by link, or use File then Download to export a PDF of any page for a board pack.
Real-World Use Cases
Priya, sustainability manager at a five-plant manufacturer. She used to rebuild an emissions summary by hand every quarter. Now the plant teams paste their monthly rows into the Data sheet, and she filters the Environment page by site to see which plant is dragging the group renewable share down before the quarterly review.
Daniel, EHS and training lead. He tracks training hours and safety incidents together. The Safety Incidents vs Training Hours by Site chart is the one he brings to the operations meeting, because it shows at a glance where incident counts and training investment are out of step.
Amara, corporate affairs at a listed mid-cap. She runs the Governance page for the board pack – average ESG score by pillar, how many records are still pending review, and which categories the ESG investment actually went to. She exports the page to PDF and drops it straight into the deck.
Frequently Asked Questions
Does this template make my company compliant with any reporting standard?
No. It is a tracking and reporting dashboard. It organises and visualises the ESG data you enter, and it does not produce, certify or assure a disclosure under any framework. Treat it as an internal management view and take framework questions to your own advisers.
Do I need Google Workspace or a paid account?
No. A free Google account is enough. Open the copy link in the PDF and the dashboard becomes yours.
Can I add my own ESG categories, sites and departments?
Yes. Type your own values into the Data sheet columns. The pivots and slicers read from the data, so the new values appear in the filter lists without any extra setup.
Why do the KPI cards not change when I click a slicer?
That is intentional. The KPI cards and the At a Glance list use SUMIFS and COUNTIFS on the Data sheet so they always show unfiltered group totals. The charts, pivots and Top 5 panels are the slicer-aware parts of the page.
How many records can it hold?
1,000 rows are covered out of the box. To go further, open the bundled Apps Script, increase DATA_ROWS and re-run main().
Does it calculate emission factors for me?
No. You enter emissions, energy, water and the other measures directly. The dashboard aggregates, splits and charts them; it does not convert activity data into a carbon figure.
Can my whole team use it at once?
Yes. It is a normal Google Sheet, so share it by link and colleagues can view or edit at the same time. Slicer selections are per-page, so give each reviewer their own copy if you want independent filtering.
About the Author
Built by PK – Microsoft Certified Professional with 15+ years of Excel, Google Sheets, and Power BI experience. Founder of NextGenTemplates, reaching 300K+ subscribers across YouTube channels. Every template is hand-built and tested before release.
Explore Related Templates
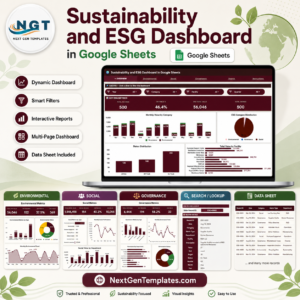
- Sustainability and ESG Dashboard in Google Sheets – a broader sustainability view if you want programme-level tracking alongside the pillars.
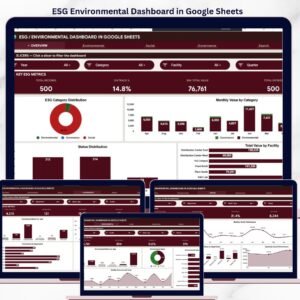
- ESG Environmental Dashboard in Google Sheets – environment-only, for teams whose reporting starts and ends with carbon, energy and waste.
- Audit & Internal Controls Dashboard in Google Sheets – pairs naturally with the Governance page.
- Diversity & Inclusion Dashboard in Google Sheets – goes deeper on the workforce side of the Social pillar.
- Investor Relations Dashboard in Google Sheets – for the teams that field ESG questions from shareholders.
- Browse the full Google Sheets Dashboard range, or every Google Sheets template we publish.
Get the ESG Dashboard Today
Stop rebuilding the ESG summary by hand each quarter. Download the Environmental, Social, and Governance (ESG) Dashboard in Google Sheets for $9.99 (regular $16.99), open the copy link, paste your rows in and have all three pillars on one screen the same afternoon. Instant download, lifetime access, free updates.
Watch the step-by-step video Demo:
Last updated: August 2026.






























Reviews
There are no reviews yet.