

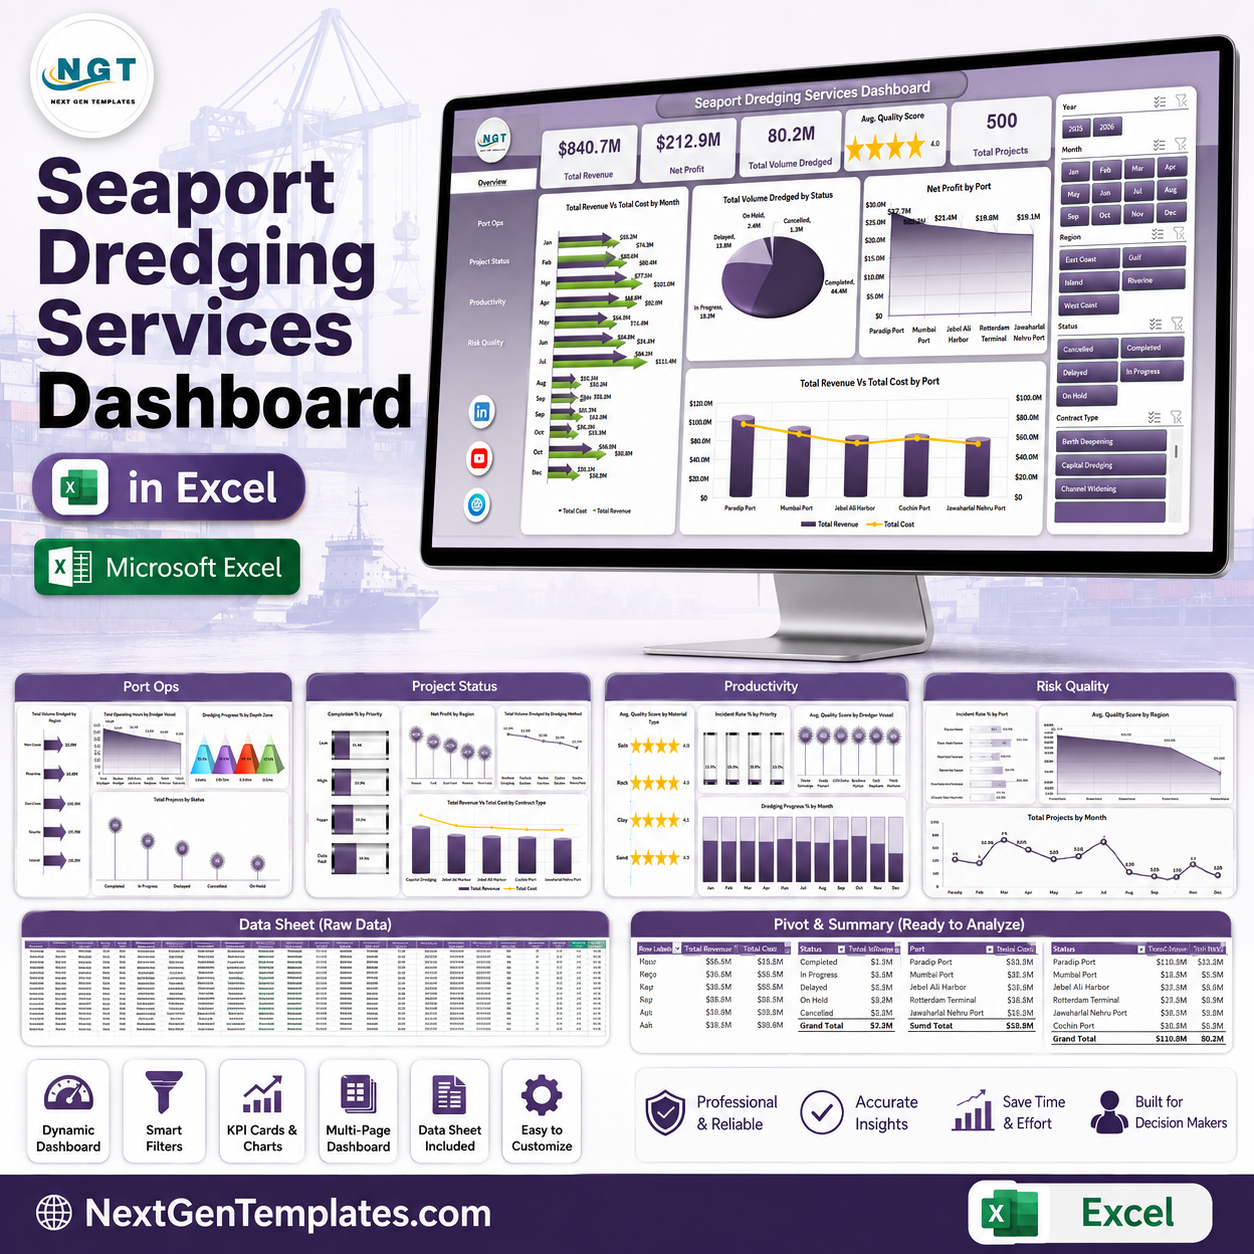


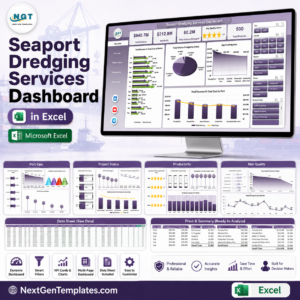
Last updated: August 9, 2026. The Seaport Dredging Services Dashboard in Excel gives dredging, port operations, and marine project teams 7 workbook tabs, 5 executive KPI cards, 17 analysis charts, slicer-based filtering, and a pivot-driven refresh workflow. Built by PK, a Microsoft Certified Professional with 15+ years of spreadsheet experience and 300K+ tutorial subscribers, this Excel dashboard helps you track revenue, cost, net profit, dredged volume, project status, quality, incidents, port performance, and vessel productivity without a recurring reporting tool. Download once, replace the sample data, click Refresh All, and use the dashboard for monthly reviews, contract meetings, port operations analysis, and project performance reporting.
Key Features of Seaport Dredging Services Dashboard in Excel
- 5 KPI cards: Total Revenue, Net Profit, Total Volume Dredged, Avg. Quality Score, and Total Projects.
- 7 worksheet tabs: Overview, Port Ops, Project Status, Productivity, Risk Quality, Data Sheet, and Support Sheet.
- 17 analysis charts: review revenue, cost, volume, profit, ports, regions, vessels, methods, project status, quality, and incidents.
- Multiple slicers: filter dashboard pages quickly by the available data fields.
- Pivot-driven refresh: update the Data Sheet, then click Data > Refresh All in Excel.
- Excel-native workflow: no coding, no BI subscription, and no extra reporting software required.
What’s Inside the Seaport Dredging Services Dashboard in Excel
1 – Overview Page
The Overview Page gives management a fast summary of dredging performance. The top card area shows Total Revenue, Net Profit, Total Volume Dredged, Avg. Quality Score, and Total Projects so decision-makers can quickly read financial, production, and quality health before reviewing the detailed pages.
Total Revenue Vs Total Cost by Month: compares monthly income against operating cost. Use it to spot profitable periods, cost pressure, and seasonality in dredging activity.
Total Volume Dredged by Status: groups dredged volume by project or work status. It helps project teams understand how much work is completed, active, delayed, or waiting for action.
Net Profit by Port: shows where dredging work is creating the strongest return. This view is useful for port-level commercial reviews and bid planning.
Total Revenue Vs Total Cost by Port: compares revenue and cost across ports. Use it to identify high-cost ports, stronger margin locations, and projects needing financial attention.

2 – Port Ops
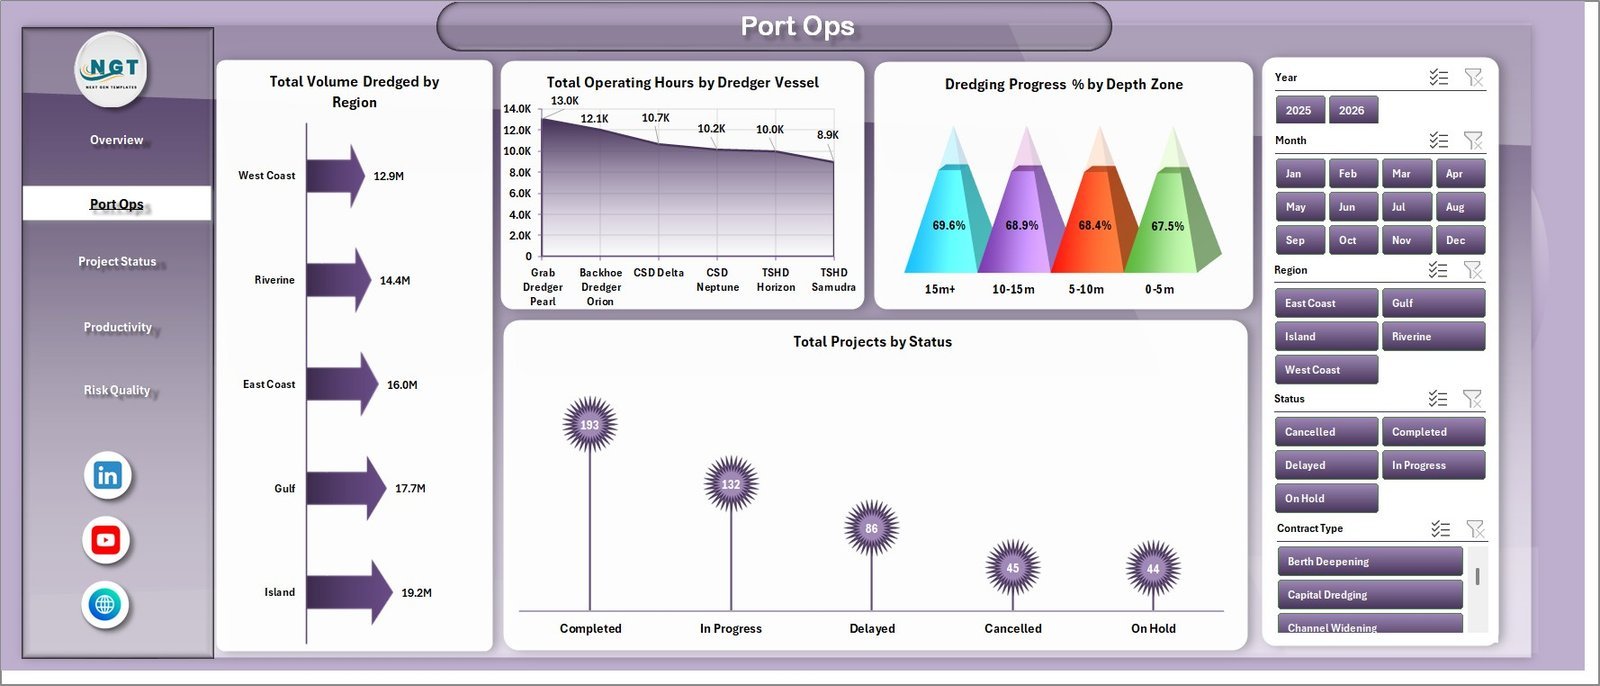
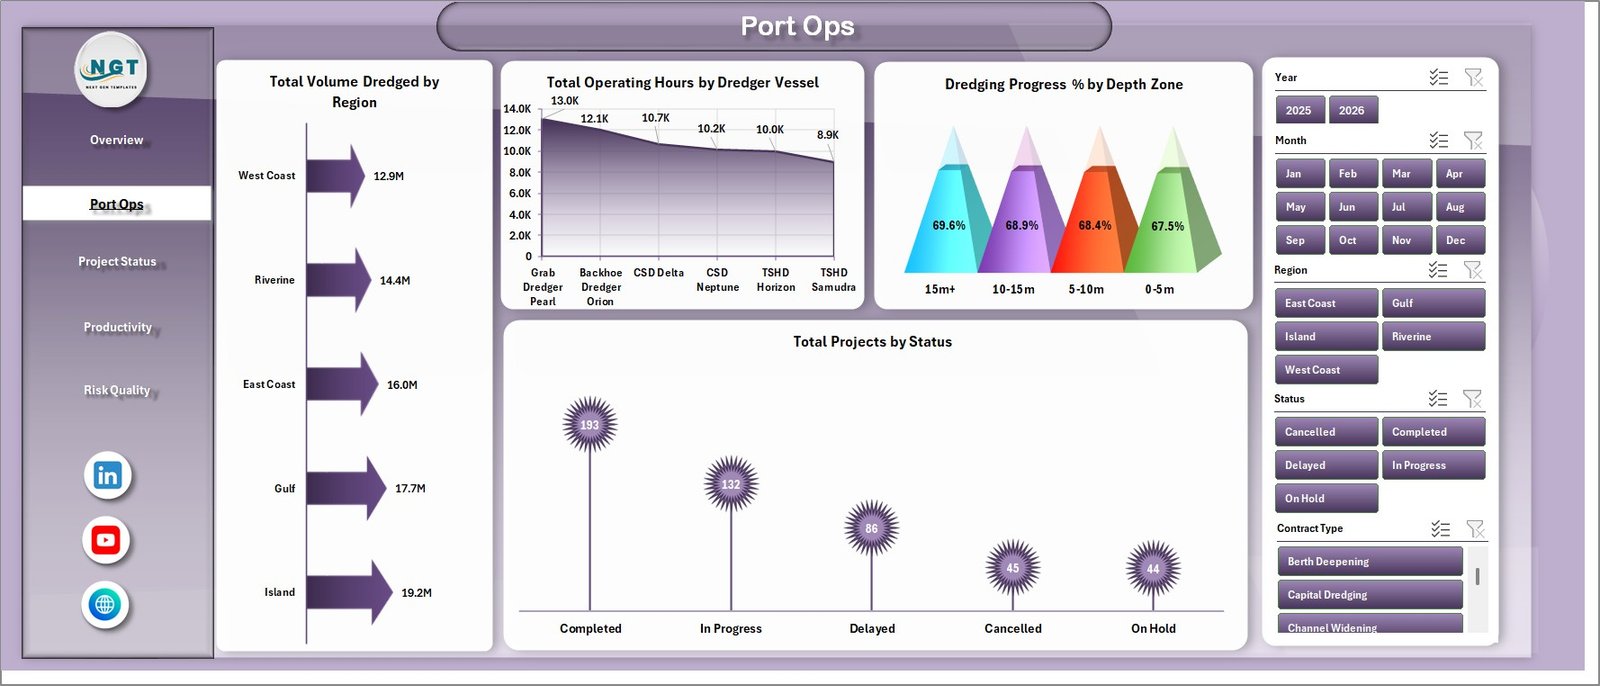
The Port Ops page focuses on operational performance across regions, vessels, depth zones, and project status. Total Volume Dredged by Region highlights where most dredging output is happening. Total Operating Hours by Dredger Vessel helps compare vessel utilization and workload. Dredging Progress % by Depth Zone shows progress across channel or berth depth requirements. Total Projects by Status gives a clear count of projects by operational stage.
3 – Project Status
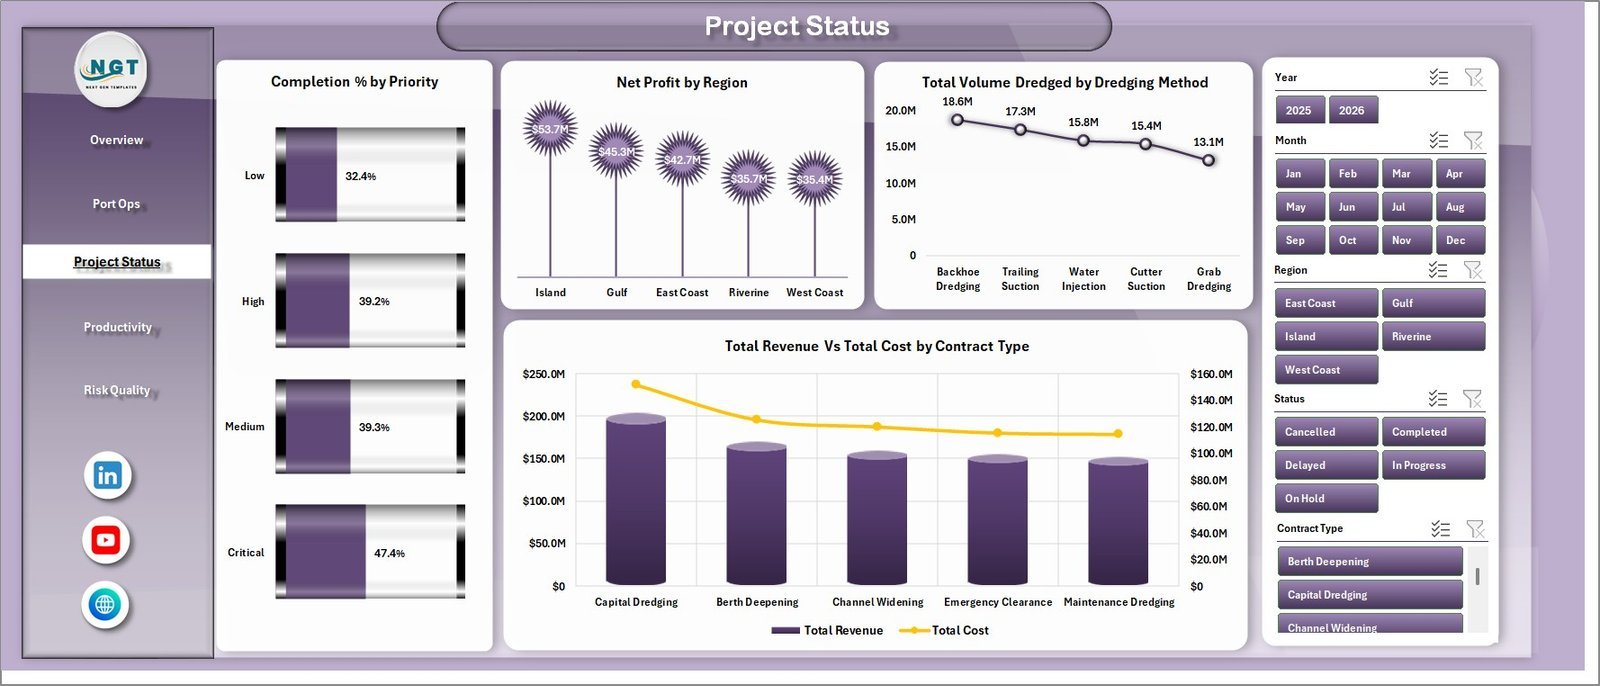
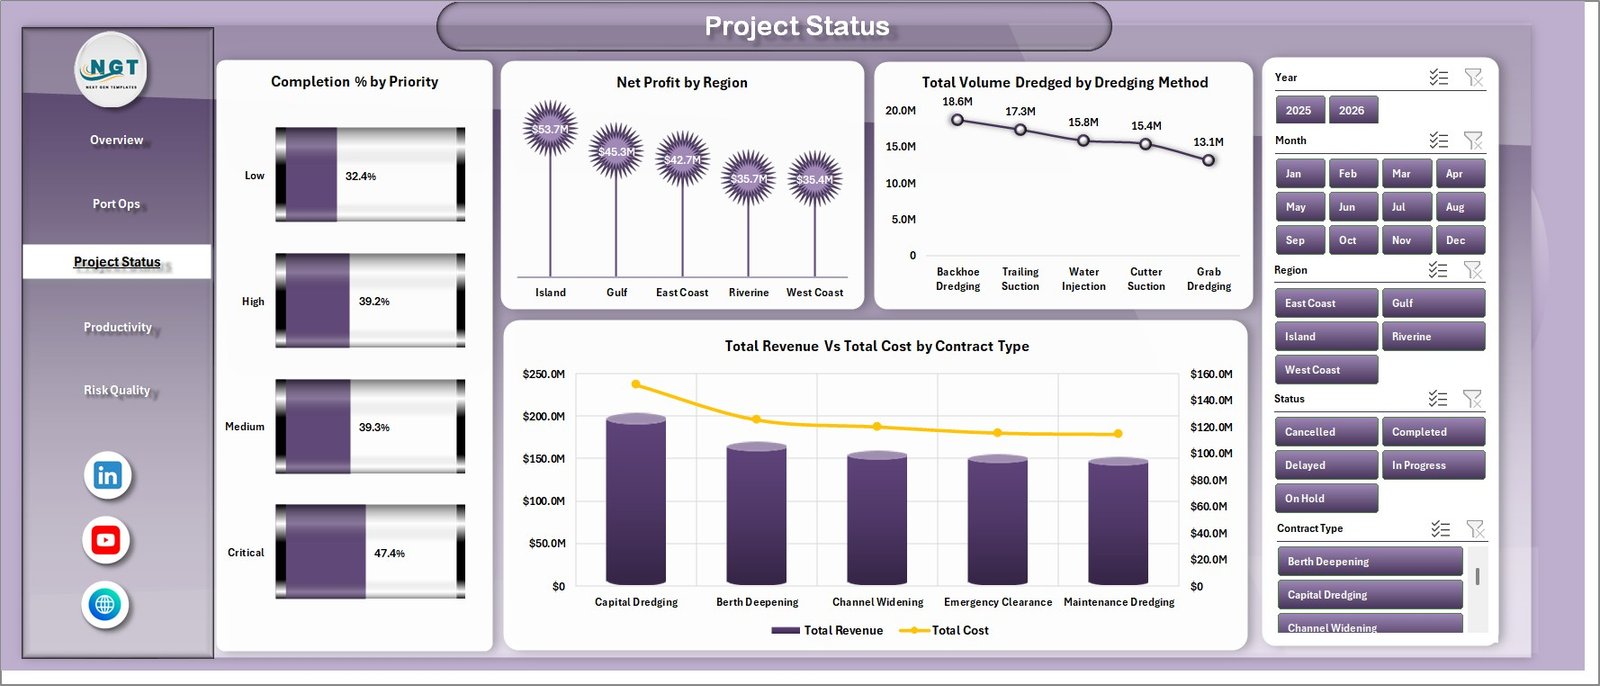
The Project Status page reviews priority, region, dredging method, and contract type. Completion % by Priority shows whether high-priority work is moving as expected. Net Profit by Region compares regional profitability. Total Volume Dredged by Dredging Method helps evaluate method-level production. Total Revenue Vs Total Cost by Contract Type supports contract review and margin control.
4 – Productivity
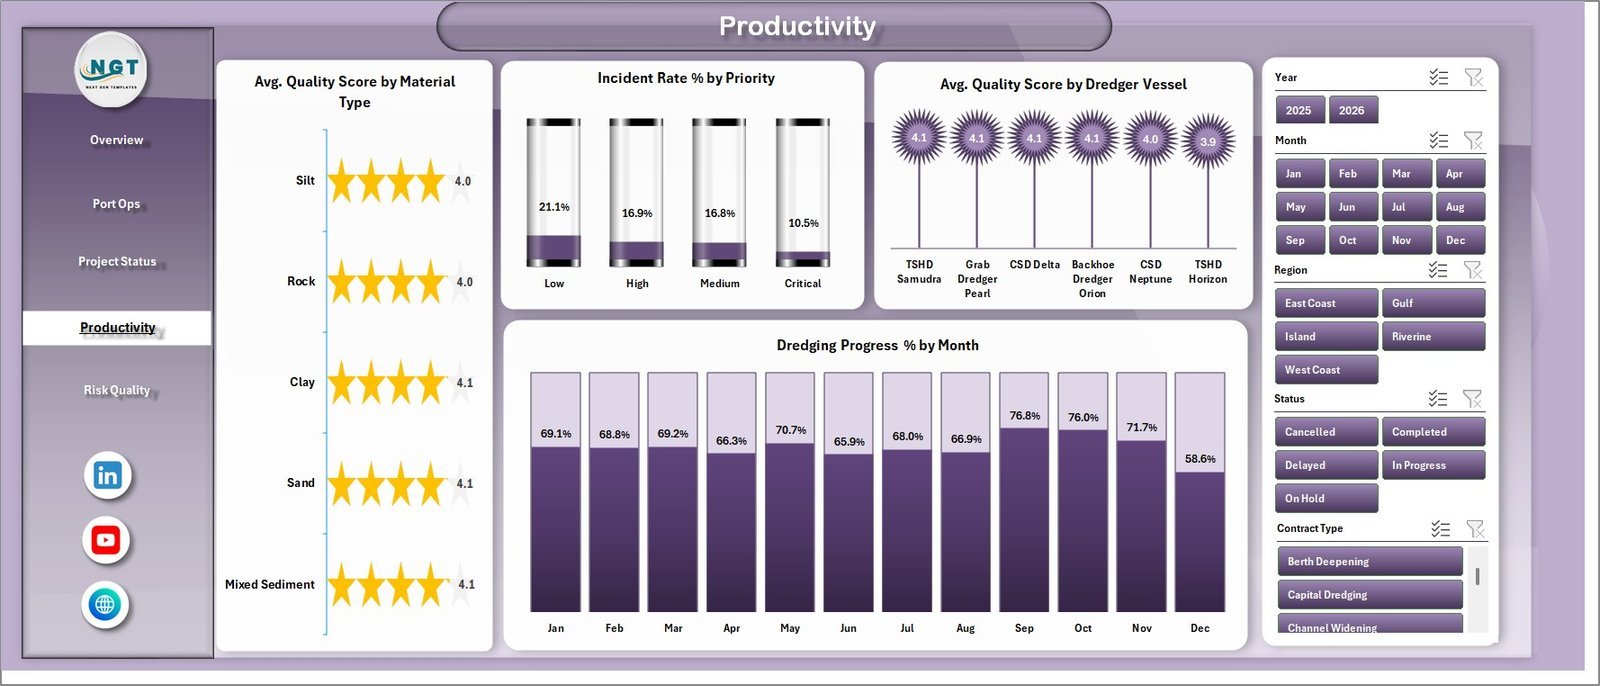
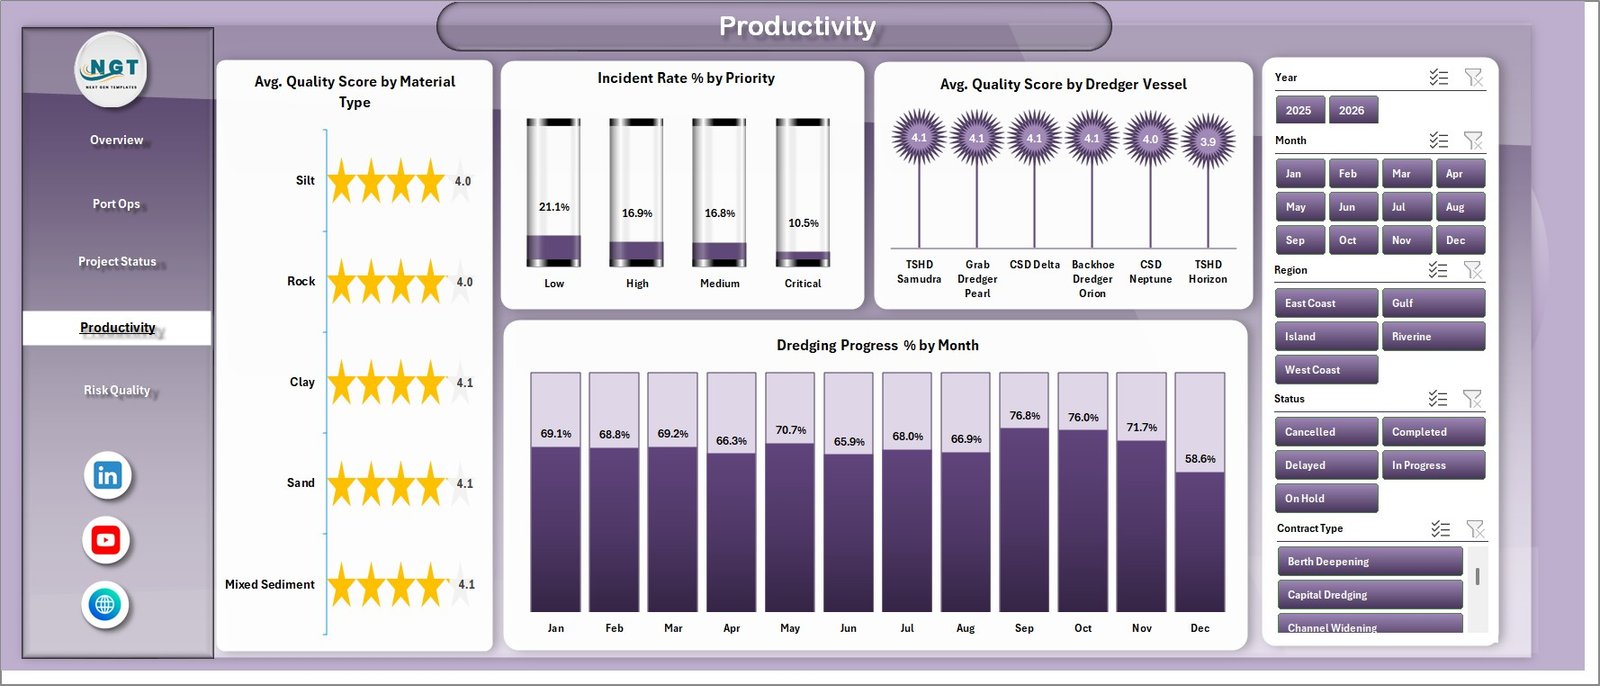
The Productivity page focuses on output quality, vessel performance, incident pressure, and monthly progress. Avg. Quality Score by Material Type shows how dredging quality varies by seabed or sediment category. Incident Rate % by Priority highlights safety and risk patterns. Avg. Quality Score by Dredger Vessel compares vessel-level quality. Dredging Progress % by Month tracks the pace of work over time.
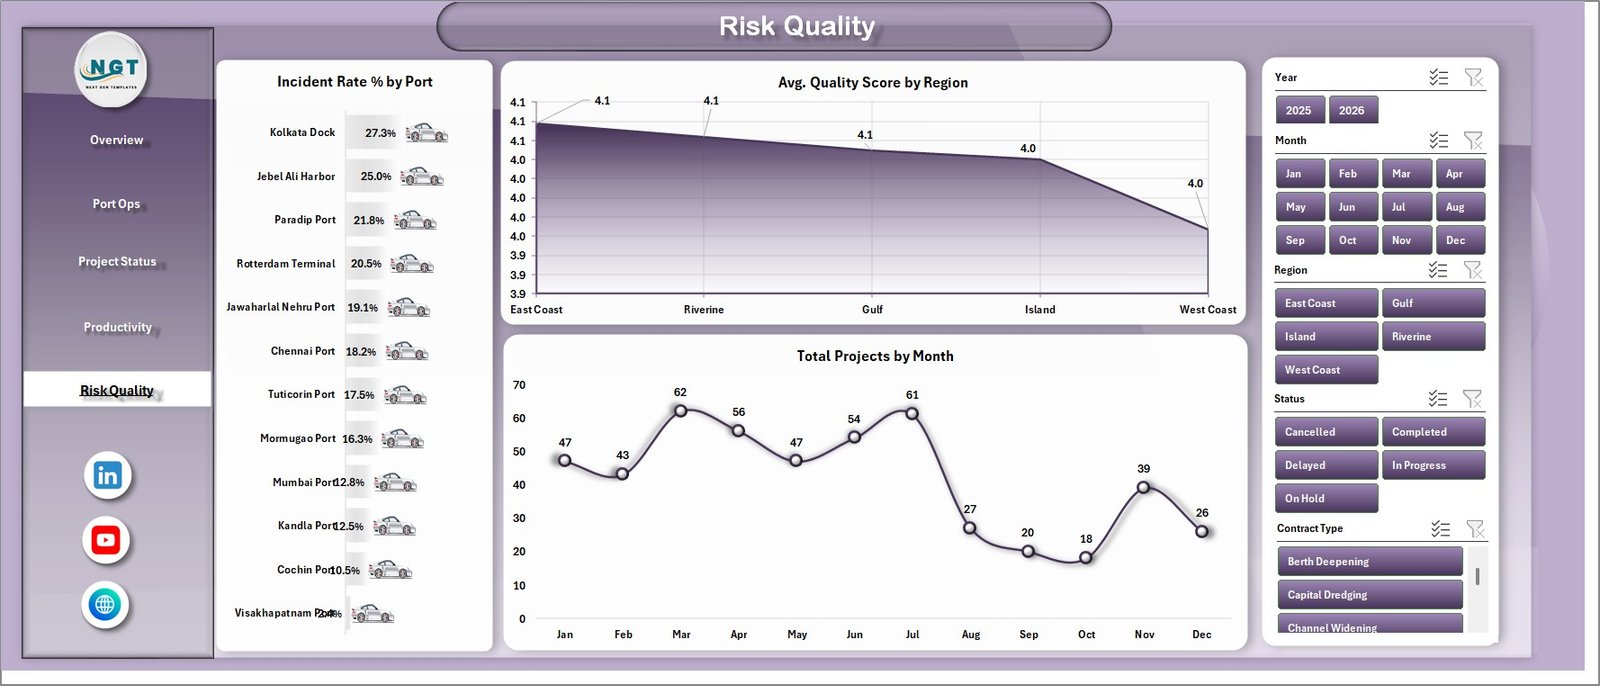
5 – Risk Quality
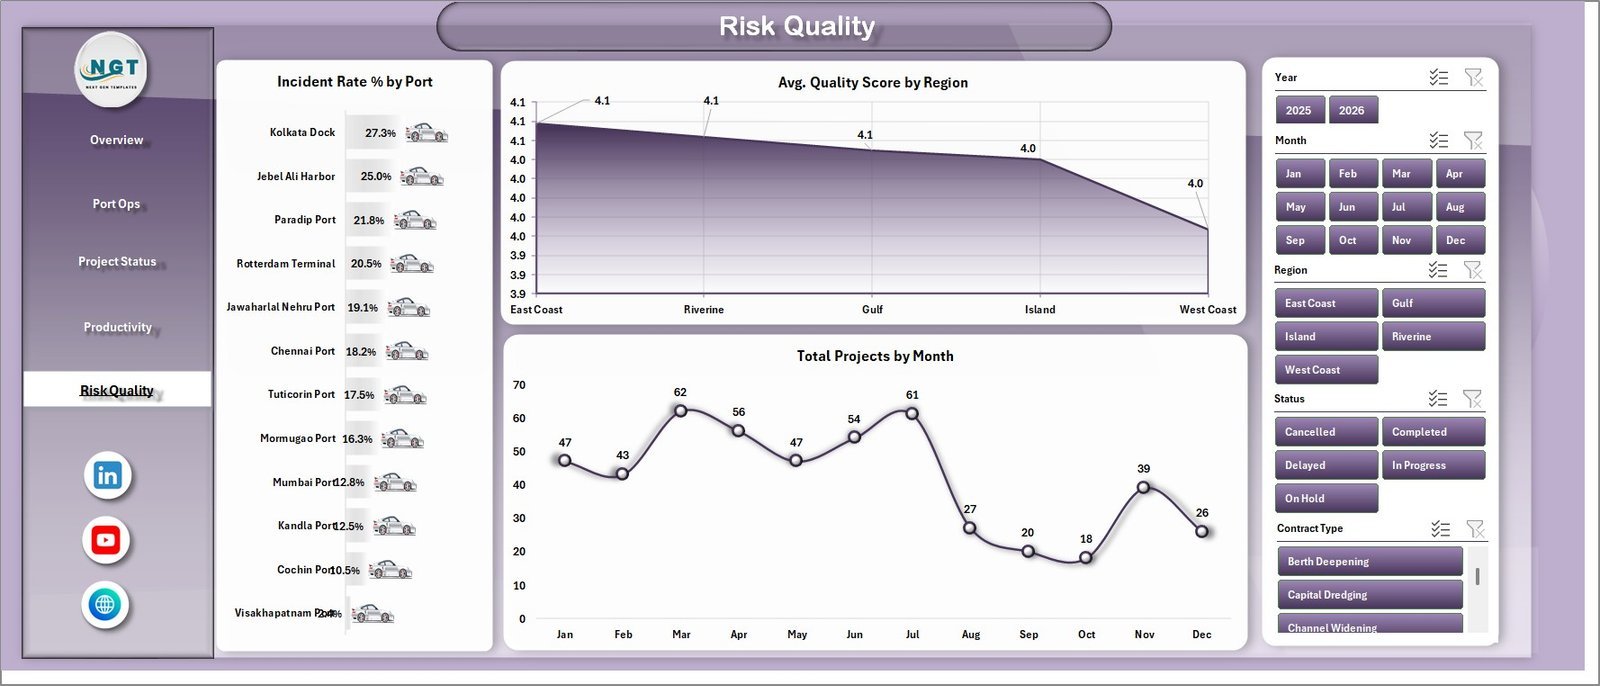
The Risk Quality page gives managers a focused look at safety, quality, and time-based project movement. Incident Rate % by Port identifies ports with higher safety or operating risk. Avg. Quality Score by Region compares regional dredging output quality. Total Projects by Month shows how project load changes across the reporting period.
6 – Data Sheet Tab
The Data Sheet is where you add or replace dredging service records. Keep the same column structure so the dashboard cards, slicers, pivot tables, and charts continue to update correctly.

7 – Support Sheet Tab
The Support Sheet contains the pivot tables used to create the dynamic dashboard. After updating the Data Sheet, go to the Excel Data ribbon and click Refresh All. The pivots, charts, and KPI cards will refresh together. You can keep this sheet hidden during normal use.

Seaport Dredging Services Dashboard in Excel vs. Google Sheets vs. Paid Port Management SaaS – Where This Fits
| Feature | This Excel dashboard | Google Sheets alternative | Paid port management SaaS |
|---|---|---|---|
| Cost | $17.99 one-time sale price | Manual build or template cost | Usually monthly, annual, or per-user |
| Platform | Microsoft Excel | Google Sheets in Drive | Vendor-hosted web app |
| Setup time | Replace data and refresh pivots | Requires chart and formula setup if built manually | Requires account setup, configuration, and onboarding |
| Customizable fields | Editable workbook structure | Editable sheet structure | Limited by vendor settings |
| Year-1 cost at 5 users | $17.99 before any Microsoft licensing | Template plus workspace costs if applicable | Can grow with seats, modules, and ports |
| Dredging-specific reporting | Revenue, cost, volume, progress, quality, incidents, vessels, ports, and methods | Must be built manually | Depends on vendor module |
Who This Template Is For – and Who It’s Not For
This template is for port authorities, dredging contractors, marine operations managers, project controls teams, finance analysts, quality supervisors, and operations leaders who need a clean Excel reporting file for dredging service performance.
It is not a hydrographic survey tool, bathymetry processing application, vessel dispatch system, GIS platform, live GPS tracker, equipment maintenance CMMS, or replacement for regulated marine compliance software. Use it for reporting and analysis after your operational data is available.
How to Use the Seaport Dredging Services Dashboard in Excel
- Download and unzip the file.
- Open the workbook in Microsoft Excel.
- Replace the sample records in the Data Sheet using the same format.
- Go to the Data tab in the Excel ribbon and click Refresh All.
- Use slicers on each dashboard page to filter by port, region, month, status, vessel, method, priority, contract type, or other available fields.
- Review the KPI cards and charts for monthly reporting, project review, and management meetings.
Real-World Use Cases
Rahul, dredging project manager: reviews Dredging Progress % by Month and Completion % by Priority before weekly client update meetings.
Maria, port operations analyst: compares Total Volume Dredged by Region and Total Operating Hours by Dredger Vessel to understand capacity and utilization.
Kevin, finance controller: checks Net Profit by Port and Total Revenue Vs Total Cost by Contract Type before month-end margin review.
Frequently Asked Questions
What does the Seaport Dredging Services Dashboard in Excel track?
It tracks revenue, cost, profit, dredged volume, quality score, project count, operating hours, progress percentage, incident rate, ports, regions, dredger vessels, methods, status, contract type, and month-based trends.
How many tabs are included?
The workbook includes 7 tabs: Overview, Port Ops, Project Status, Productivity, Risk Quality, Data Sheet, and Support Sheet.
Do I need macros?
No macro requirement is described for this dashboard. It is designed around Excel data, pivot tables, slicers, KPI cards, and charts.
How do I refresh the dashboard?
Update the Data Sheet, then click Data > Refresh All in Excel. The Support Sheet pivots and all dashboard visuals will refresh from the updated records.
Can I hide the Support Sheet?
Yes. The Support Sheet can be kept hidden after setup because it mainly contains the pivot tables that power the dashboard.
Can I customize the data?
Yes. Replace the sample data with your own dredging service records while keeping the same column format for best results.
About the Author
Built by PK – Microsoft Certified Professional with 15+ years of Excel, Google Sheets, and Power BI experience. Founder of NextGenTemplates, reaching 300K+ subscribers across YouTube channels. Every template is hand-built and tested before release.
Explore Related Templates
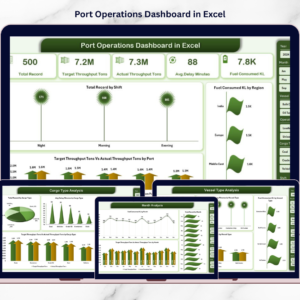
- Port Operations Dashboard in Excel for wider port activity reporting.
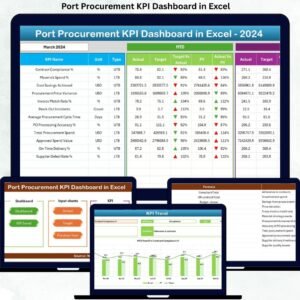
- Port Procurement KPI Dashboard in Excel for procurement and supplier performance tracking.
- Port Contract Management Dashboard in Power BI for contract, revenue, and margin analysis.
- Browse Excel dashboard templates.
- Browse Excel operations templates.
Download the Seaport Dredging Services Dashboard in Excel to monitor port dredging revenue, cost, profit, volume, quality, project status, vessel utilization, and operational risk in one editable workbook.
Last updated: August 9, 2026.

























Reviews
There are no reviews yet.