

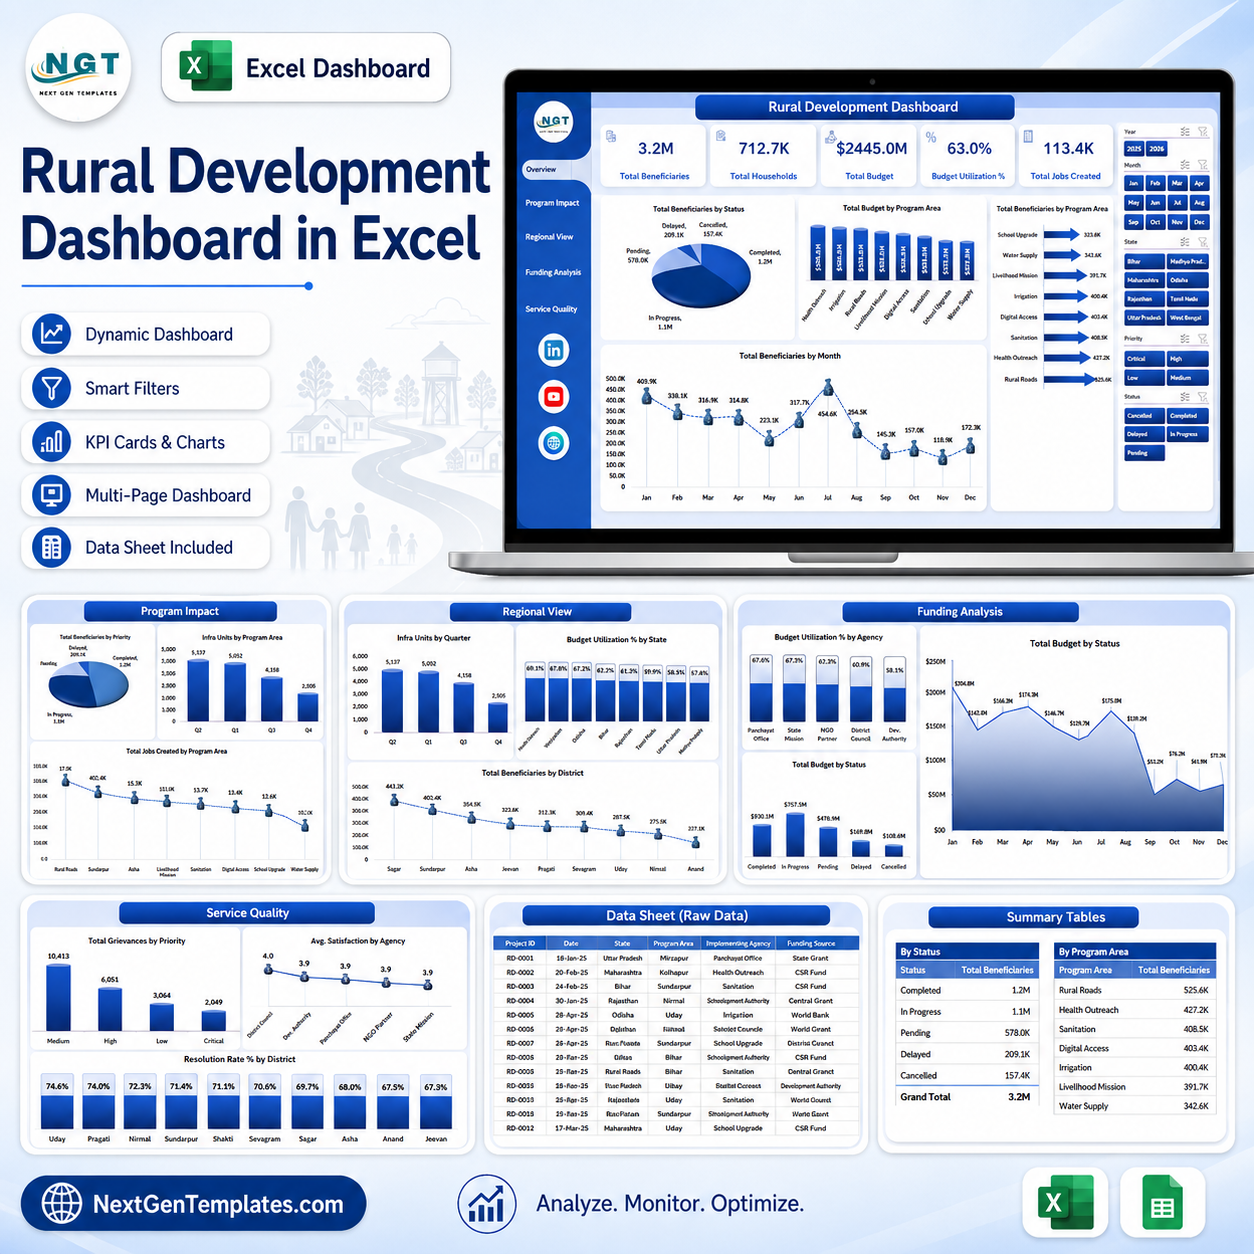


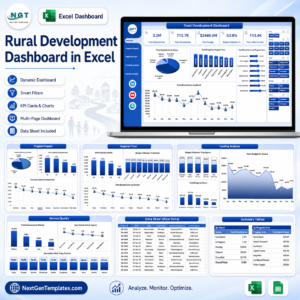
Rural Development Dashboard in Excel gives rural program teams a ready-made reporting workbook with 5 executive KPI cards, 20 chart views, 7 worksheet tabs, and refreshable pivot-backed analysis. Instead of rebuilding monthly reports from scattered spreadsheets, you can paste updated data, refresh the workbook, and review beneficiaries, households, budget, utilization, jobs created, grievances, satisfaction, districts, states, agencies, and funding sources in one place. Instant download, one-time payment, no subscription, and no per-user SaaS fee.
Key Features of Rural Development Dashboard in Excel
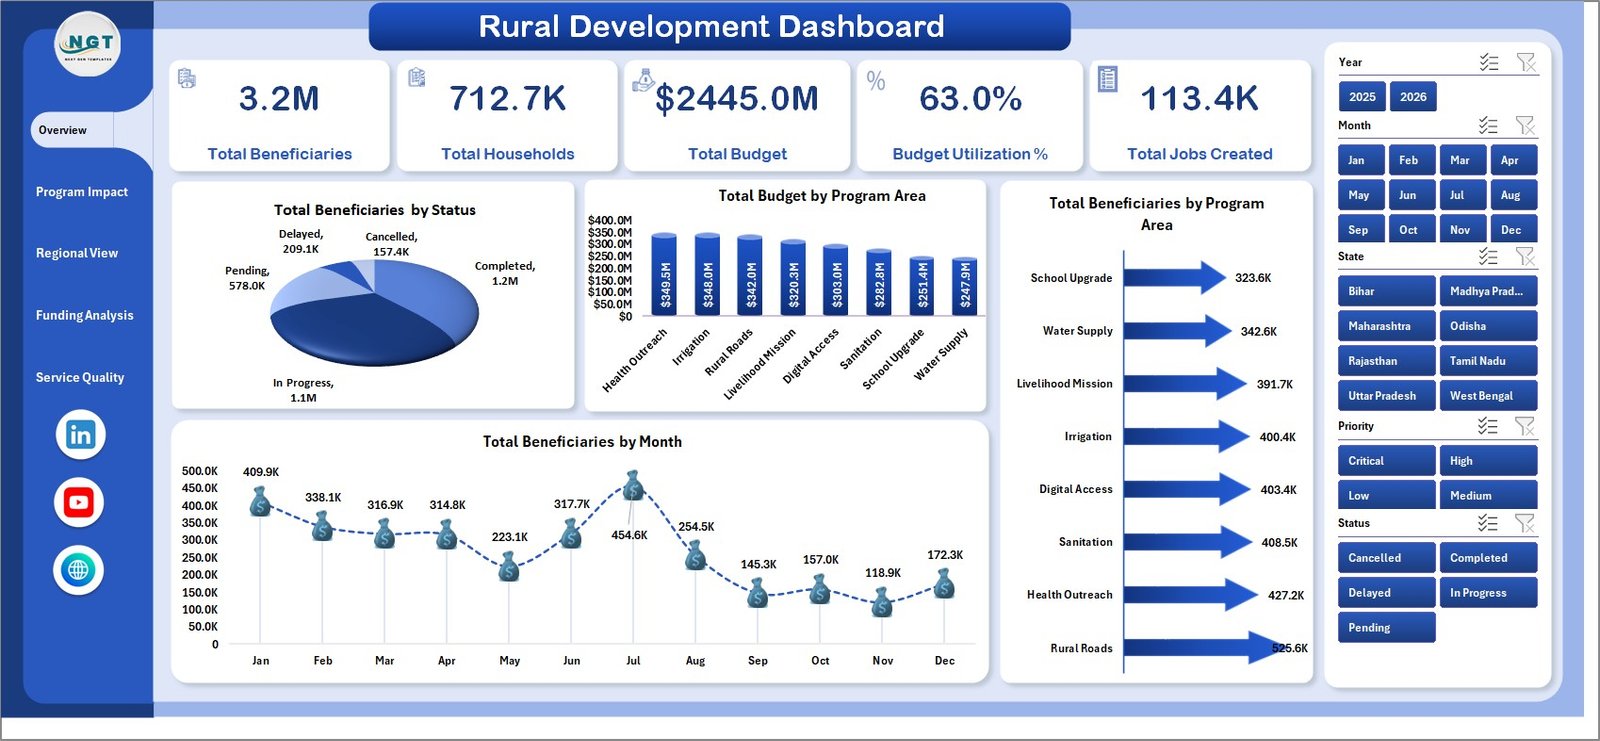
This Excel dashboard is designed for rural development programs, public-sector reporting, NGO field operations, and grant-funded initiatives where leaders need a clear view of delivery progress and financial utilization. The Overview page includes high-level cards for Total Beneficiaries, Total Households, Total Budget, Budget Utilization %, and Total Jobs Created.
The workbook includes multiple slicers so you can filter the dashboard quickly and compare program results by the dimensions in your data. Charts are grouped by page, making it easy to move from executive summary to program impact, regional performance, funding analysis, service quality, raw data, and support pivots.
What’s Inside the Rural Development Dashboard in Excel
Overview Page: This page gives a quick leadership summary using KPI cards and four analysis charts. Total Beneficiaries by Status shows how many people are covered under each progress stage. Total Budget by Program Area helps identify which development areas receive the highest funding. Total Beneficiaries by Program Area compares reach across initiatives such as services, livelihoods, infrastructure, or local programs. Total Beneficiaries by Month highlights seasonal growth, reporting gaps, and changes in program coverage.
Rural Development Dashboard in Excel
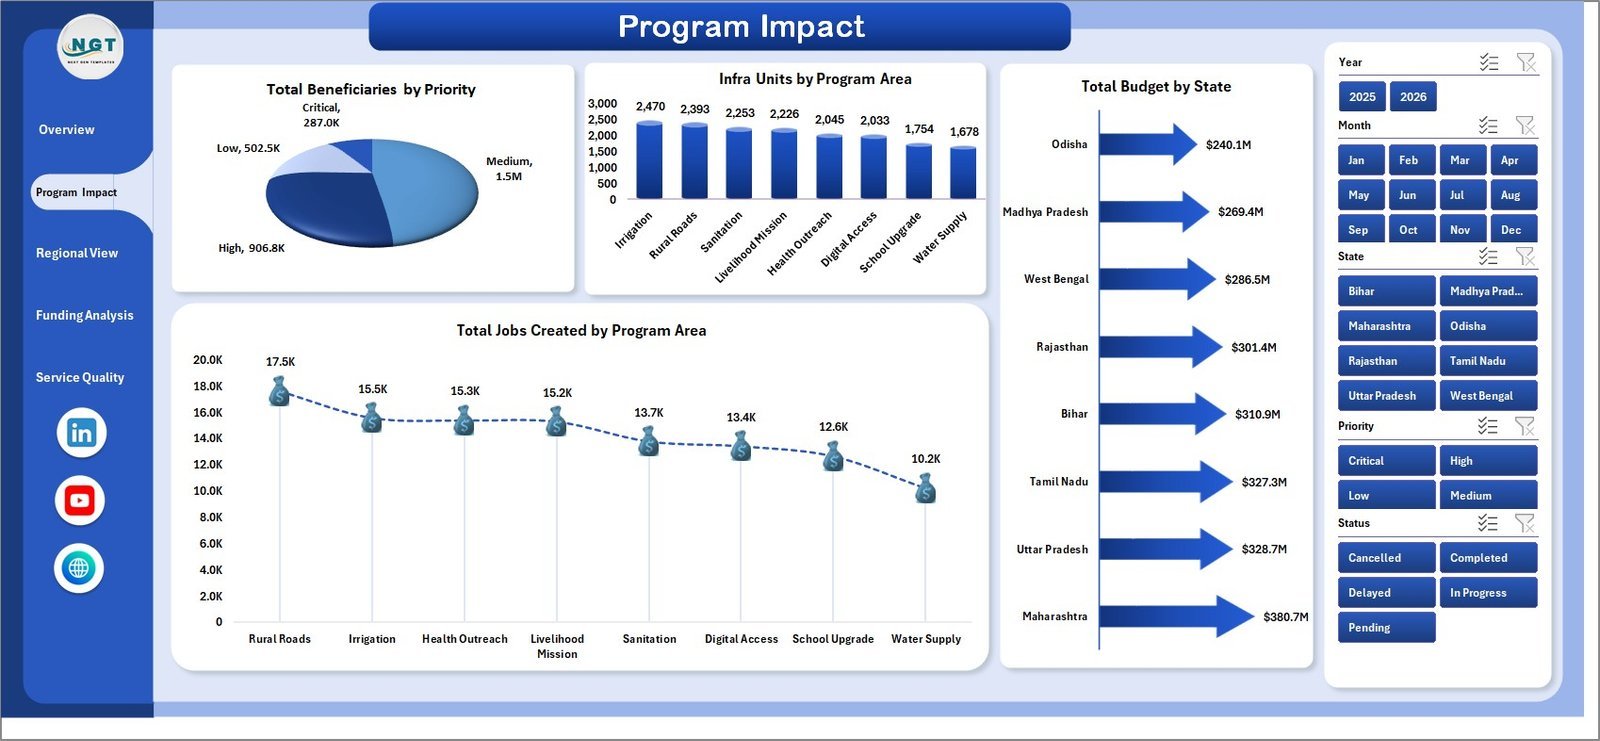
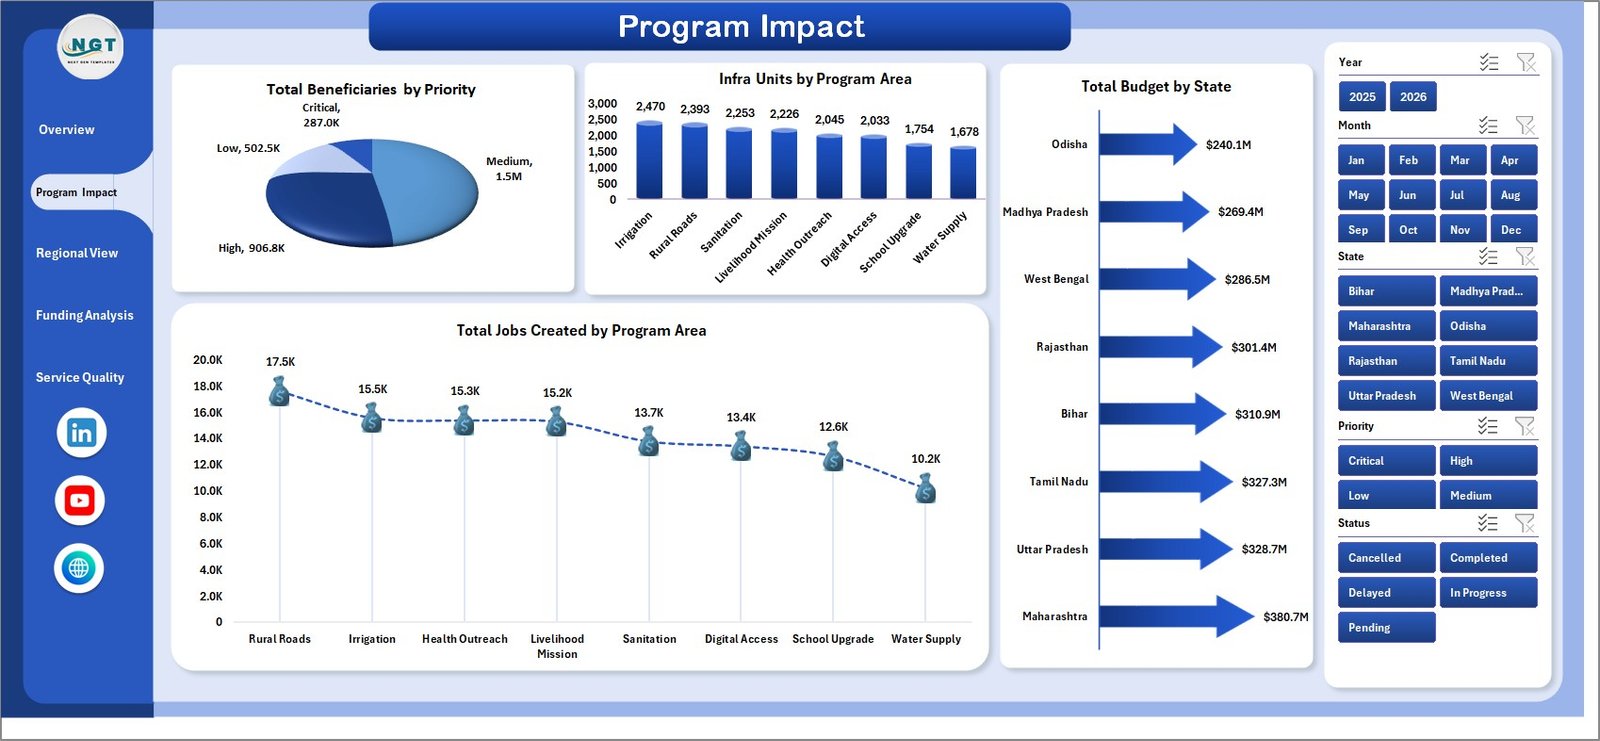
Program Impact: This sheet focuses on output and delivery results. Total Beneficiaries by Priority shows how resources are reaching high, medium, or low-priority segments. Infra Units by Program Area compares infrastructure delivery across program areas. Total Budget by State reveals state-level funding allocation. Total Jobs Created by Program Area shows which initiatives are generating the most employment outcomes.
Program Impact
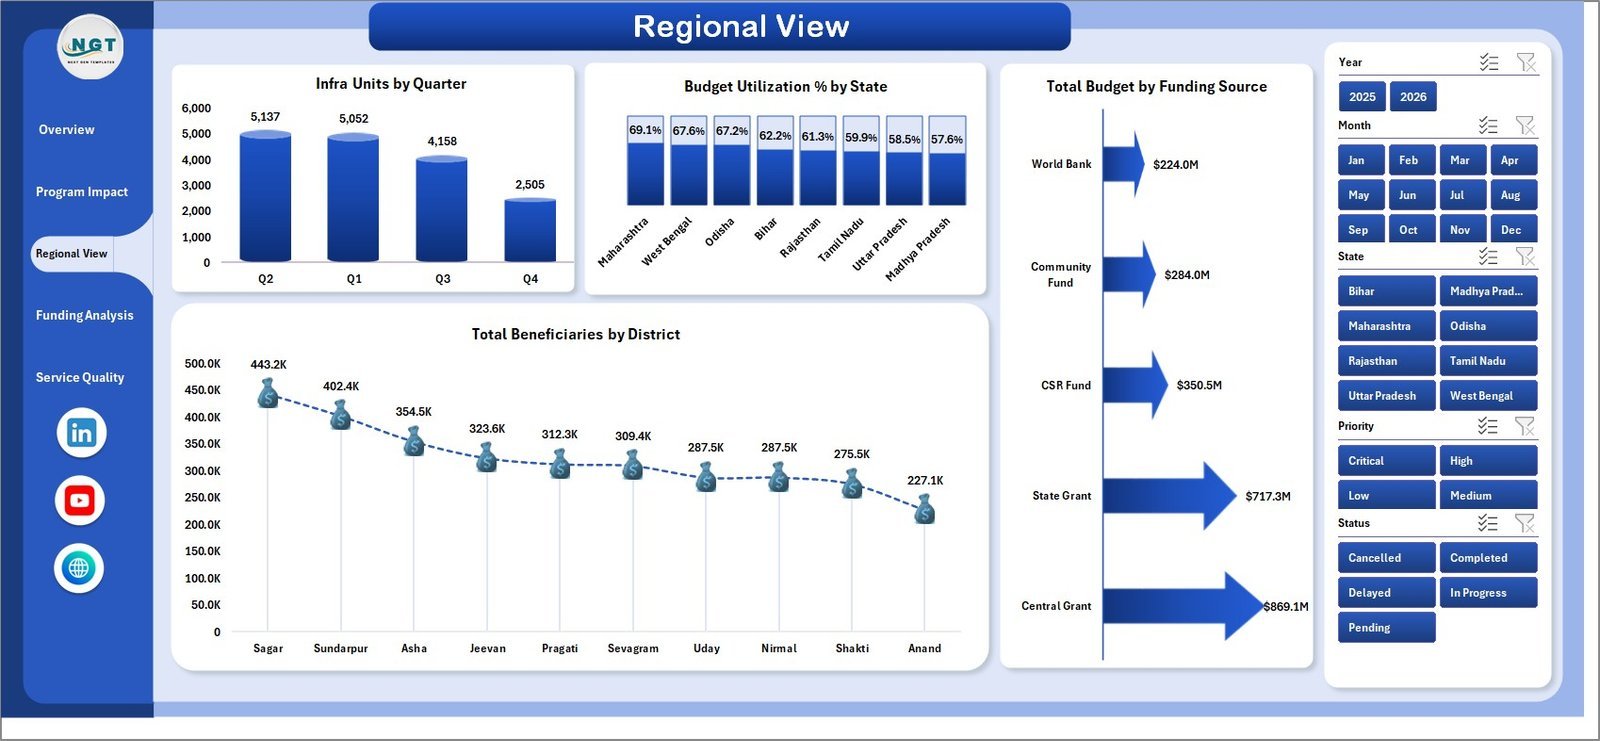
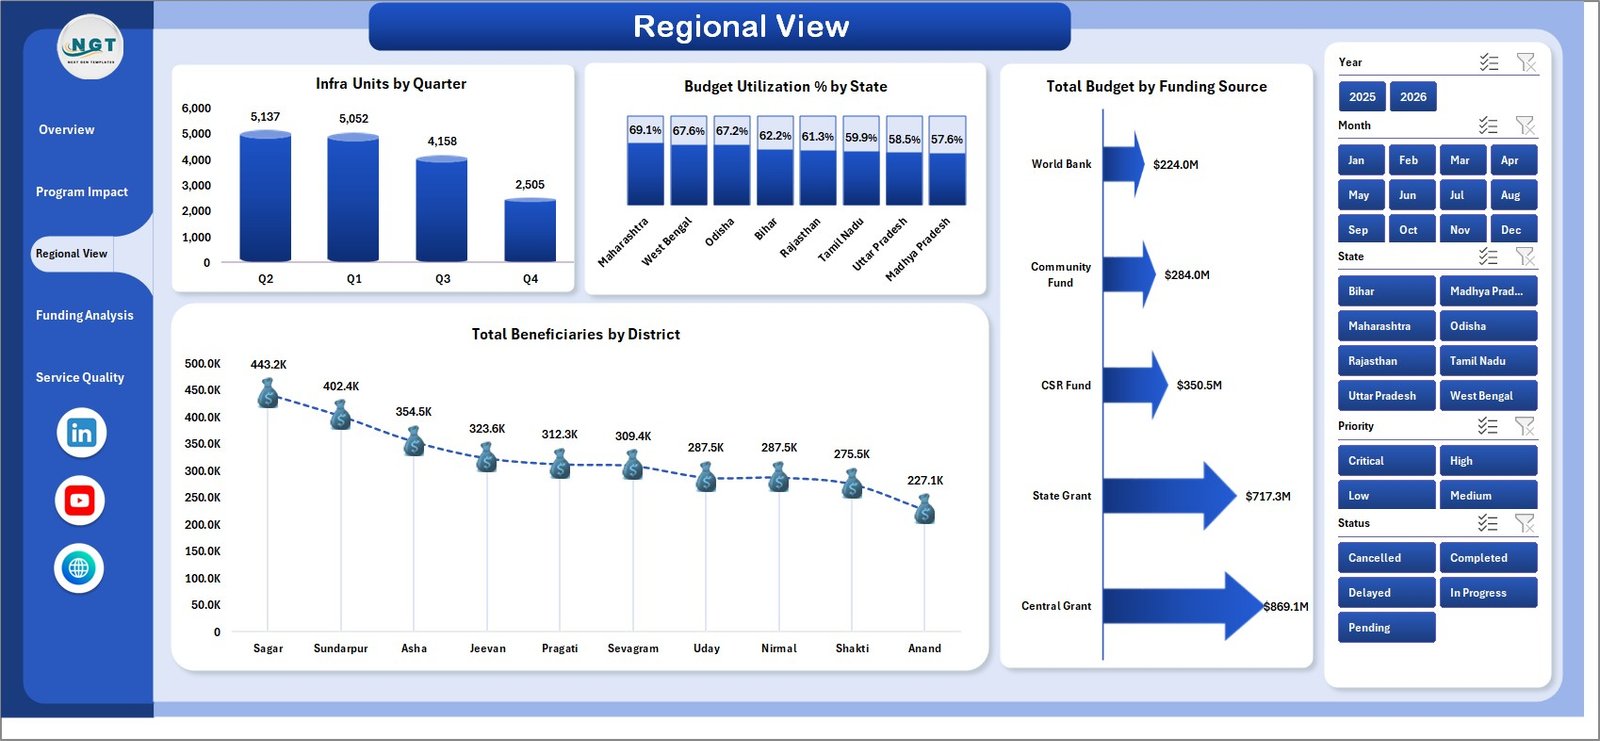
Regional View: This page helps compare geographic performance. Infra Units by Quarter shows infrastructure progress over time. Budget Utilization % by State highlights where funds are being used effectively or slowly. Total Budget by Funding Source compares government, donor, CSR, or other sources. Total Beneficiaries by District helps identify districts with high reach or areas needing attention.
Regional View
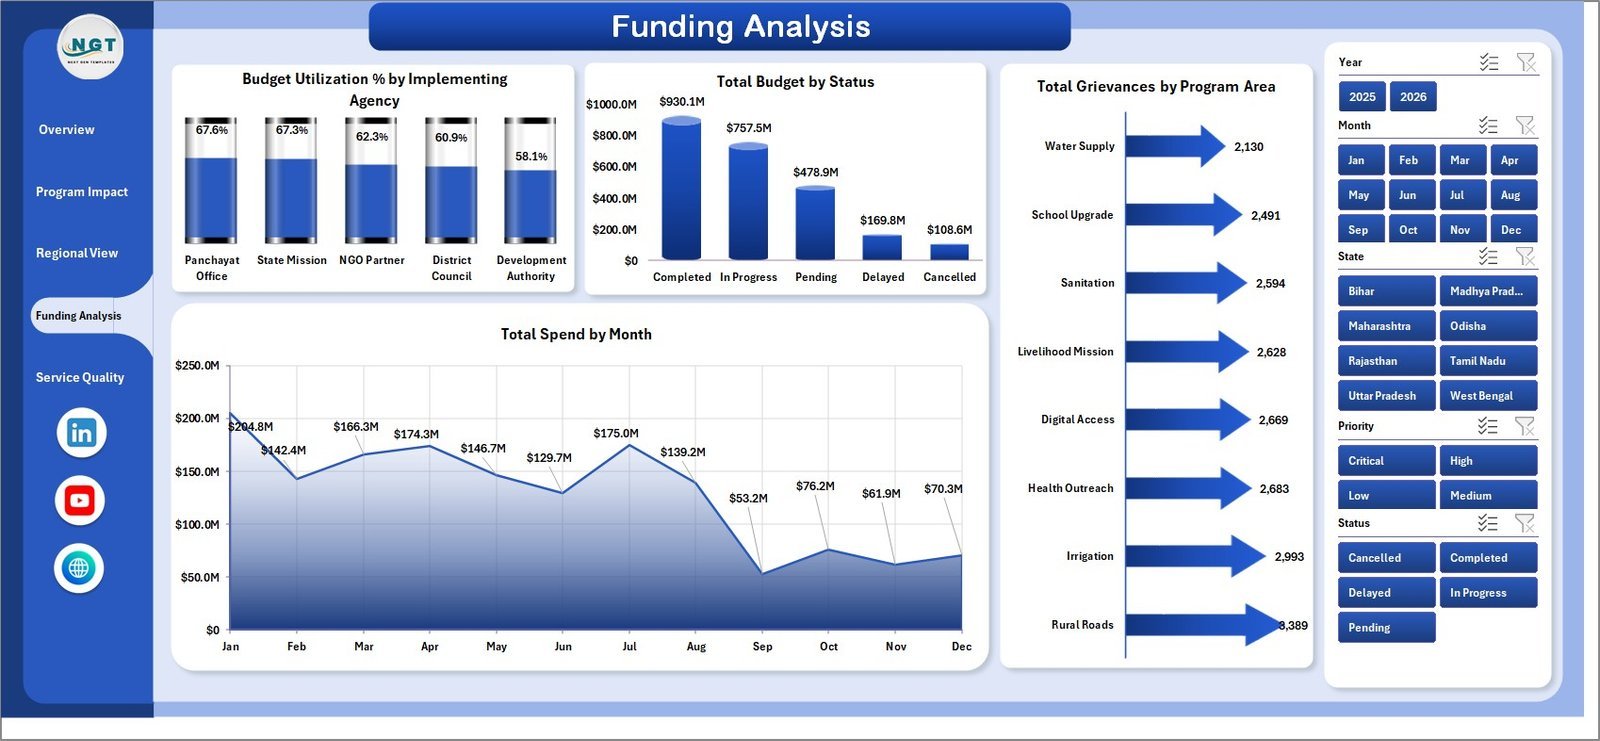
Funding Analysis: This tab tracks financial performance and operational signals. Budget Utilization % by Implementing Agency compares execution efficiency across agencies. Total Budget by Status shows budget distribution by approval, progress, completion, or other status categories. Total Grievances by Program Area highlights service issues by initiative. Total Spend by Month shows spending movement across the year.
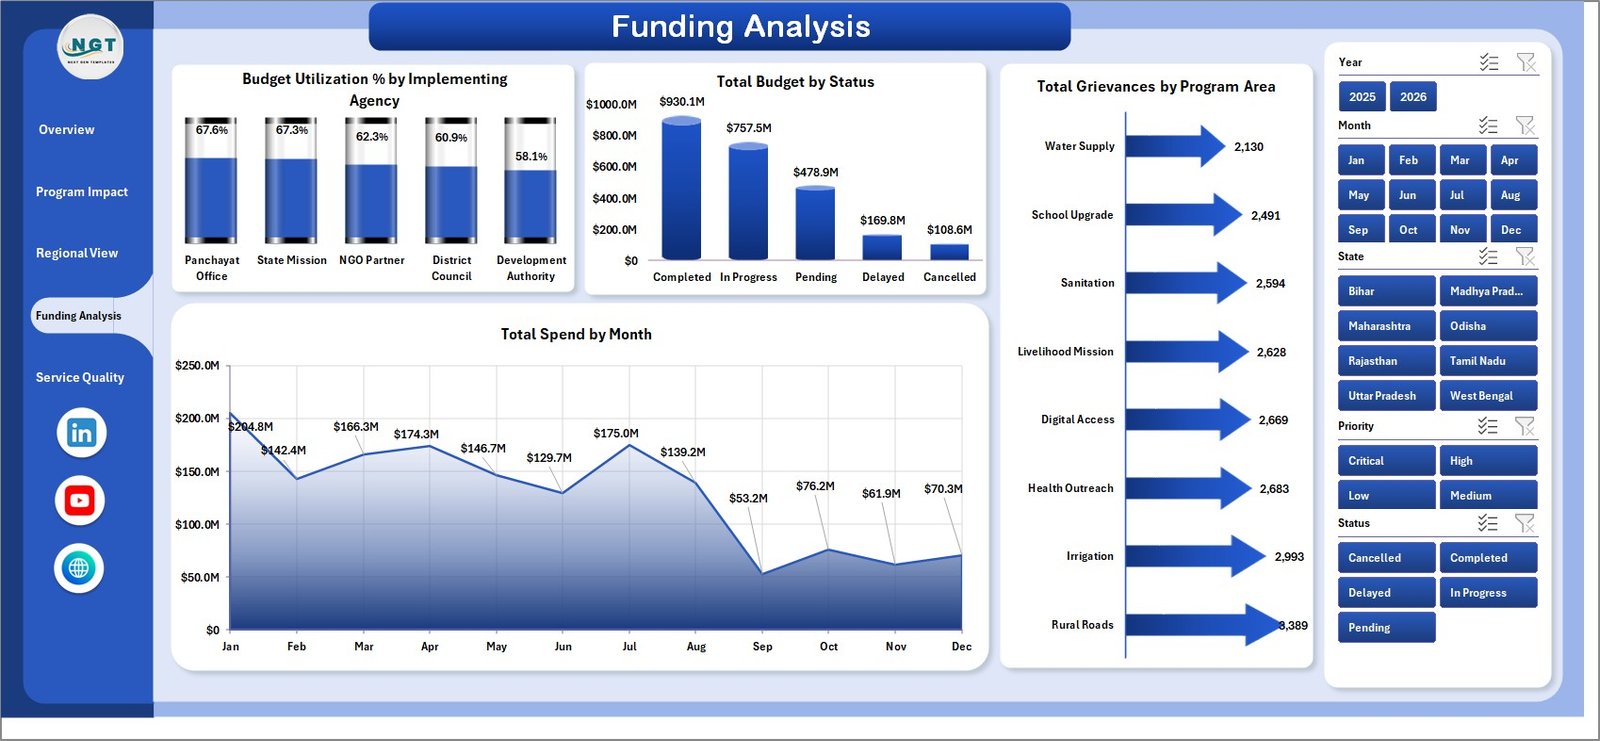
Funding Analysis
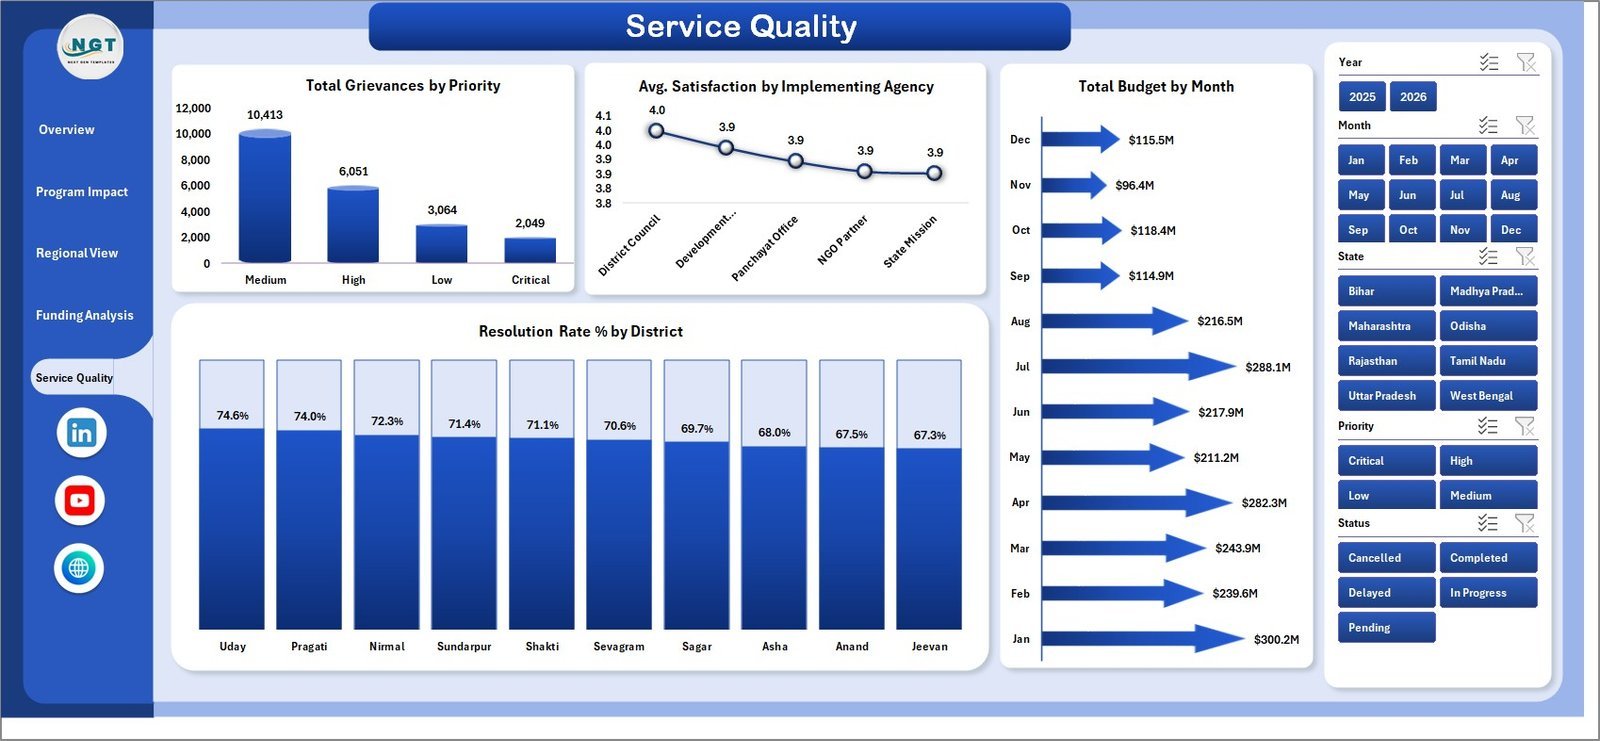
Service Quality: This page connects delivery with citizen or beneficiary experience. Total Grievances by Priority shows issue urgency. Avg. Satisfaction by Implementing Agency compares service quality. Total Budget by Month tracks budget allocation trends. Resolution Rate % by District shows where grievance handling is strong or needs improvement.
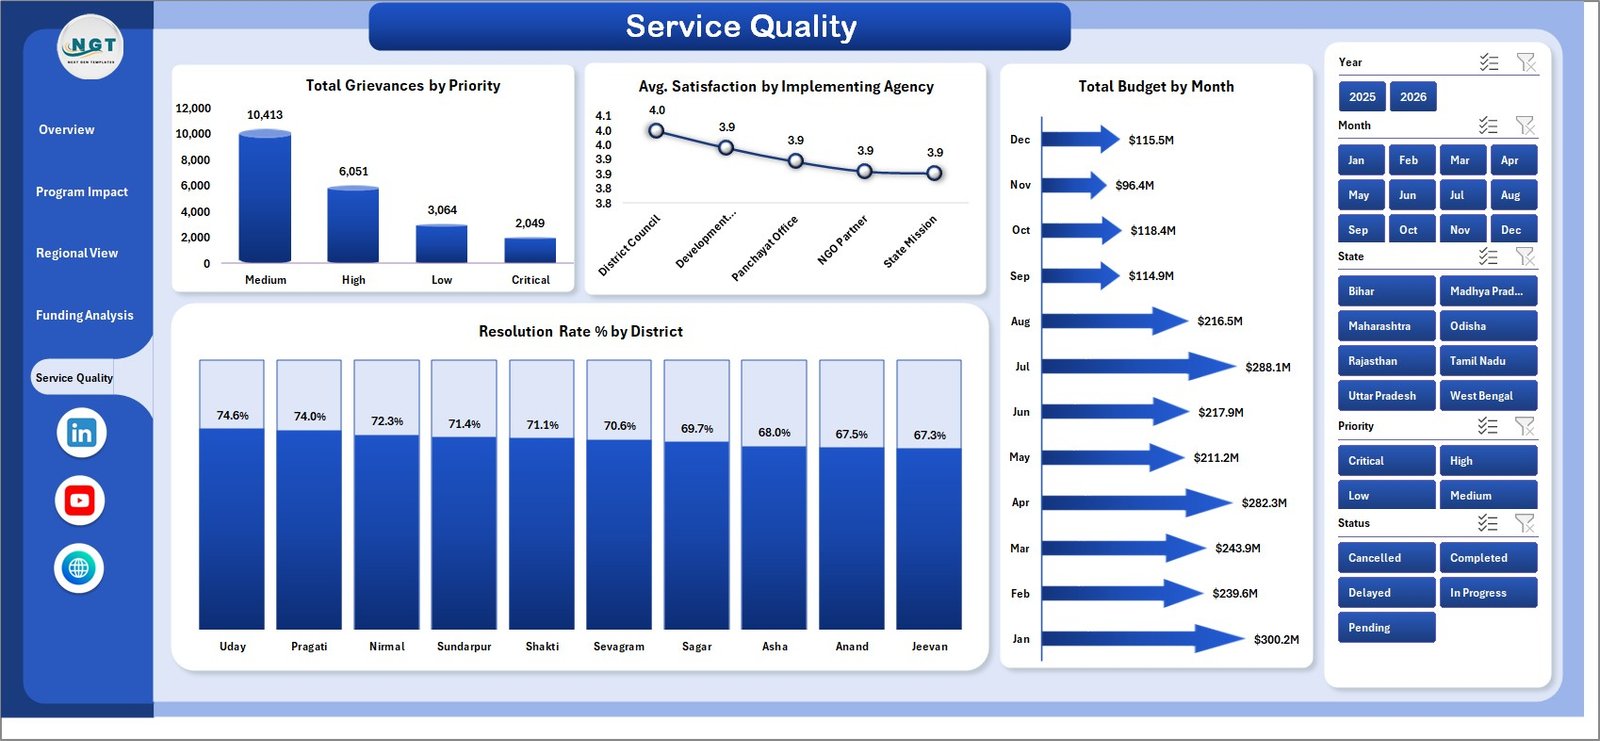
Service Quality
Data Sheet Tab: This is the main input sheet. Add or replace rural development records in the same column format, then refresh the dashboard to update the pivots, charts, cards, and slicer-based views.

Data Sheet tab
Support Sheet: This sheet contains the pivot tables that power the workbook. After updating the data sheet, go to the Excel Ribbon, open the Data tab, and click Refresh All. The pivots and charts will refresh automatically. You can keep this sheet hidden for a cleaner user experience.

Support sheet tab
Rural Development Dashboard in Excel vs. Google Sheets vs. Paid SaaS – Where This Fits
| Feature | This Excel Dashboard | Google Sheets Alternative | Paid SaaS Alternative |
|---|---|---|---|
| Cost | $17.99 sale price | Manual build or template | Monthly subscription |
| Setup time | Open, update data, refresh | Requires formula and chart setup | Often needs onboarding |
| Best use | Offline and Excel-based reporting | Live collaboration | Enterprise workflow automation |
| Custom fields | Edit the data sheet format | Editable but fragile | Configuration may be restricted |
| Program reporting | Built around rural development KPIs | Must be created manually | Usually broader than dashboard reporting |
Who This Template Is For – and Who It’s Not For
This template is for rural development departments, NGOs, grant managers, CSR teams, local administrators, and monitoring officers who use Excel and need repeatable dashboard reporting. It is especially useful when reporting beneficiaries, households, budgets, jobs, infrastructure units, grievances, satisfaction, agencies, districts, states, and funding sources.
It is not the right fit if you need live database integrations, mobile field data collection, automated email workflows, or a multi-user approval system. In those cases, a dedicated SaaS or custom web app may be better.
How to Use the Rural Development Dashboard in Excel
Download and unzip the file, then open it in Microsoft Excel. Go to the Data Sheet tab and replace the sample rows with your own rural development data using the same column structure. Open the Excel Ribbon, click Data, then Refresh All. Review each dashboard sheet and use slicers to filter by the dimensions available in your workbook.
Real-World Use Cases
A district program officer can monitor beneficiaries, households, jobs created, and budget utilization before monthly review meetings. An NGO monitoring manager can compare program areas, priorities, grievances, and satisfaction scores for donor reporting. A CSR operations team can track funding sources, implementing agencies, infrastructure units, and regional outcomes from one workbook.
Frequently Asked Questions
Does this dashboard require macros?
No special macro workflow is required for the dashboard pages described here. Update the data sheet and use Excel Refresh All to update the pivot-backed visuals.
Can I add my own rural development data?
Yes. Use the Data Sheet tab and keep the same column format so the pivots, slicers, cards, and charts continue to work correctly.
Can I hide the Support Sheet?
Yes. The Support Sheet contains pivot tables used to build the dashboard dynamically, so you can keep it hidden after setup.
What Excel version do I need?
The file is designed for Microsoft Excel. For best results, use a modern desktop version of Excel or Microsoft 365.
Can I customize the dashboard?
Yes. You can edit labels, colors, charts, slicers, and the data structure, but keep a backup before making major formula or pivot changes.
Is this suitable for government and NGO reporting?
Yes. The analysis pages cover beneficiaries, households, budgets, agencies, states, districts, funding sources, grievances, resolution, and satisfaction, which are common in rural development reporting.
About the Author
Built by PK – Microsoft Certified Professional with 15+ years of Excel, Google Sheets, and Power BI experience. Founder of NextGenTemplates, reaching 300K+ subscribers across YouTube channels. Every template is hand-built and tested before release.
Explore Related Templates
Explore more Excel Dashboard Templates, the Rural Development KPI Dashboard in Power BI, Community Services Dashboard in Excel, and Nonprofit Fundraising Dashboard in Excel.
Download the Rural Development Dashboard in Excel today and turn your rural program data into clear, refreshable reporting.
Last updated: August 7, 2026.























Reviews
There are no reviews yet.