



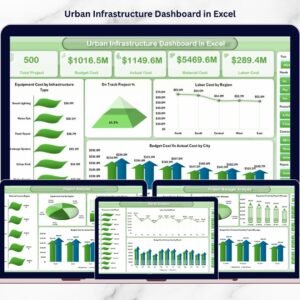
The Urban Development KPI Dashboard in Excel is a powerful tool designed for city planners, urban development professionals, and project managers to track and monitor key performance indicators (KPIs) related to urban development projects. Whether you’re working on infrastructure projects, urban planning, or environmental development, this Excel-based dashboard helps you track progress, manage resources, monitor finances, and ensure that your projects stay on schedule.
With customizable features, this dashboard provides real-time insights into project performance, helping you make data-driven decisions, optimize resource allocation, and ensure the success of urban development initiatives.

Key Features of the Urban Development KPI Dashboard in Excel:
🏙️ Project Progress and Milestones Tracking
Monitor the progress of urban development projects, track key milestones, and ensure that projects stay on schedule with the ability to adjust timelines when necessary.
💰 Budget and Cost Monitoring
Track the budget and financial performance of urban development projects, ensuring that costs stay within the allocated budget and identifying any potential financial issues early on.
📊 Resource Allocation
Track the allocation of resources such as labor, materials, and equipment to ensure that projects are efficiently resourced and that there are no delays due to resource shortages.
📅 Timeline Management
Track timelines for various stages of urban development projects, from planning to execution, ensuring that the project meets its deadlines.
📈 Sustainability and Environmental Impact
Monitor environmental metrics related to urban development projects, including sustainability goals, environmental impact assessments, and eco-friendly building initiatives.
🚀 Why You’ll Love the Urban Development KPI Dashboard in Excel:
✅ Track Project Progress – Monitor the progress of key urban development projects and ensure that milestones are met on time.
✅ Manage Budgets Effectively – Track project budgets, expenditures, and financial performance to ensure the project stays within budget.
✅ Optimize Resource Allocation – Monitor resource allocation to ensure that projects are efficiently resourced and that there are no delays.
✅ Ensure Timely Delivery – Track project timelines and ensure that all stages of urban development projects are completed on schedule.
✅ Promote Sustainability – Monitor sustainability metrics to ensure that the urban development projects are environmentally friendly and eco-conscious.
✅ Fully Customizable and Interactive – Tailor the dashboard to meet the specific needs of your urban development projects, with interactive features for real-time insights and better decision-making.
What’s Inside the Urban Development KPI Dashboard in Excel:
Project Progress Tracking: Monitor milestones, project stages, and completion percentages to track overall project progress and ensure timely delivery.
Budget and Cost Tracking: Track total costs, expenditures, and financial performance for each project to ensure budget compliance.
Resource Allocation: Track resources allocated to each project, including labor, materials, and equipment, to optimize resource usage and avoid shortages.
Timeline Management: Track deadlines, milestones, and timelines for every phase of the project to ensure on-time completion.
Sustainability Tracking: Monitor environmental sustainability goals, eco-friendly initiatives, and assess the impact of the development project on the environment.
Custom Reports: Generate detailed reports summarizing key metrics such as budget, resource usage, and project milestones for better decision-making.
How to Use the Urban Development KPI Dashboard in Excel:
1️⃣ Download the Template – Instantly access your Excel file upon purchase.
2️⃣ Input Project Data – Enter project milestones, budget, resource allocation, and sustainability goals to begin tracking key KPIs.
3️⃣ Monitor Key Metrics – Use the dashboard to track project progress, financials, resources, and sustainability goals in real-time.
4️⃣ Analyze Financials – Track budget adherence, costs, and expenditures to ensure financial health throughout the project lifecycle.
5️⃣ Generate Reports – Create custom reports summarizing project progress, resource allocation, and sustainability efforts for better project planning and decision-making.
Who Can Benefit from the Urban Development KPI Dashboard in Excel:
City Planners and Urban Development Professionals
Project Managers and Coordinators
Environmental Consultants and Sustainability Experts
Financial Analysts in Urban Development
Government Agencies and Municipalities
Real Estate Developers
Construction and Infrastructure Managers
Business Analysts and Consultants
The Urban Development KPI Dashboard in Excel is an ideal tool for managing and optimizing urban development projects. By tracking key metrics such as project progress, financial performance, resource allocation, and sustainability goals, this dashboard helps ensure that urban development initiatives are completed on time, within budget, and with minimal environmental impact.
Click here to read the Detailed blog post
https://www.pk-anexcelexpert.com/urban-development-kpi-dashboard-in-excel/
Visit our YouTube channel to learn step-by-step video tutorials
Youtube.com/@PKAnExcelExpert
Compatibility and Requirements
- Works in Microsoft Excel desktop (Excel 2016 or later, or Microsoft 365).
- Charts and calculations are built into the workbook, so there is nothing else to install.
- New to Excel charts? Microsoft explains the basics in Create a chart from start to finish.
Frequently Asked Questions
What does the Urban Development KPI Dashboard track?
Project progress and milestones, budgets and costs, resource allocation, timelines, and sustainability and environmental impact.
What data do I need to enter?
Project milestones, budget figures, resource allocation such as labor, materials and equipment, and sustainability goals.
Can I create reports from it?
Yes. You can generate reports that summarize budget, resource usage and project milestones.
Is there a Power BI version?
Yes. See the Urban Development KPI Dashboard in Power BI.
Related Urban Development Templates
- Urban Development KPI Dashboard in Power BI: the same topic in Power BI
- Urban Development KPI Dashboard in Google Sheets: the online edition
- Housing & Urban Development KPI Dashboard in Excel: adds housing programs
- Urban Infrastructure KPI Dashboard in Excel: for infrastructure projects
- Construction Project Intelligence Kit: 6 construction templates in one bundle
Browse all Excel KPI dashboards or the Excel project management templates.
































Reviews
There are no reviews yet.