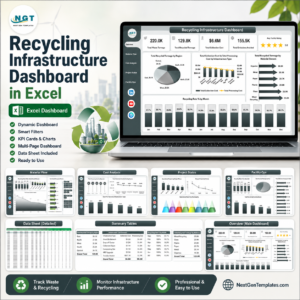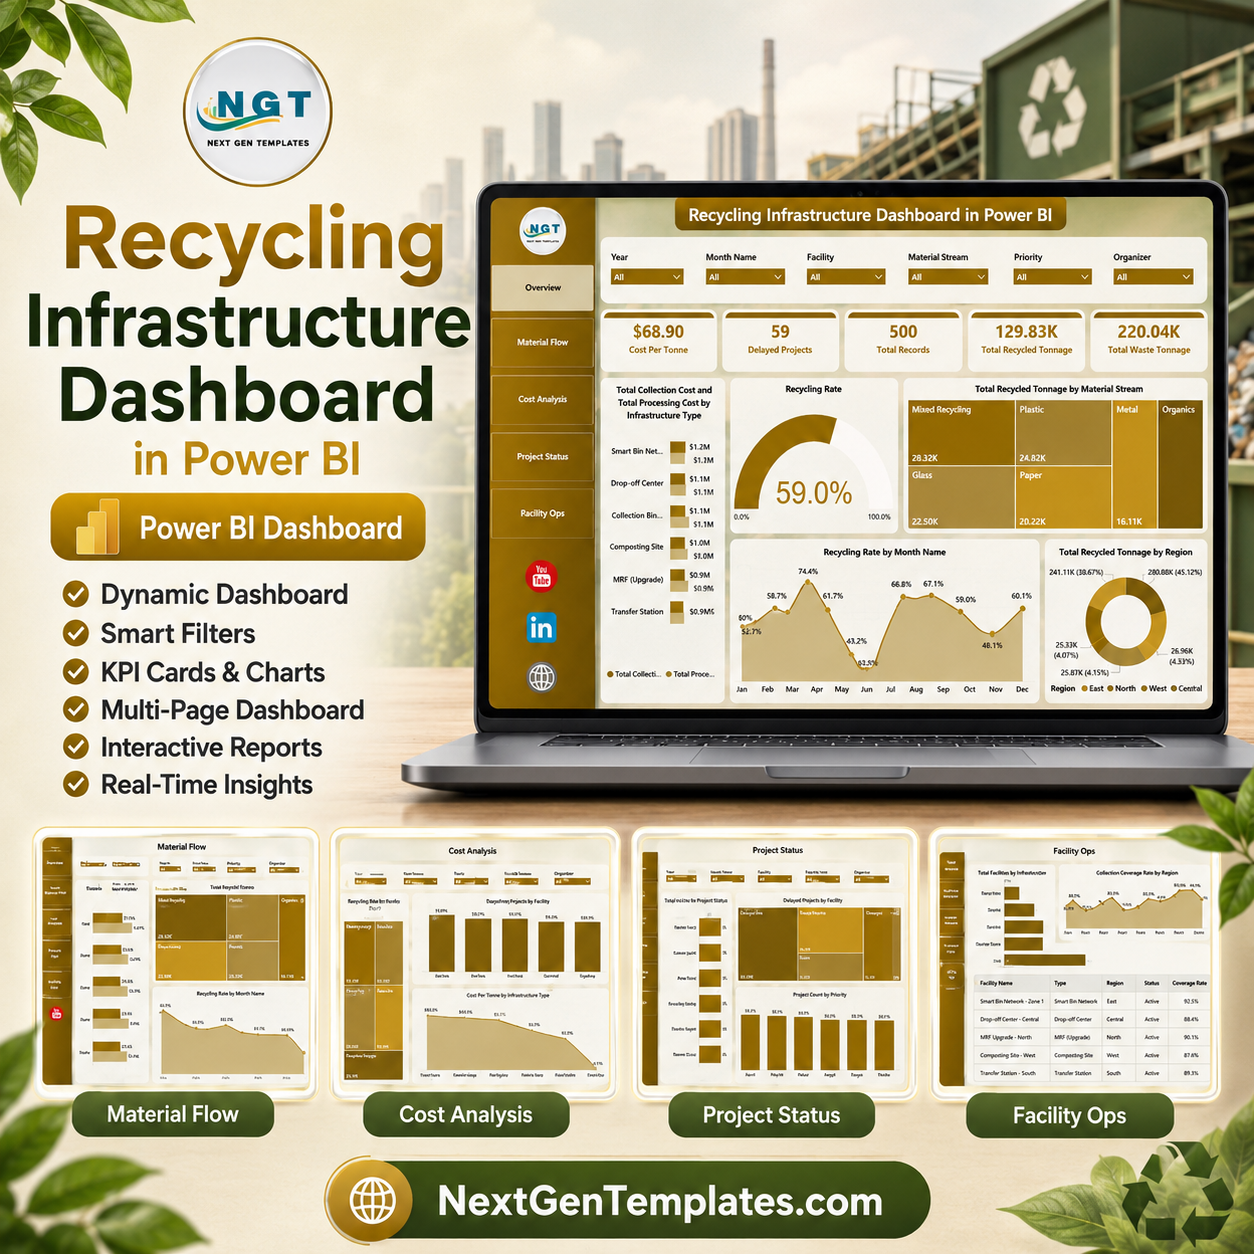
Recycling Infrastructure Dashboard in Power BI helps environmental teams track recycling performance, cost pressure, and operational status across 5 dashboard pages. Recycling programs often involve thousands of tonnes of waste, multiple material streams, regional operators, delayed infrastructure projects, and collection plus processing costs that can shift every month. This dashboard gives you a structured way to review those signals in one Power BI file, with KPI cards, slicers, and visual analysis pages designed for fast review. Built by PK, backed by 15+ years of Excel and Power BI experience and 300K+ YouTube subscribers, this template is a practical digital download you can adapt to your own data before publishing internal reports.
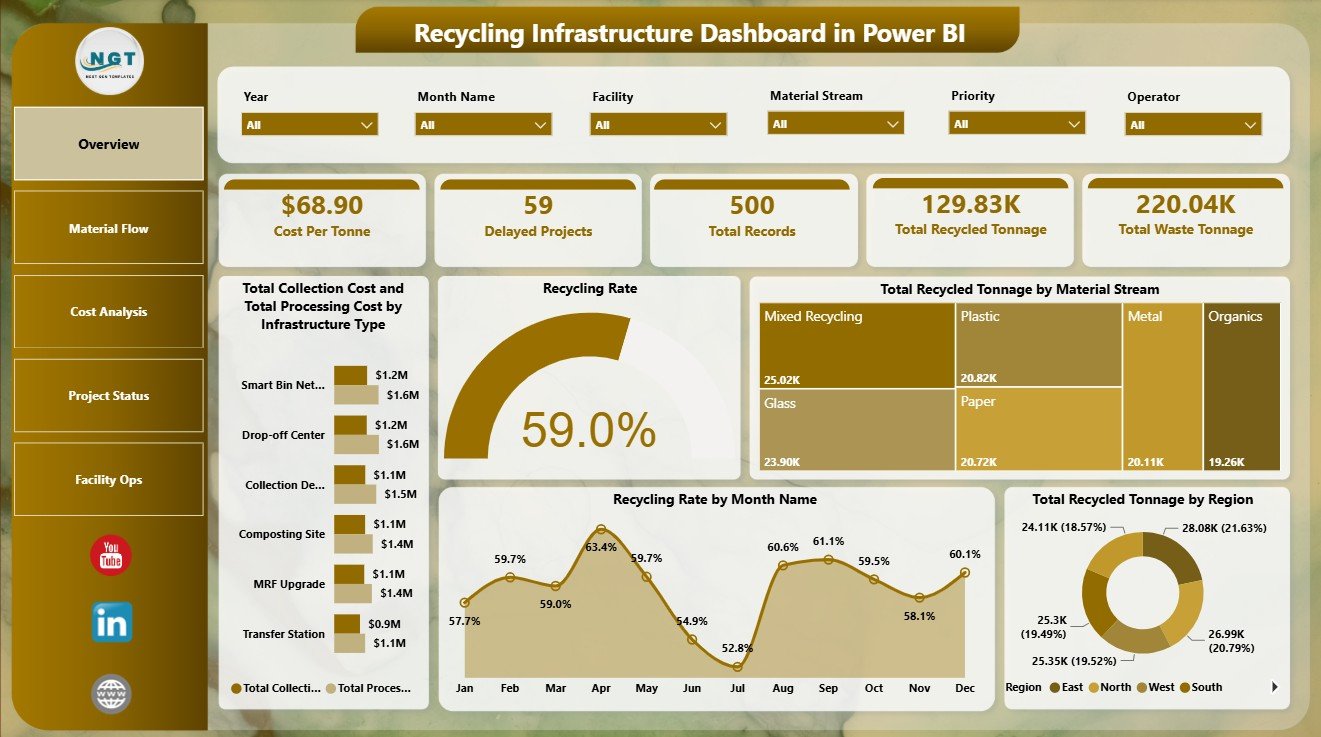
Overview Page
Key Features of Recycling Infrastructure Dashboard in Power BI
- 5 report pages: Overview, Material Flow, Cost Analysis, Project Status, and Facility Ops.
- High-level KPI cards for cost per tonne, delayed projects, total records, recycled tonnage, and waste tonnage.
- Charts for collection cost, processing cost, recycling rate, material stream, monthly trend, region, facility, funding source, operator, and municipality analysis.
- Built-in slicers to filter the dashboard quickly and compare filtered results.
- Editable Power BI format so users can update source data, customize visuals, and publish internally.
What’s Inside the Recycling Infrastructure Dashboard in Power BI
Overview Page: The top cards summarize Cost Per Tonne, Delayed Projects, Total Records, Total Recycled Tonnage, and Total Waste Tonnage. These cards give managers an instant read on scale, efficiency, and project risk before they move into detailed views.
Total Collection Cost and Total Processing Cost by Infrastructure Type: This chart compares the two largest cost categories across infrastructure groups. It helps identify which facility types create the highest operating burden and where cost improvement conversations should begin.
Recycling Rate by Overall Dashboard: This visual shows broad recycling performance across the selected filters. It is useful for checking whether the current region, operator, or time period is moving toward the expected recovery rate.
Total Recycled Tonnage by Material Stream: This chart shows which recyclable streams contribute the most volume. Recycling Rate by Month Name highlights seasonal changes, while Total Recycled Tonnage by Region shows geographic distribution of recovered material.
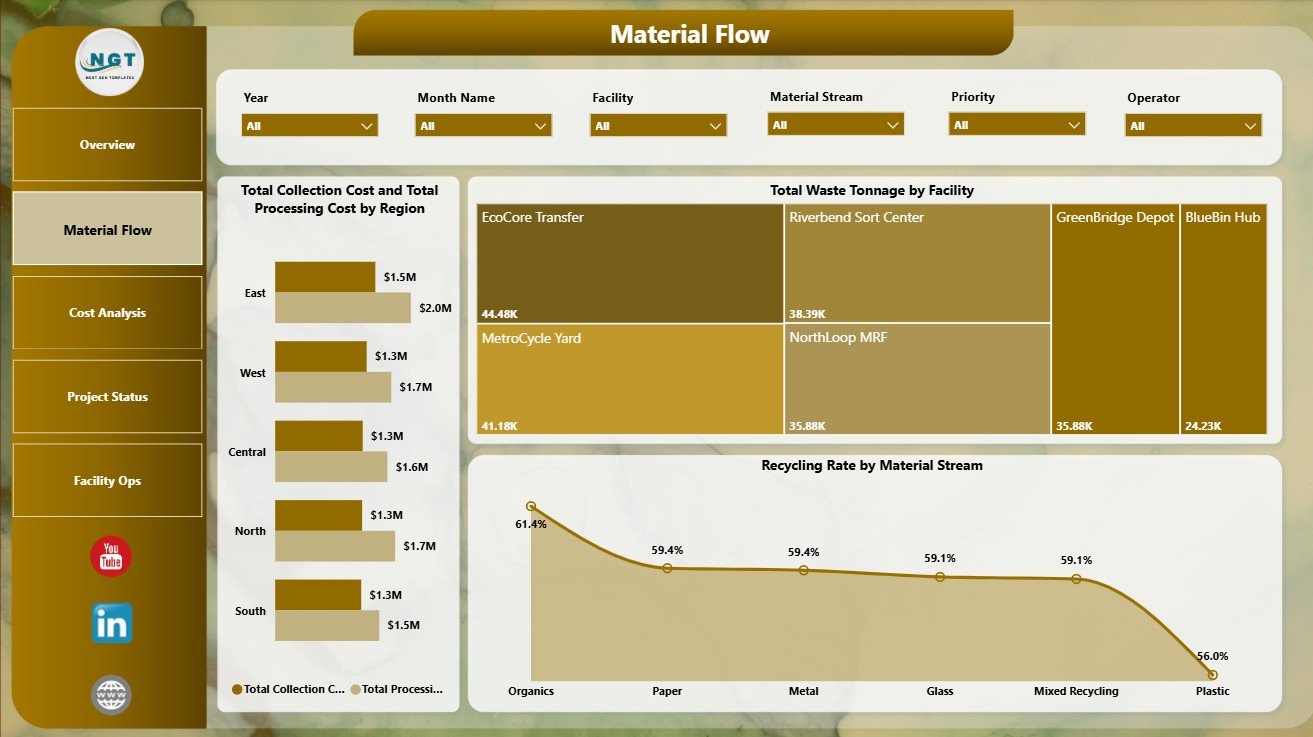
Material Flow
The Material Flow page reviews Total Collection Cost and Total Processing Cost by Region, Total Waste Tonnage by Facility, and Recycling Rate by Material Stream. This page is useful when you need to understand where waste volume is moving and which streams are converting most efficiently into recycled output.
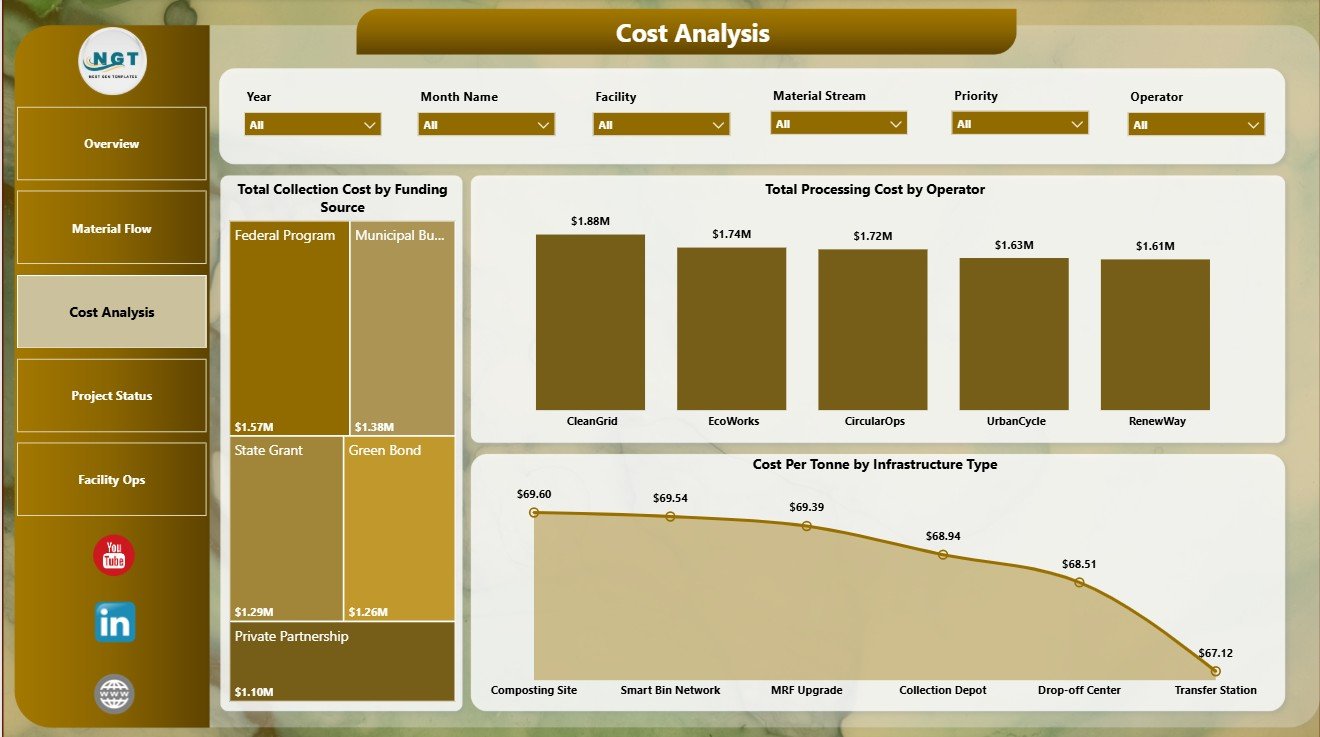
Cost Analysis
The Cost Analysis page includes Total Collection Cost by Funding Source, Total Processing Cost by Operator, and Cost Per Tonne by Infrastructure Type. Use it to compare financial responsibility, operator cost patterns, and unit economics across infrastructure categories.
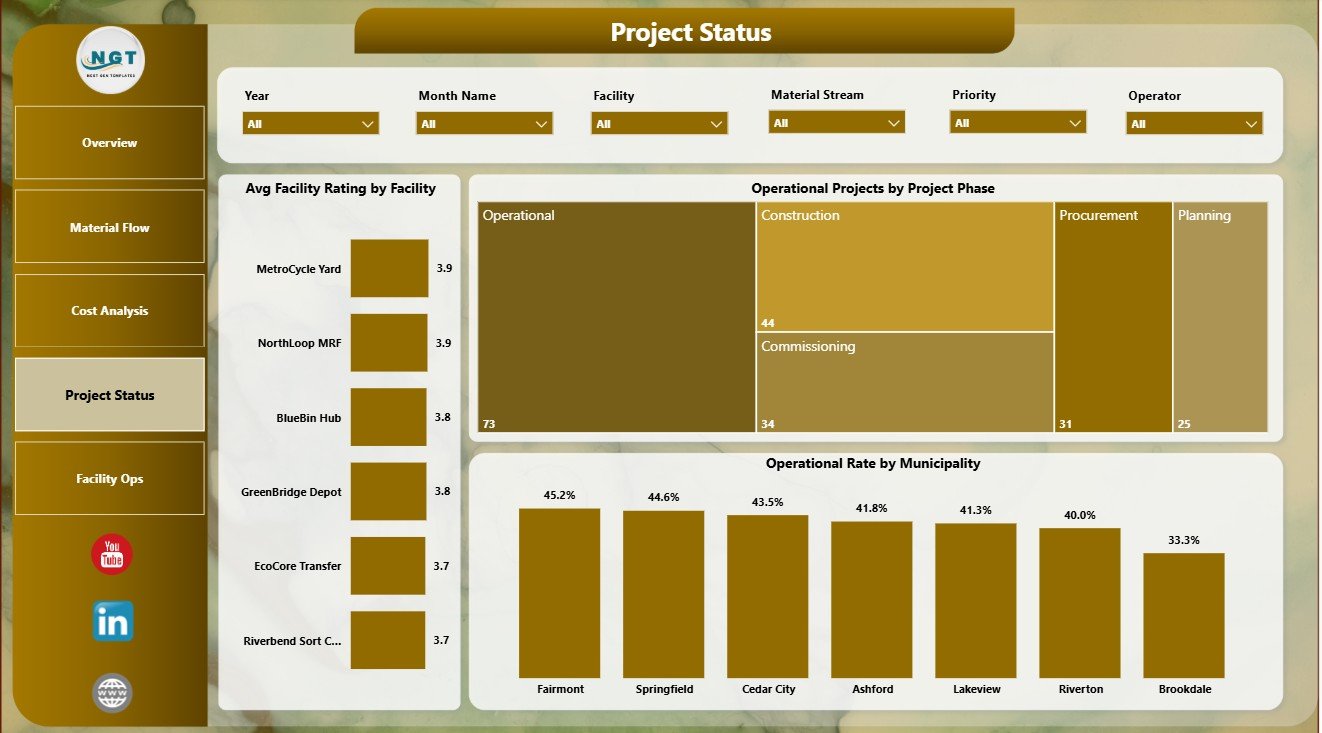
Project Status
The Project Status page tracks Avg Facility Rating by Facility, Operational Projects by Project Phase, and Operational Rate by Municipality. This helps teams spot low-performing facilities, monitor project readiness, and compare municipal execution.
Facility Ops
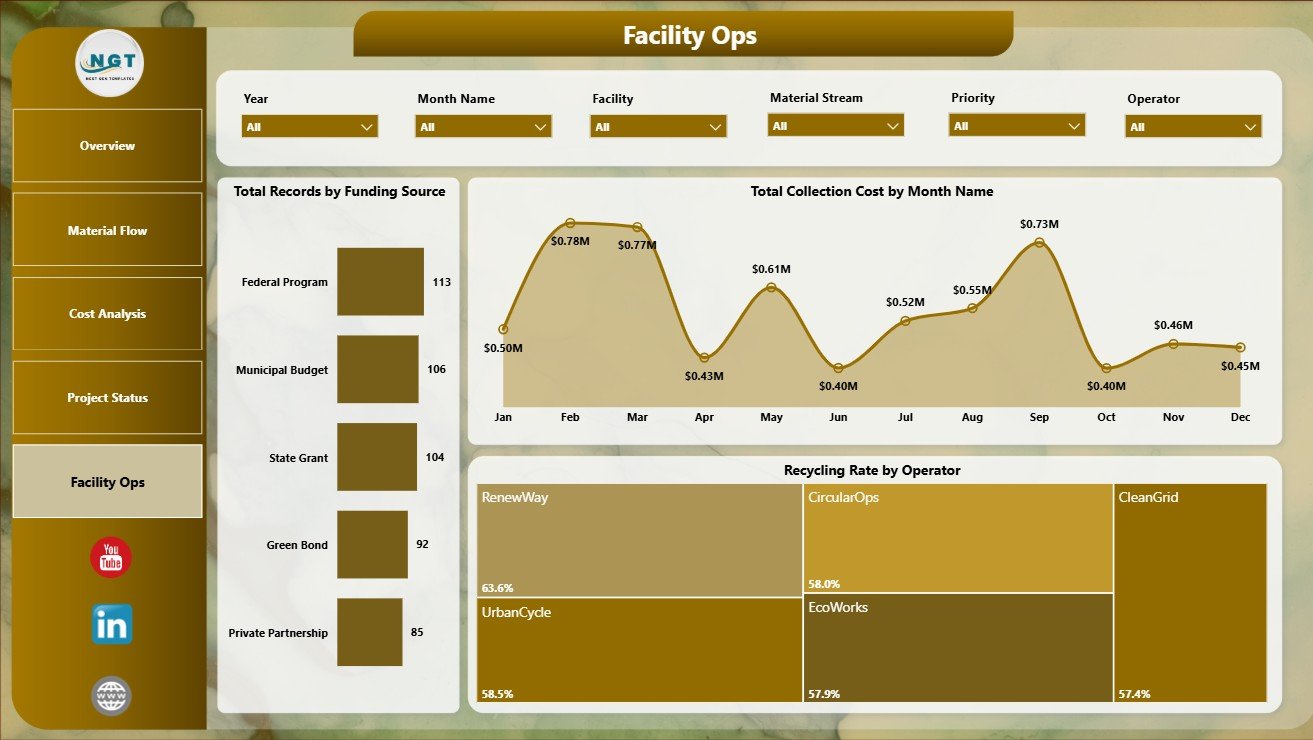
The Facility Ops page includes Total Records by Funding Source, Total Collection Cost by Month Name, and Recycling Rate by Operator. It supports recurring operational reviews where teams connect activity volume, cost timing, and operator-level recycling performance.
Recycling Infrastructure Dashboard in Power BI vs. Tableau vs. Paid SaaS – Where This Fits
| Area | This Power BI template | Tableau alternative | Paid SaaS alternative |
|---|---|---|---|
| Cost | One-time template purchase | Requires Tableau licensing | Usually monthly or annual subscription |
| Platform | Power BI Desktop and Power BI Service | Tableau Desktop or Tableau Cloud | Vendor-hosted app |
| Setup time | Fast if your data matches the template fields | Requires rebuilding visuals or adapting a workbook | Depends on onboarding and configuration |
| Customizable fields | Editable model, visuals, and measures | Editable with Tableau knowledge | Often limited by plan or admin settings |
| Year-1 cost at 5 users | Template price plus Power BI licensing | Licensing can be higher for multi-user teams | Can become expensive as users grow |
Who This Template Is For – and Who It’s Not For
This template is for environmental operations teams, municipal recycling managers, sustainability analysts, public works departments, waste management consultants, and infrastructure planning teams that want a Power BI dashboard they can adapt without starting from a blank page.
It is not for teams that need live IoT sensor ingestion, route optimization, legal compliance filing, or a fully hosted multi-user SaaS system out of the box.
How to Use the Recycling Infrastructure Dashboard in Power BI
- Download and unzip the product file.
- Open the .pbix file in Power BI Desktop.
- Review the sample fields and map your recycling data to the same structure.
- Refresh the model and check the Overview page first.
- Use slicers to filter by region, operator, facility, material stream, month, funding source, or other fields.
- Customize colors, labels, measures, and pages as needed.
Real-World Use Cases
Municipal Recycling Manager: A city recycling manager can review delayed projects, waste tonnage, recycled tonnage, and recycling rate during monthly performance meetings.
Environmental Consultant: A consultant can use the Material Flow and Cost Analysis pages to compare regions, identify high-cost operators, and prepare client recommendations.
Infrastructure Program Lead: A program lead can monitor operational projects by phase, facility ratings, and municipality-level operational rates before funding reviews.
Frequently Asked Questions
Does this dashboard work in Power BI Desktop?
Yes. Open the .pbix file in Power BI Desktop, replace the sample data with your own source, and refresh the dashboard.
Can I customize the visuals?
Yes. You can edit chart types, titles, colors, slicers, measures, relationships, and report pages in Power BI.
Does it include sample data?
The downloadable file is designed as a working template with sample-style structure so you can understand the fields before connecting your own data.
Can I use it for municipal waste reporting?
Yes, it is suitable for municipal and regional recycling infrastructure tracking when your data includes comparable fields.
Is this a SaaS subscription?
No. This is a one-time digital template purchase, not a hosted SaaS platform.
Can I publish it to Power BI Service?
Yes, if your organization uses Power BI Service and you have the appropriate Microsoft licensing.
About the Author
Built by PK – Microsoft Certified Professional with 15+ years of Excel, Google Sheets, and Power BI experience. Founder of NextGenTemplates, reaching 300K+ subscribers across YouTube channels. Every template is hand-built and tested before release.
Explore Related Templates
- Recycling Infrastructure Dashboard in Excel
- Recycling Infrastructure KPI Dashboard in Power BI
- Power BI templates
- Power BI dashboard templates
Download the Recycling Infrastructure Dashboard in Power BI today and give your recycling program a clearer way to track tonnage, cost, project status, material streams, regions, and facility operations.
Last updated: August 2, 2026