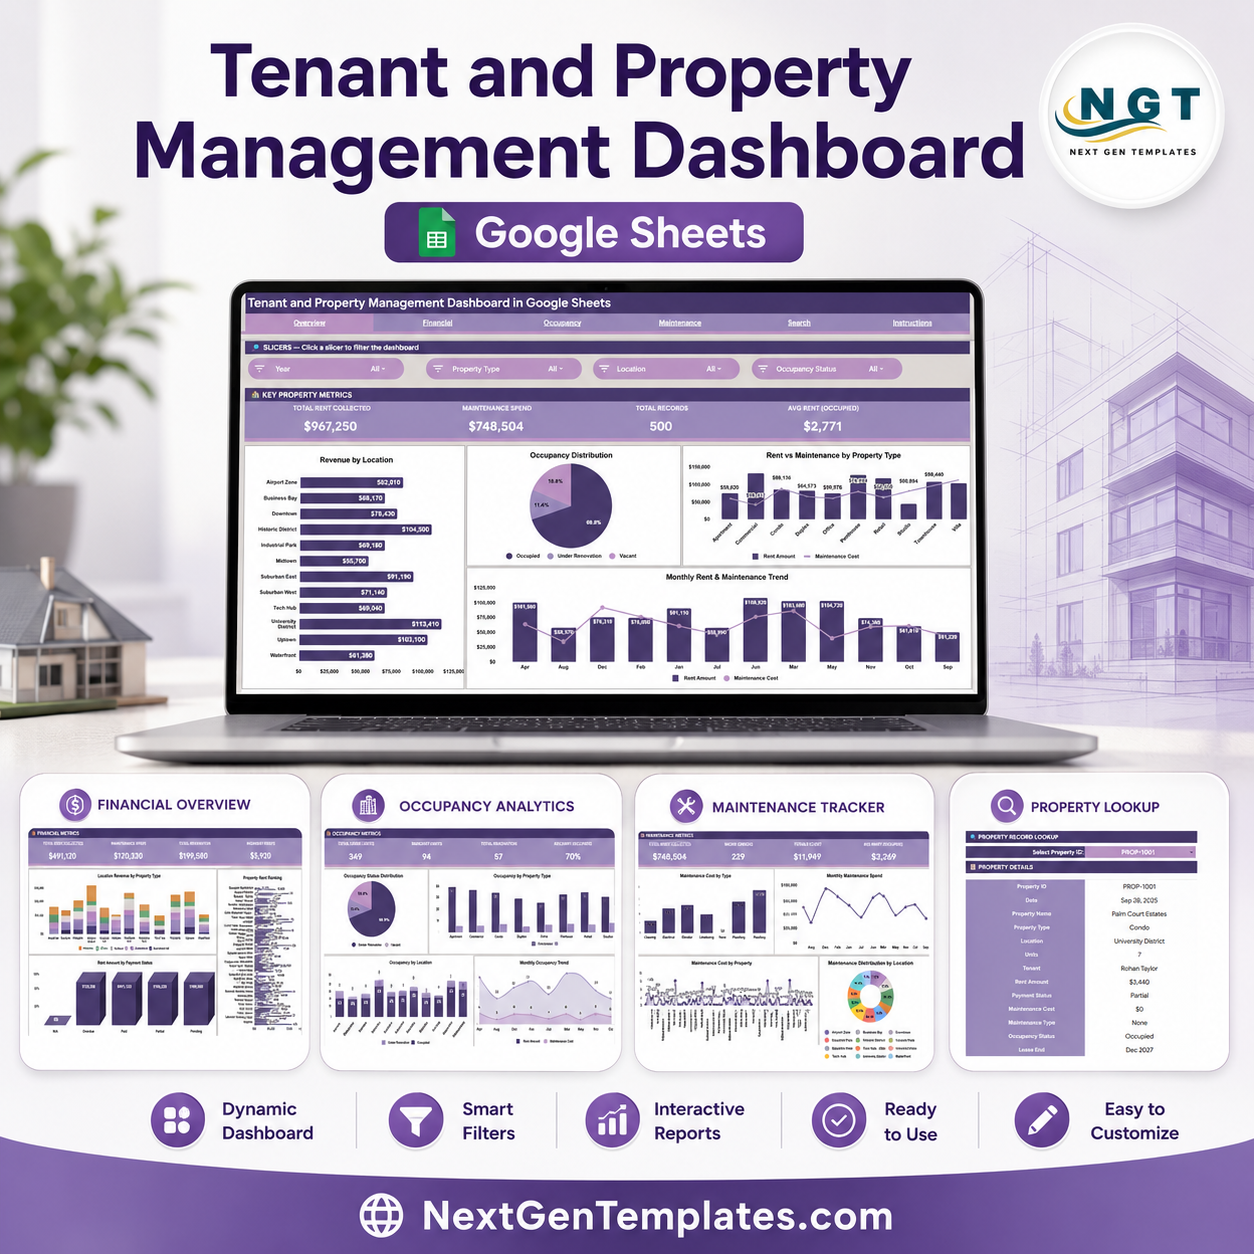
The Tenant and Property Management Dashboard in Google Sheets tracks 4 headline KPIs and 15 pre-built charts across 6 linked sheets — Overview, Financial, Occupancy, Maintenance, Search and Data. Slicers sit at the top of every analysis page, so filtering rent, occupancy and maintenance figures by location or property type takes one click.
Setup takes under 10 minutes. Paste your property records into the Data sheet in the same column order and every card, chart and ranking recalculates on its own — no formulas to rewrite, no chart ranges to redefine.
🌍 Join 8,400+ teams in 40+ countries using NextGenTemplates to replace paid SaaS tools with one-time-purchase Excel, Google Sheets, Power BI and HTML templates.
✅ Instant download · One-time payment · No subscription · No per-user fees · Lifetime access
🔑 Key Features of the Tenant and Property Management Dashboard in Google Sheets
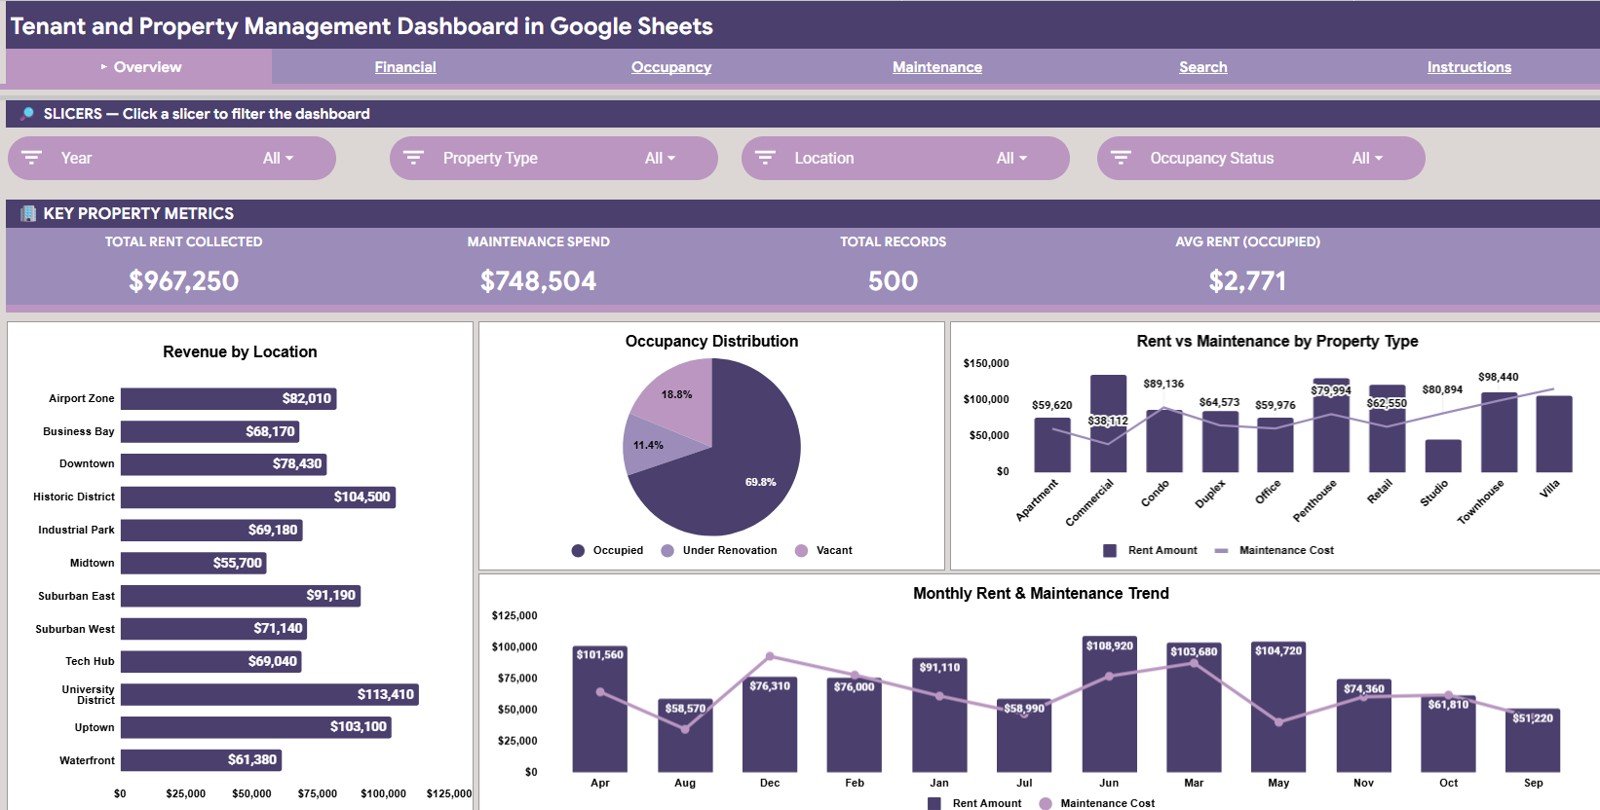
- 📊 4 executive KPI cards — Total Rent Collected, Maintenance Spend, Total Records and Avg Rent (Occupied) sit across the top of the Overview page and recalculate every time a slicer changes.
- 📈 15 charts across 4 analysis pages — 4 on Overview, 3 on Financial, 4 on Occupancy and 4 on Maintenance. Every chart is already bound to the Data sheet, so you never open a chart editor.
- 🎛️ Slicer-driven filtering — filter by location, property type, payment status and occupancy status. Cards and charts on the page respond together, not one at a time.
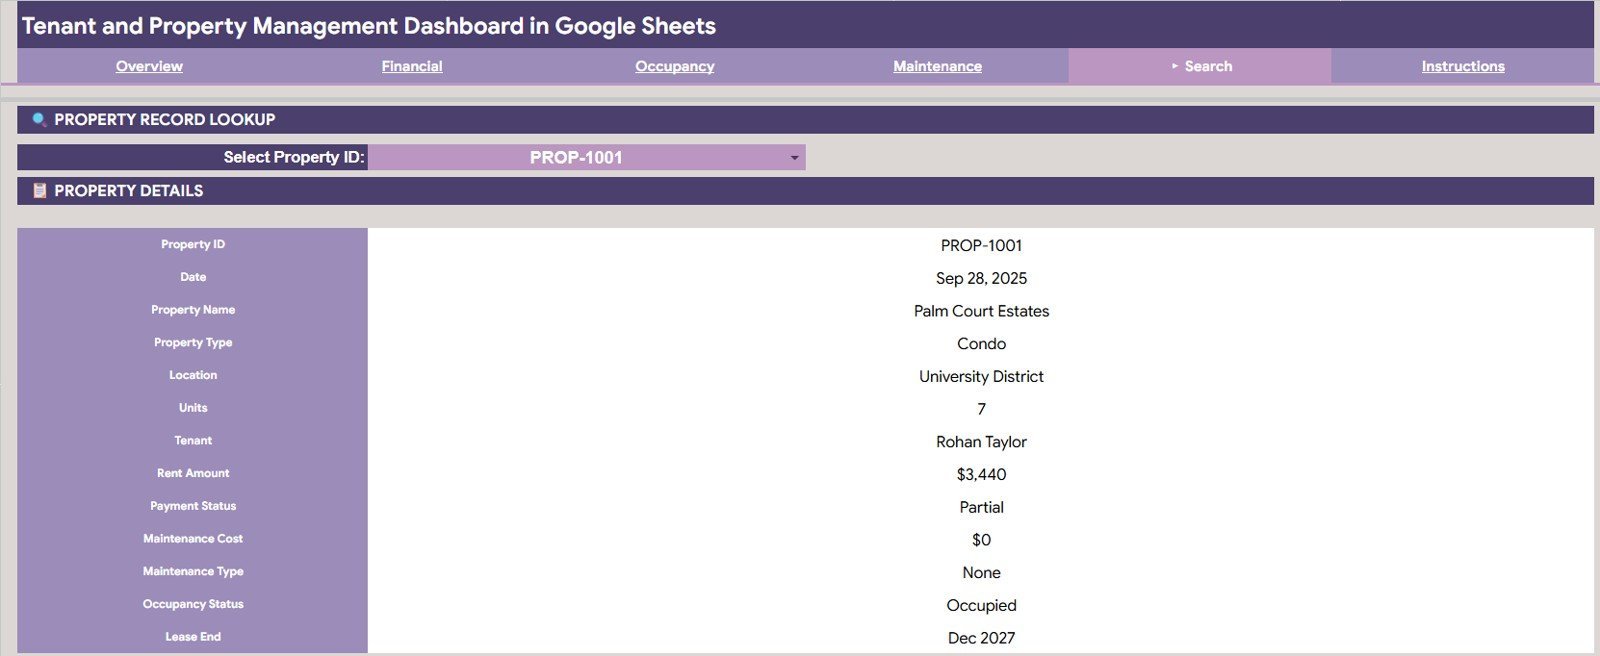
- 🔍 Property ID lookup sheet — choose a Property ID from a dropdown and the sheet returns property name, property type, location, units, tenant, rent amount, payment status, maintenance cost, maintenance type, occupancy status and lease end date.
- 💰 Rent versus maintenance comparison — the Rent vs Maintenance by Property Type chart shows which asset classes earn well on paper but lose margin to repairs.
- 🏆 Property Rent Ranking — orders every property by rent contribution, so top and bottom performers are visible without sorting anything by hand.
- ☁️ Runs entirely in Google Sheets — nothing to install, works on desktop, tablet and phone, and shares with a view-only link in two clicks.
📦 What’s Inside the Tenant and Property Management Dashboard in Google Sheets
Page 1: Overview
Four KPI cards — Total Rent Collected, Maintenance Spend, Total Records and Avg Rent (Occupied) — sit across the top, with slicers beside them for instant filtering. Charts include Revenue by Location, Occupancy Distribution by Status, Rent vs Maintenance by Property Type and Monthly Rent and Maintenance Trend.
Page 2: Financial
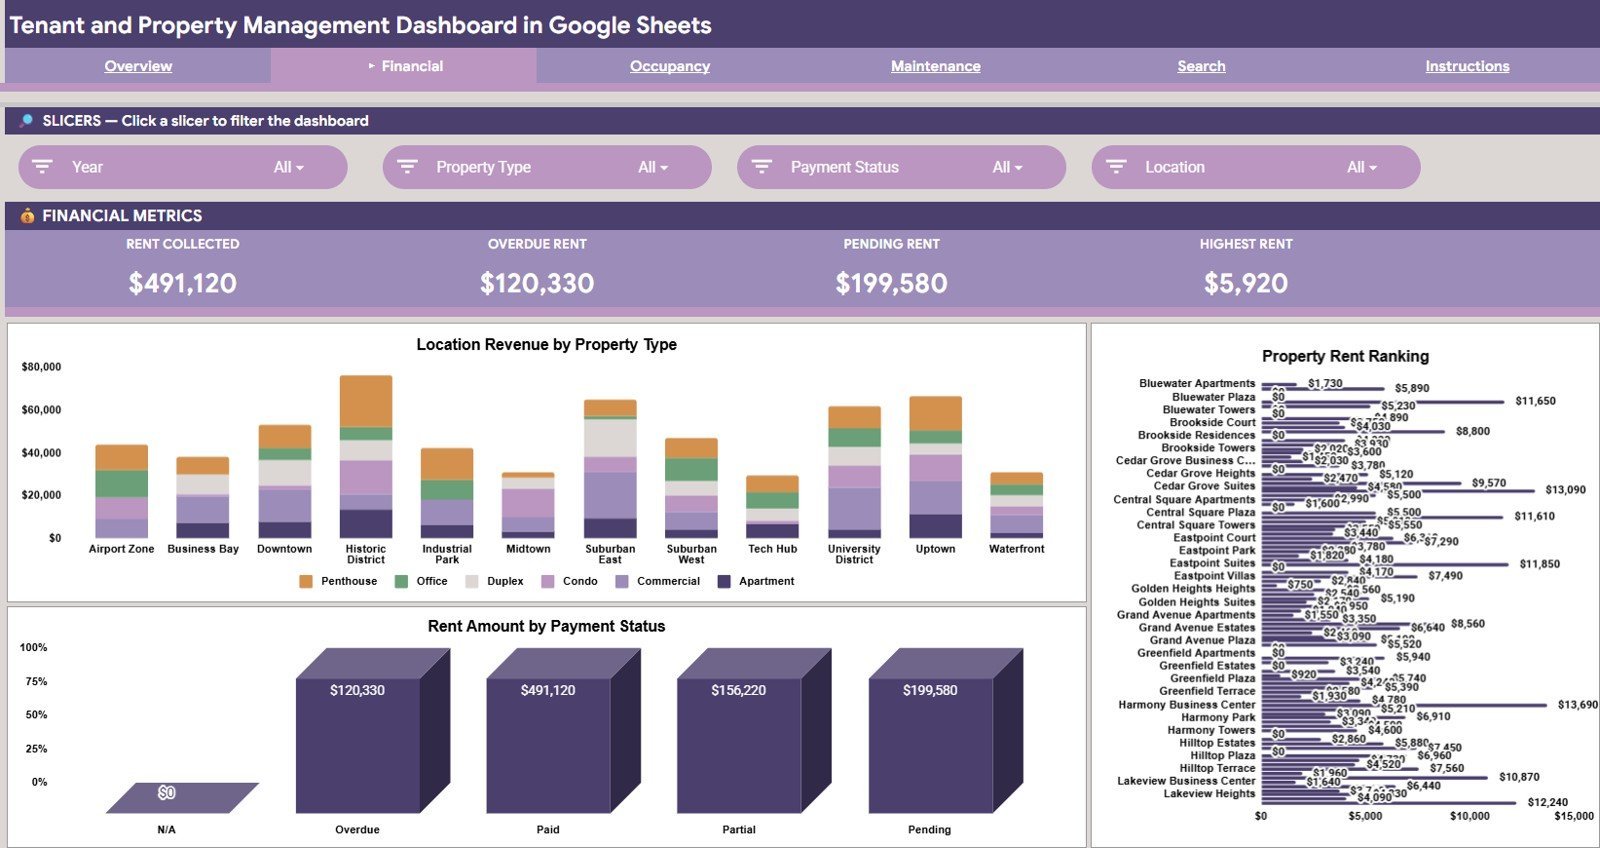
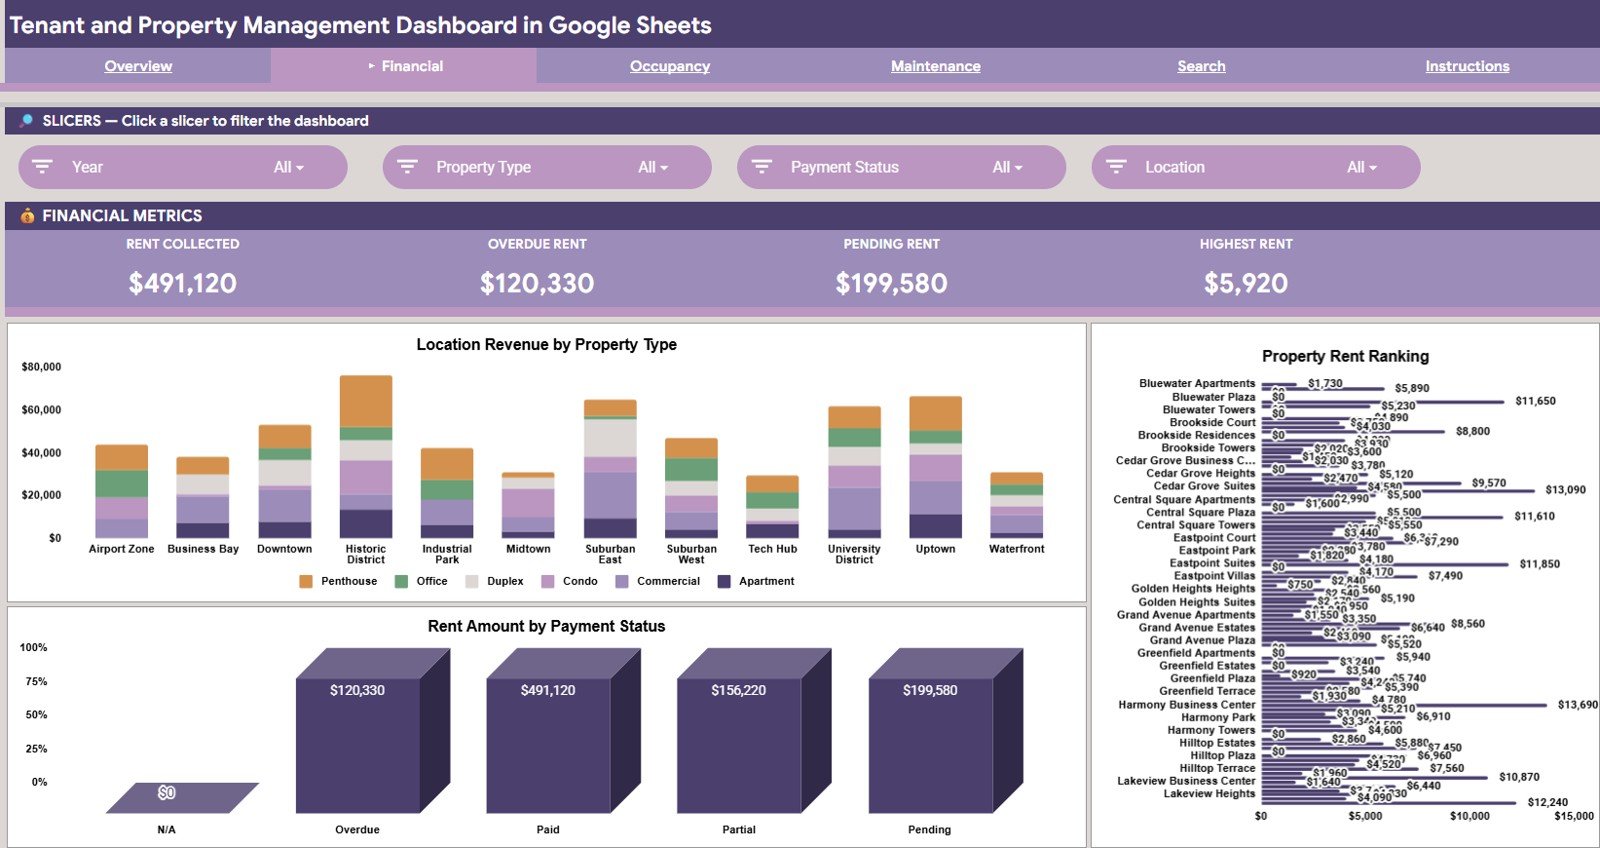
The money view. Location Revenue by Property Type crosses geography with asset class, Property Rent Ranking orders every property by rent contribution, and Rent Amount by Payment Status separates collected rent from pending and overdue amounts.
Page 3: Occupancy
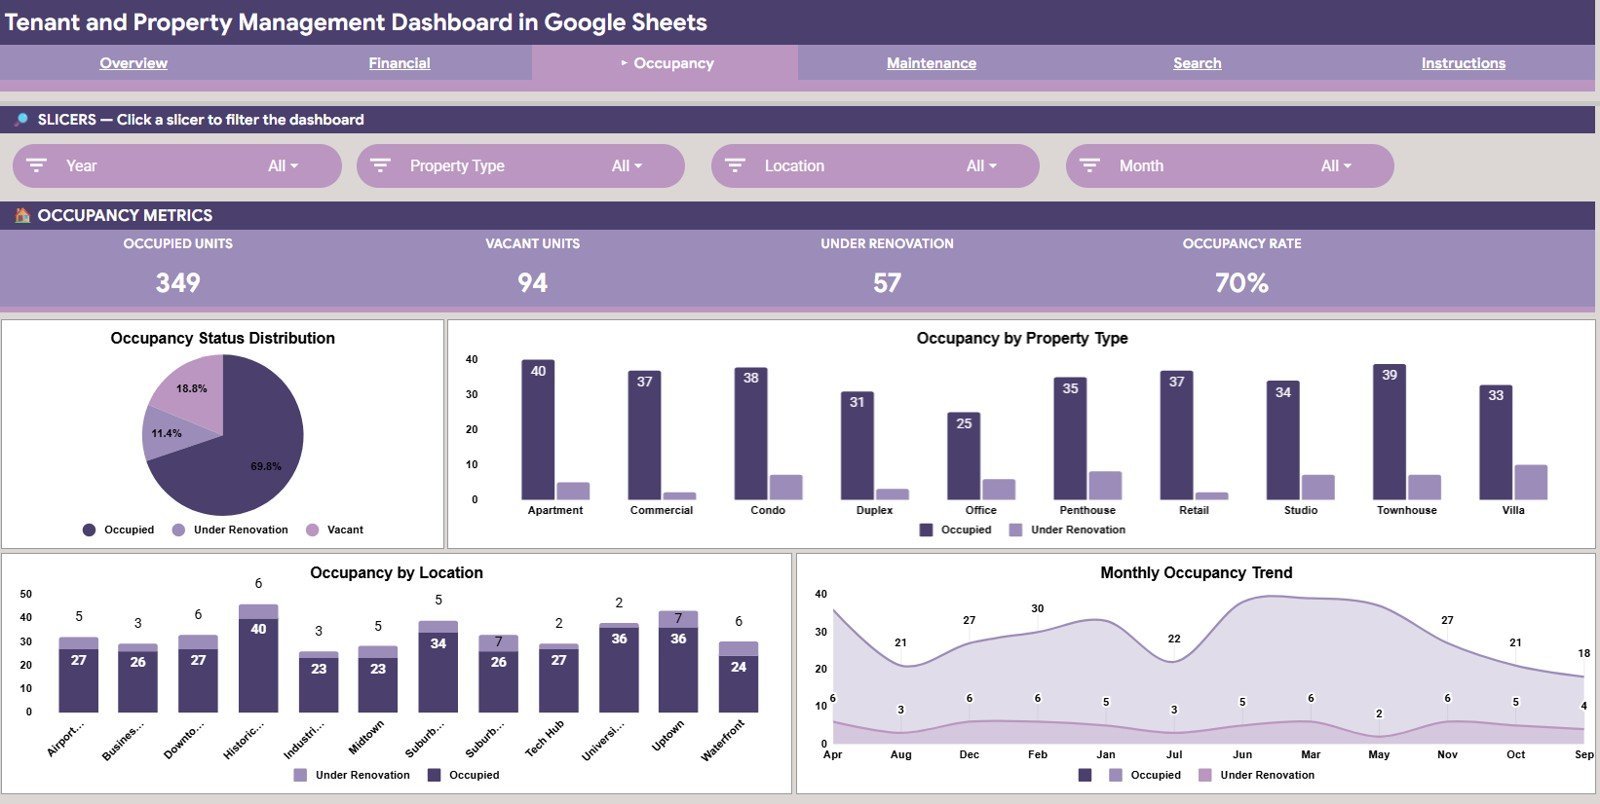
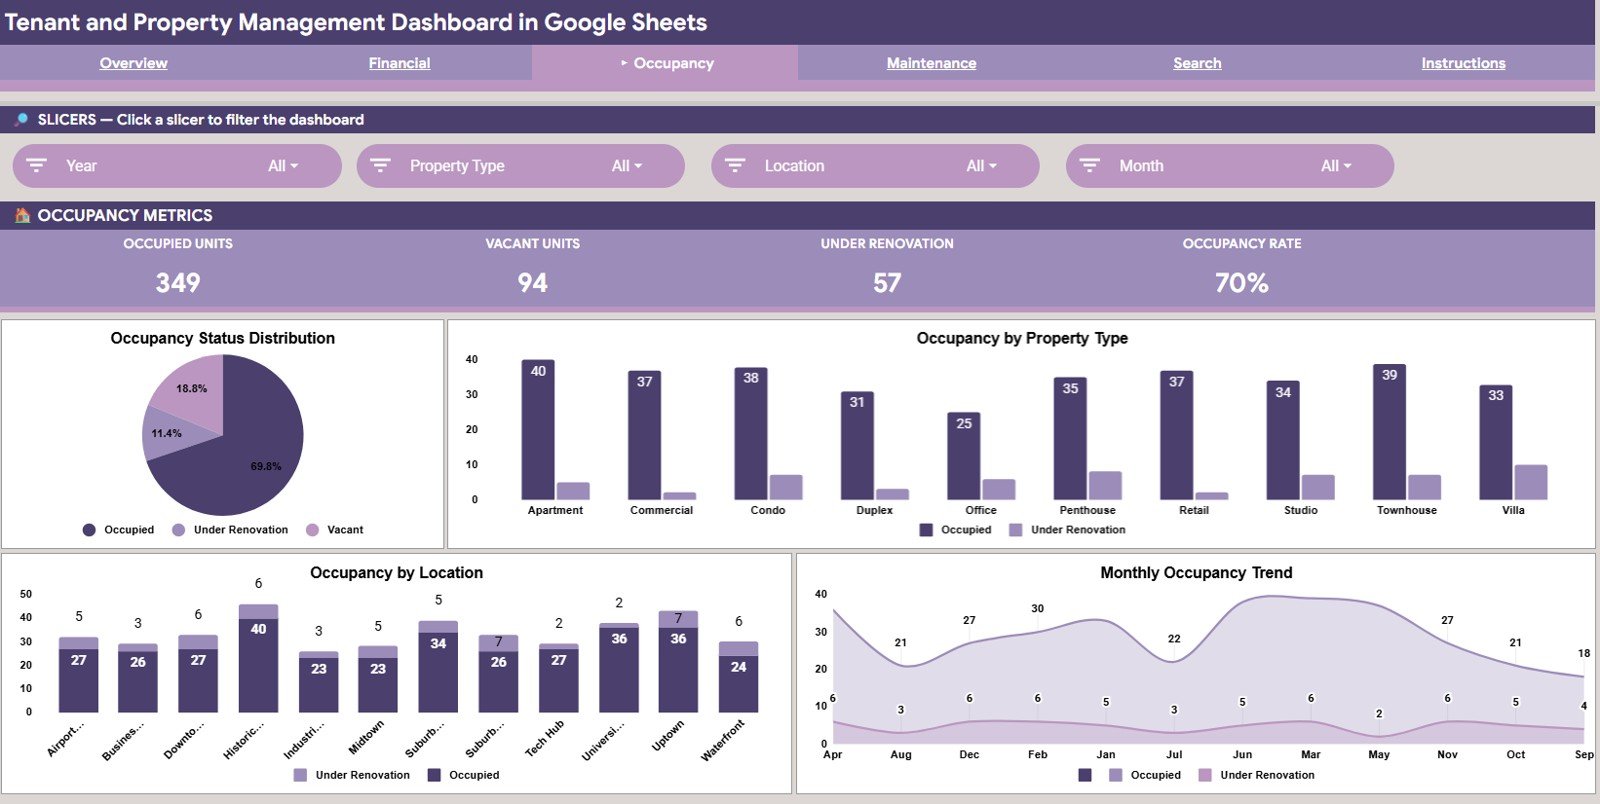
Shows how much of the portfolio is actually earning. Charts include Occupancy Status Distribution, Occupancy by Property Type, Occupancy by Location and Monthly Occupancy Trend — the last of which is where seasonal vacancy patterns become visible.
Page 4: Maintenance
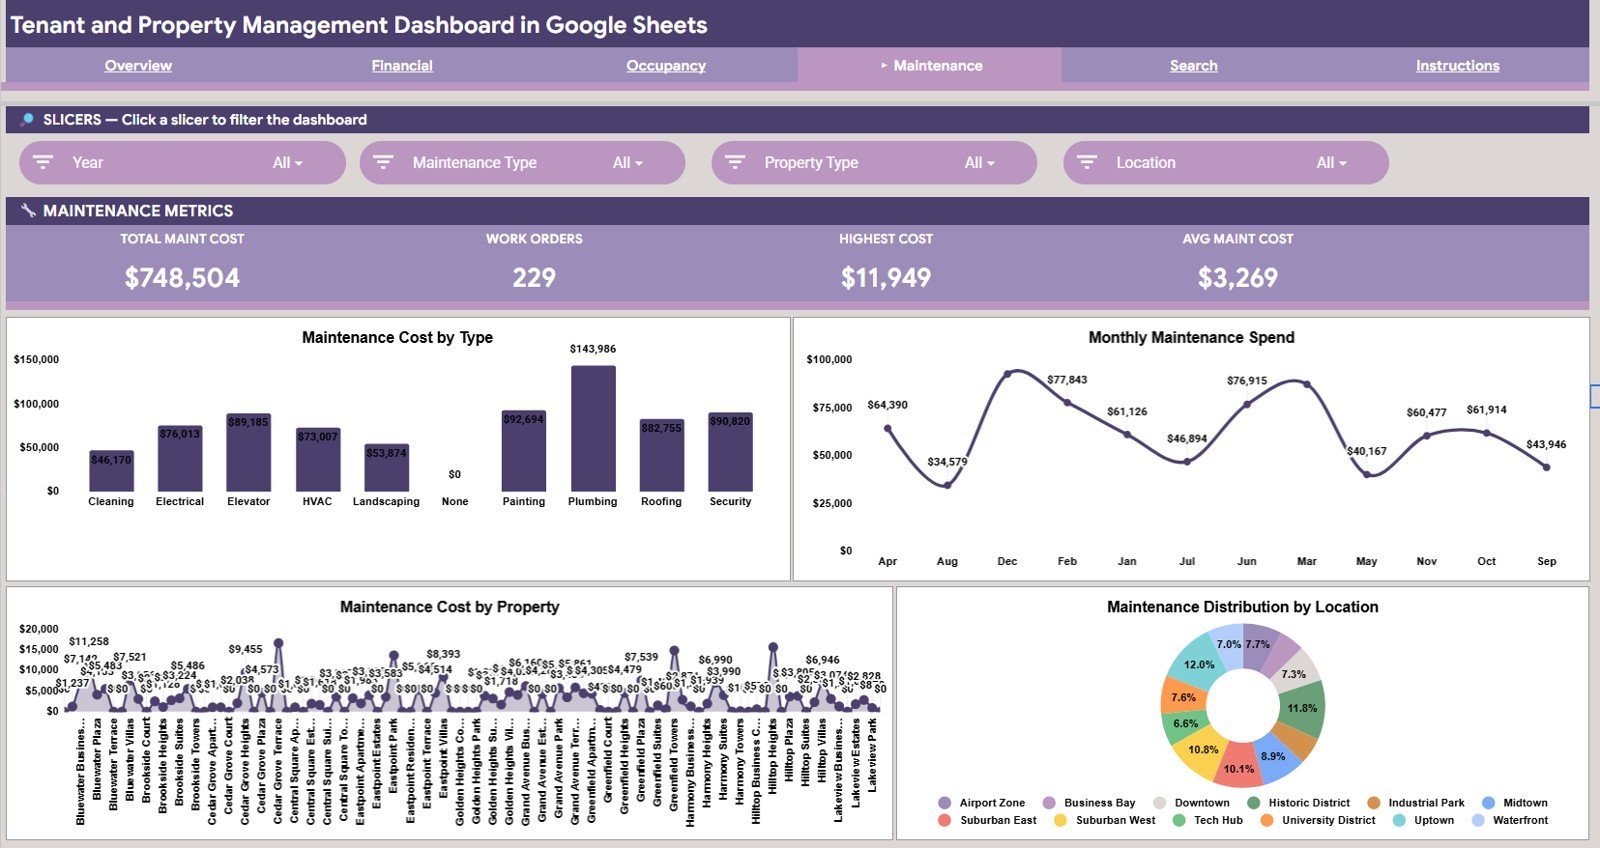
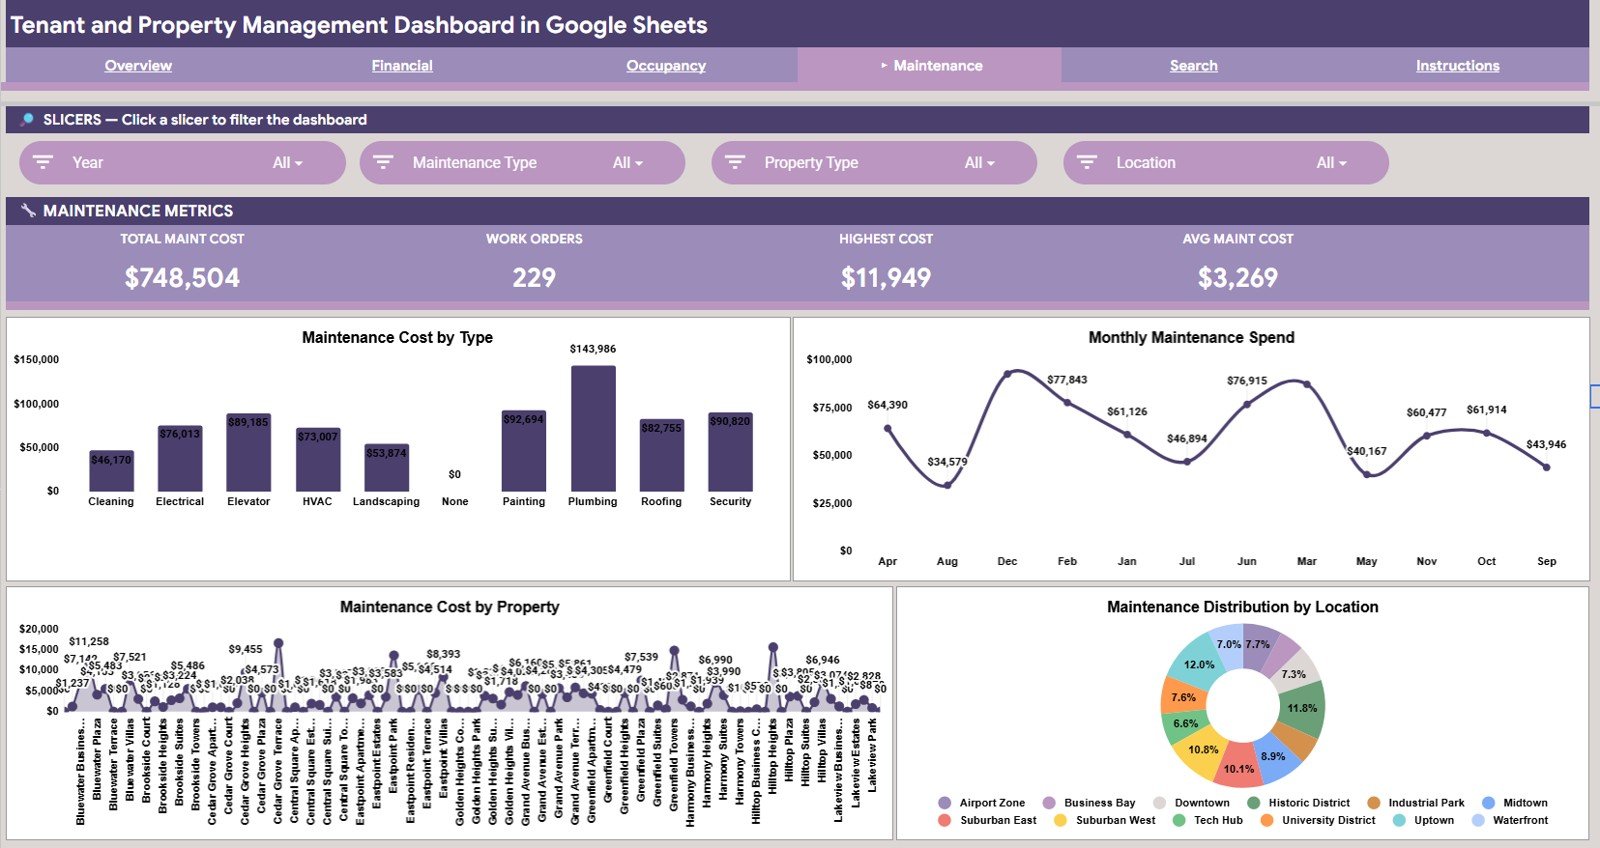
Tracks where the repair budget goes. Charts include Maintenance Cost by Type, Monthly Maintenance Spend, Maintenance Cost by Property and Maintenance Distribution by Location — together they surface the units that keep coming back for work.
Page 5: Search Sheet
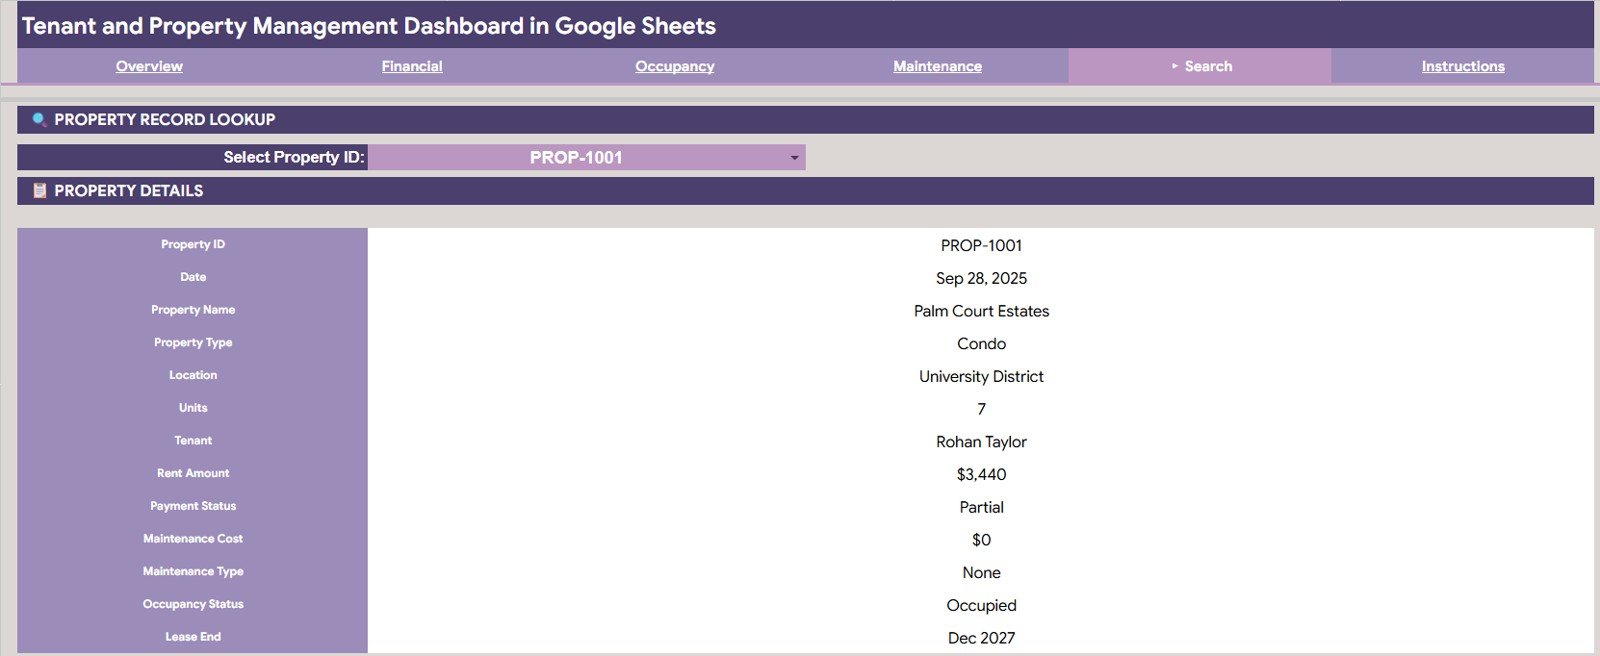
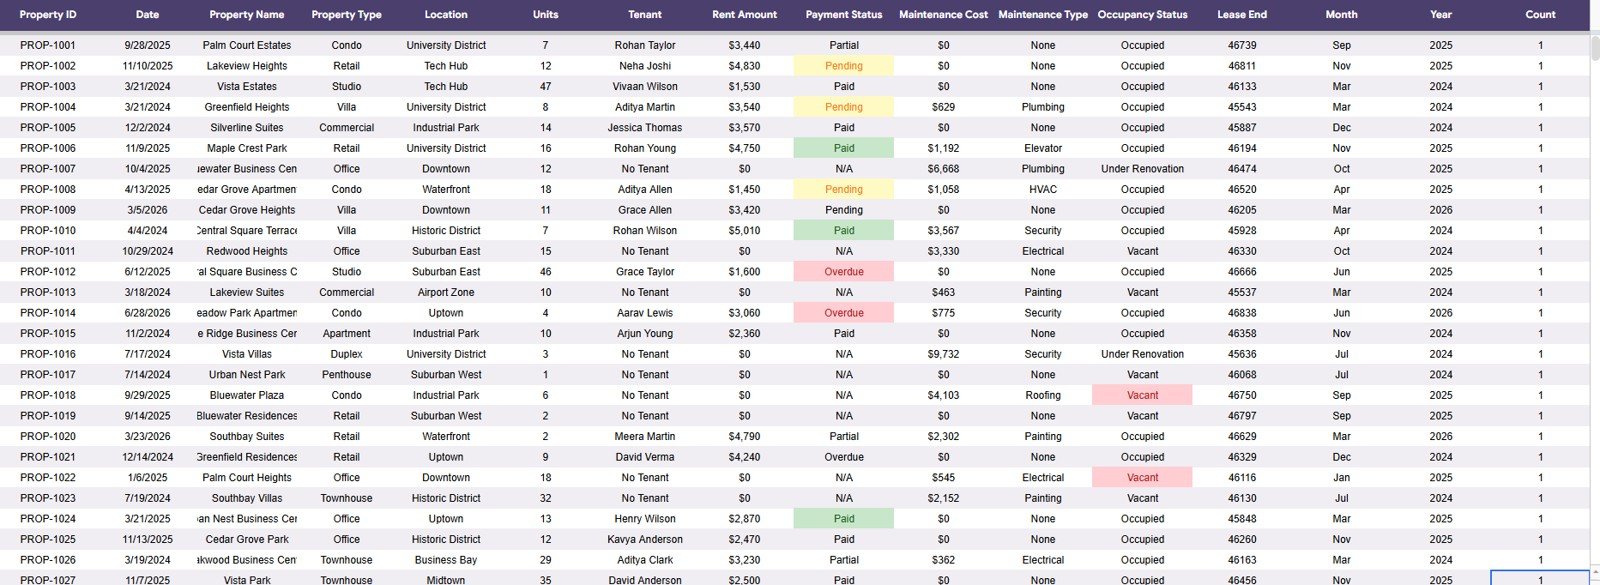
Select any Property ID from the dropdown and the sheet instantly returns that property’s complete record — property name, property type, location, units, tenant, rent amount, payment status, maintenance cost, maintenance type, occupancy status and lease end date.
Page 6: Data Sheet
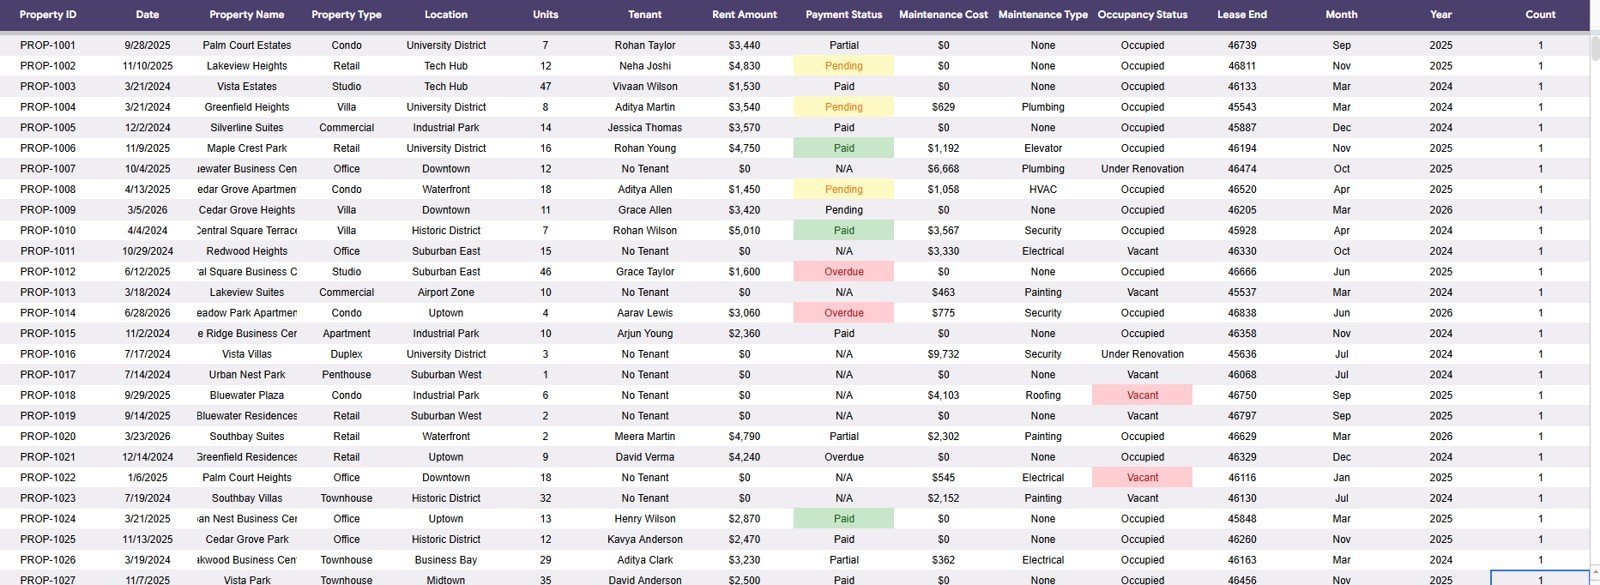
The single source feeding all four analysis pages and the Search sheet. Add your rows in the same format as the sample data and the whole dashboard updates automatically.
📊 Tenant and Property Management Dashboard in Google Sheets vs. Microsoft Excel Dashboard vs. Buildium / AppFolio — Where This Fits
| Feature | Tenant and Property Management Dashboard in Google Sheets | Microsoft Excel Dashboard | Buildium / AppFolio |
|---|---|---|---|
| Cost | $9.99 one-time ✅ | $10–$20 one-time, plus a Microsoft 365 licence | Monthly subscription, commonly $50–$300+ by unit count |
| Platform | Any browser — nothing to install ✅ | Desktop Excel for full fidelity | Vendor cloud platform |
| Setup time | Under 10 minutes ✅ | Under 15 minutes | Days to weeks, often with onboarding calls |
| Real-time team collaboration | Built in ✅ | Only via OneDrive co-authoring | Built in ✅ |
| Mobile access | Google Sheets mobile app ✅ | Limited on Excel mobile | Native mobile app ✅ |
| Customisable fields and charts | Fully editable, you own the file ✅ | Fully editable ✅ | Restricted to vendor field schema |
| Share with a link | Two clicks ✅ | Requires cloud upload first | Seat-based access only |
| Property ID instant lookup | Dedicated Search sheet ✅ | Usually needs manual formula work | Built in ✅ |
| Year-1 cost at 5 users | $9.99 total ✅ | $10–$20 plus licences | Typically $600–$3,600+ |
For landlords and small managers who want portfolio visibility without a per-unit monthly bill, the Tenant and Property Management Dashboard in Google Sheets sits in the sweet spot.
👥 Who This Template Is For — and Who It’s Not For
✅ This template is built for:
- Independent landlords managing roughly 5–100 rental units across one or several locations
- Small property management firms that need owner reporting without paying per unit every month
- Real estate investors comparing rent yield against maintenance drag across a mixed portfolio
- Co-owners and family offices who want a shareable, link-based view of portfolio performance
- Facility and estate teams already working inside Google Workspace
❌ This template is NOT for:
- Anyone needing automated rent collection, online tenant payments or bank reconciliation — this is a reporting layer, not a payments platform
- Teams that need tenant screening, e-signed leases or maintenance ticket workflows with vendor assignment
- Portfolios of thousands of units requiring role-based permissions and audit trails
- Organisations that prohibit Google Workspace for property data
⚙️ How to Use the Tenant and Property Management Dashboard in Google Sheets
- Open the PDF guide in your download and click the Google Sheets copy link to create your own editable copy in Google Drive.
- Open the Data sheet and replace the sample rows with your property records, keeping the same column order.
- Return to the Overview page and confirm the four KPI cards reflect your figures.
- Use the slicers to filter by location, property type, payment status or occupancy status.
- Review the Financial, Occupancy and Maintenance pages for deeper analysis of rent, vacancy and repair spend.
- Open the Search sheet and pick a Property ID to see that property’s full record, including lease end date.
💼 Real-World Use Cases
Ravi owns 22 rental units across two cities. He filters the Overview page by location each month and compares Total Rent Collected against Maintenance Spend. When one city’s maintenance line climbed three months running, he traced it through Maintenance Cost by Property to two ageing units and scheduled a proper renovation instead of paying for repeat call-outs.
Priya runs a five-person property management firm handling 60 units. Her team shares one copy with view-only links for owners. Before each owner call she filters the Financial page to that owner’s properties and screenshots the Property Rent Ranking and Rent Amount by Payment Status charts — replacing a monthly report she used to assemble by hand.
Daniel is an investor weighing a move into commercial units. He reads Occupancy by Property Type alongside Rent vs Maintenance by Property Type to check whether commercial units really return more net of upkeep than his residential ones.
❓ Frequently Asked Questions
What KPIs does the Tenant and Property Management Dashboard in Google Sheets track?
It tracks four headline KPIs — Total Rent Collected, Maintenance Spend, Total Records and Avg Rent (Occupied) — supported by 15 charts covering revenue by location, occupancy status, rent versus maintenance and monthly trends. All figures respond to the slicers on each page.
How long does setup take?
Setup takes under 10 minutes. Open the copy link from the included PDF guide, create your own copy in Google Drive, then paste your property records into the Data sheet using the same column order as the sample rows.
How does this compare to Buildium or AppFolio?
Buildium and AppFolio are full property management platforms with rent collection, tenant portals and maintenance ticketing, billed monthly. The Tenant and Property Management Dashboard in Google Sheets is a $9.99 one-time reporting layer — no transactions, no seat fees, and a file you own and can edit completely.
Can I add my own property types and locations?
Yes. Type any location, property type, payment status or occupancy status directly into the Data sheet and the charts and slicers pick up the new values automatically. Keep spelling consistent so categories do not split.
How many properties can the dashboard handle?
The Tenant and Property Management Dashboard in Google Sheets comfortably handles a few thousand property records. Beyond roughly ten thousand rows, Google Sheets recalculation slows noticeably and a database-backed tool becomes a better fit.
Does it work on mobile?
Yes. It runs entirely in Google Sheets, so it opens in the Google Sheets mobile app on Android and iOS. The KPI cards and Search sheet are the most practical pages on a small screen.
Can I share it with owners or accountants?
Yes. Share the file with a view-only link so they see the same live dashboard without editing formulas. There are no per-user charges, so adding an accountant or co-owner costs nothing extra.
👤 About the Author
Built by PK — Microsoft Certified Professional with 15+ years of Excel, Google Sheets, and Power BI experience. Founder of NextGenTemplates, reaching 300K+ subscribers across YouTube channels (@PK-AnExcelExpert, @NextGenTemplates, @NeoTechNavigators). Every template is hand-built and tested before release.
🔗 Explore Related Templates
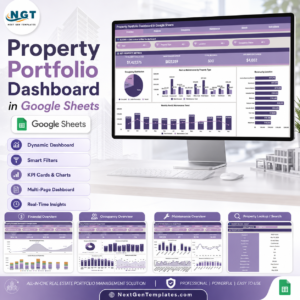
- Property Portfolio Dashboard in Google Sheets — portfolio-level value, yield and asset mix reporting.
- Real Estate Property Tracker in Google Sheets — a lighter single-page tracker for smaller portfolios.
- Rent Collection Data Entry System in Excel — a VBA form for capturing rent receipts at the point of collection.
- Property Enquiry Data Entry System in Excel — log and follow up inbound property enquiries.
Browse more Google Sheets Dashboards or compare against our Excel Dashboard Templates.
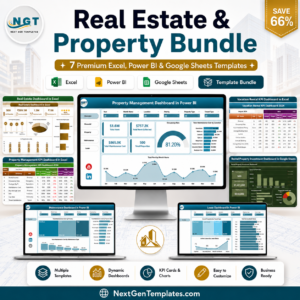
💎 Save 66% — get all 7 templates in the Real Estate & Property Bundle →
📖 Click here to read the Detailed Blog Post<
Watch the step-by-step video Demo:
🎥 Visit our YouTube channel for step-by-step video tutorials
👉 YouTube.com/@NextGenTemplates
📅 Last updated: July 2026