



The Influencer Marketing Campaign Performance Dashboard in Google Sheets turns one campaign table into 6 working tabs, 4 headline cards, and 14 visual analyses. Revenue, cost, conversions, engagements, reach, impressions, clicks, platform, niche, tier, and content type stay connected in one reporting view. Built by PK, whose template tutorials reach 300K+ YouTube subscribers, it gives agencies and in-house teams an editable alternative to a recurring marketing platform. Review all six screenshots before purchase, pay a one-time template price, and work in your own Google Drive copy.Influencer Campaign Performance Dashboard
Key Features of Influencer Marketing Campaign Performance Dashboard in Google Sheets
- Four executive cards: Revenue, Cost, Conversions, and Engagements.
- Fourteen charts: compare month, tier, niche, platform, content, and campaign type.
- Multiple slicers: narrow the overview to a relevant campaign segment.
- Platform and influencer views: separate channel delivery from creator performance.
- Financial analysis: place revenue beside cost across core dimensions.
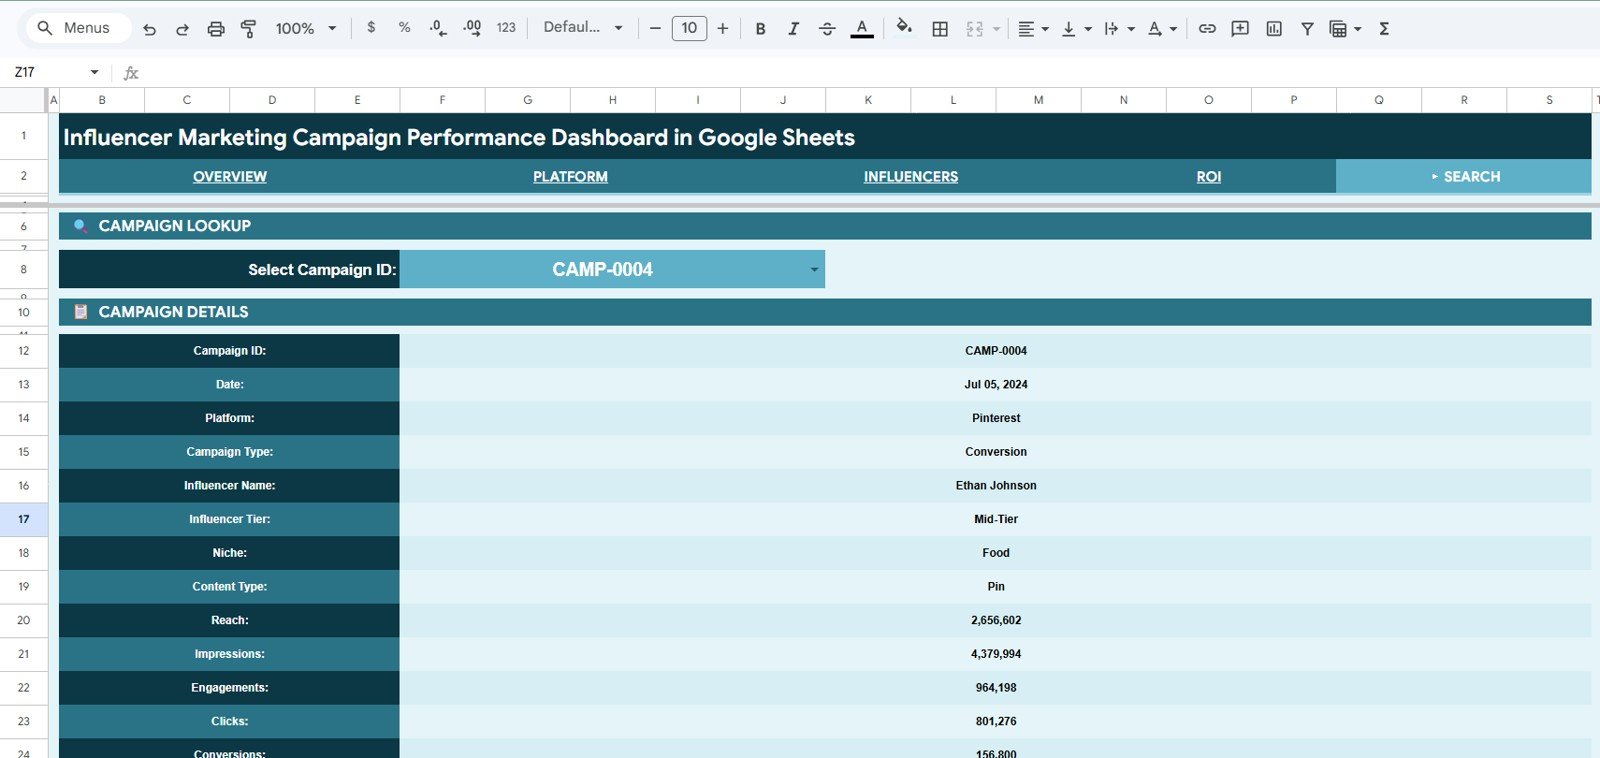
- Campaign search: choose an ID and retrieve its complete record.
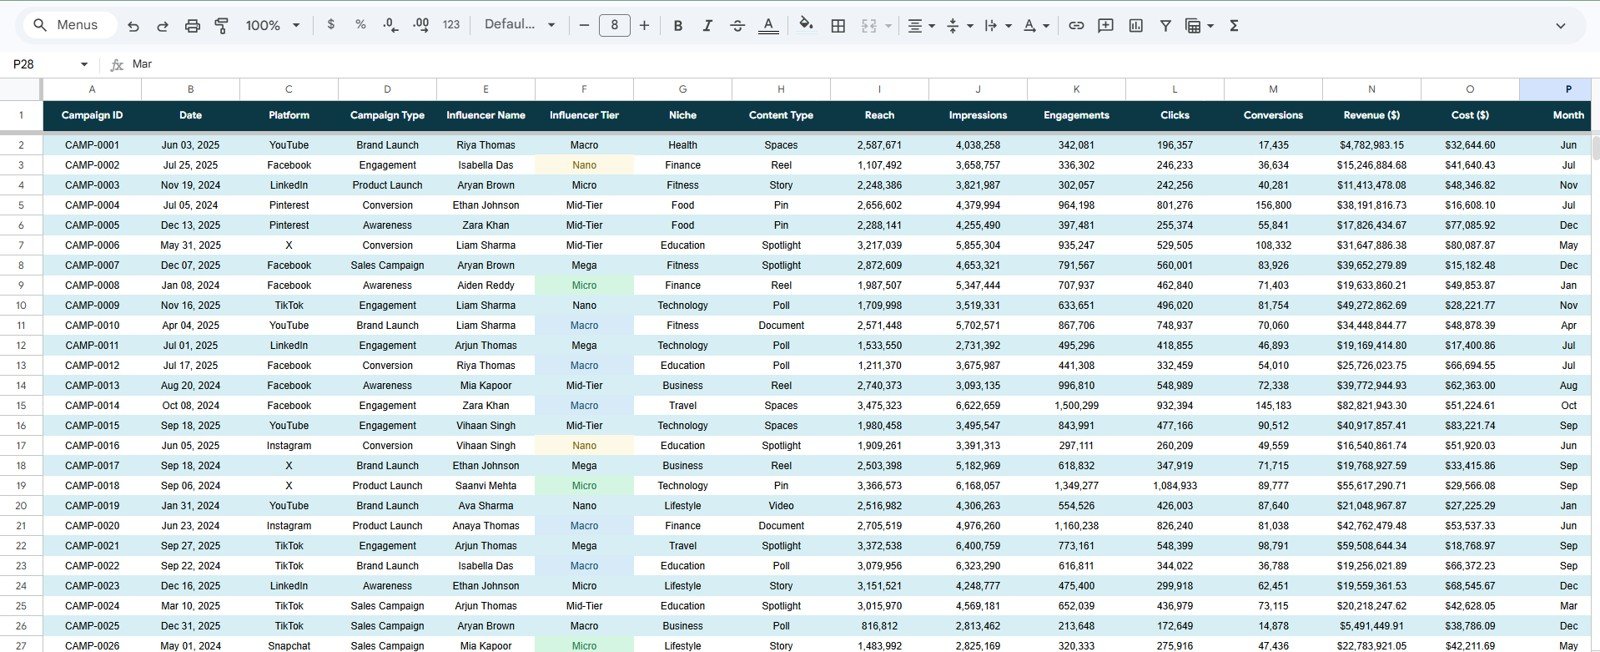
- Structured data sheet: replace sample rows in the supplied format.
What’s Inside the Influencer Marketing Campaign Performance Dashboard in Google Sheets
1. Overview Page
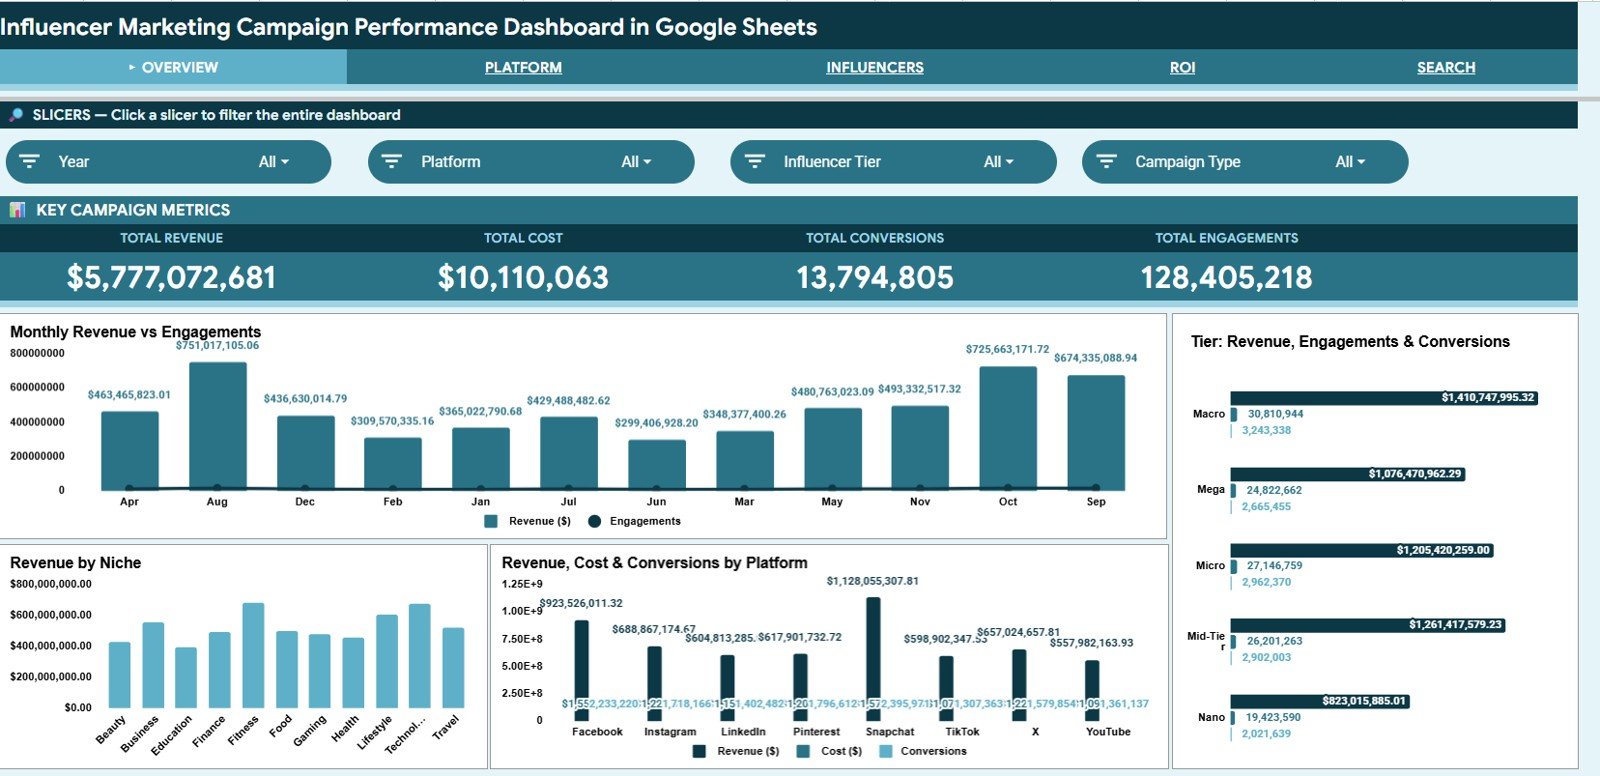
The Overview page combines the four headline cards with slicers and four charts. Revenue and Engagements by Month reveals whether commercial value and audience response move together over time.Influencer Campaign Performance Dashboard
Revenue, Engagements and Conversions by Tier compares creator tiers on both awareness and outcome measures. Revenue by Niche identifies subject areas contributing the most sales, while Revenue, Cost and Conversions by Platform places spend, return, and response in one channel comparison.
2. Platform Performance
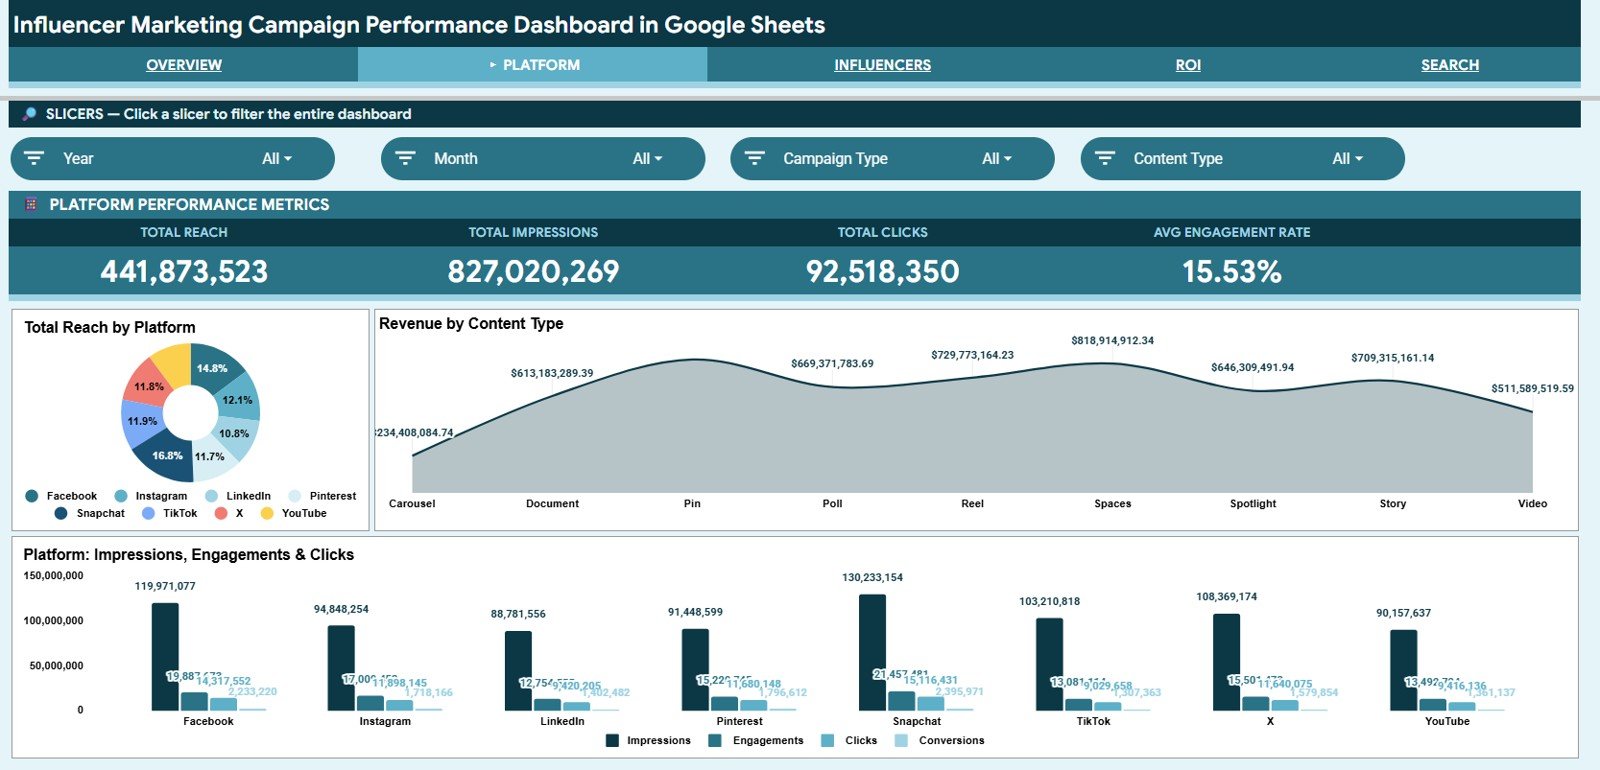
Total Reach by Platform compares potential audience scale by channel. Revenue by Content Type shows which delivery formats contribute the most commercial value.Influencer Campaign Performance Dashboard
Impressions, Engagements and Clicks by Platform follows the audience journey from exposure to interaction and traffic. Use it to spot channels with high visibility but weaker downstream action.Influencer Campaign Performance Dashboard
3. Influencer Performance
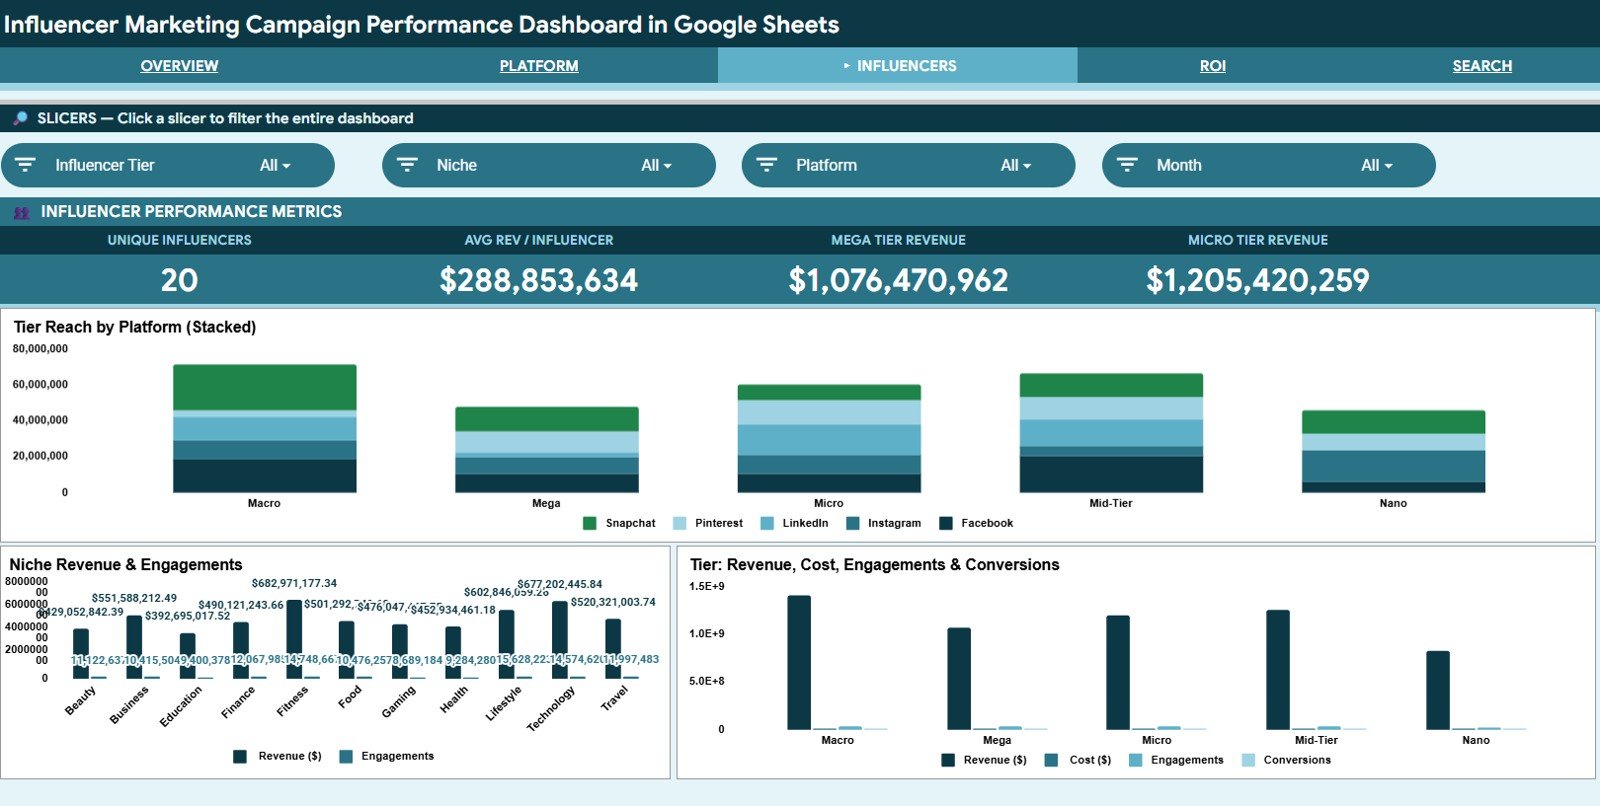
Reach by Tier and Platform highlights where creator size and channel choice produce the widest distribution. Revenue and Engagements by Niche compares audience interest with monetary contribution across content categories.
Revenue, Cost, Engagements and Conversions by Tier helps distinguish tiers that create visibility from tiers that produce measurable business outcomes. It also supports more informed creator-mix planning.
4. ROI and Financial Analysis
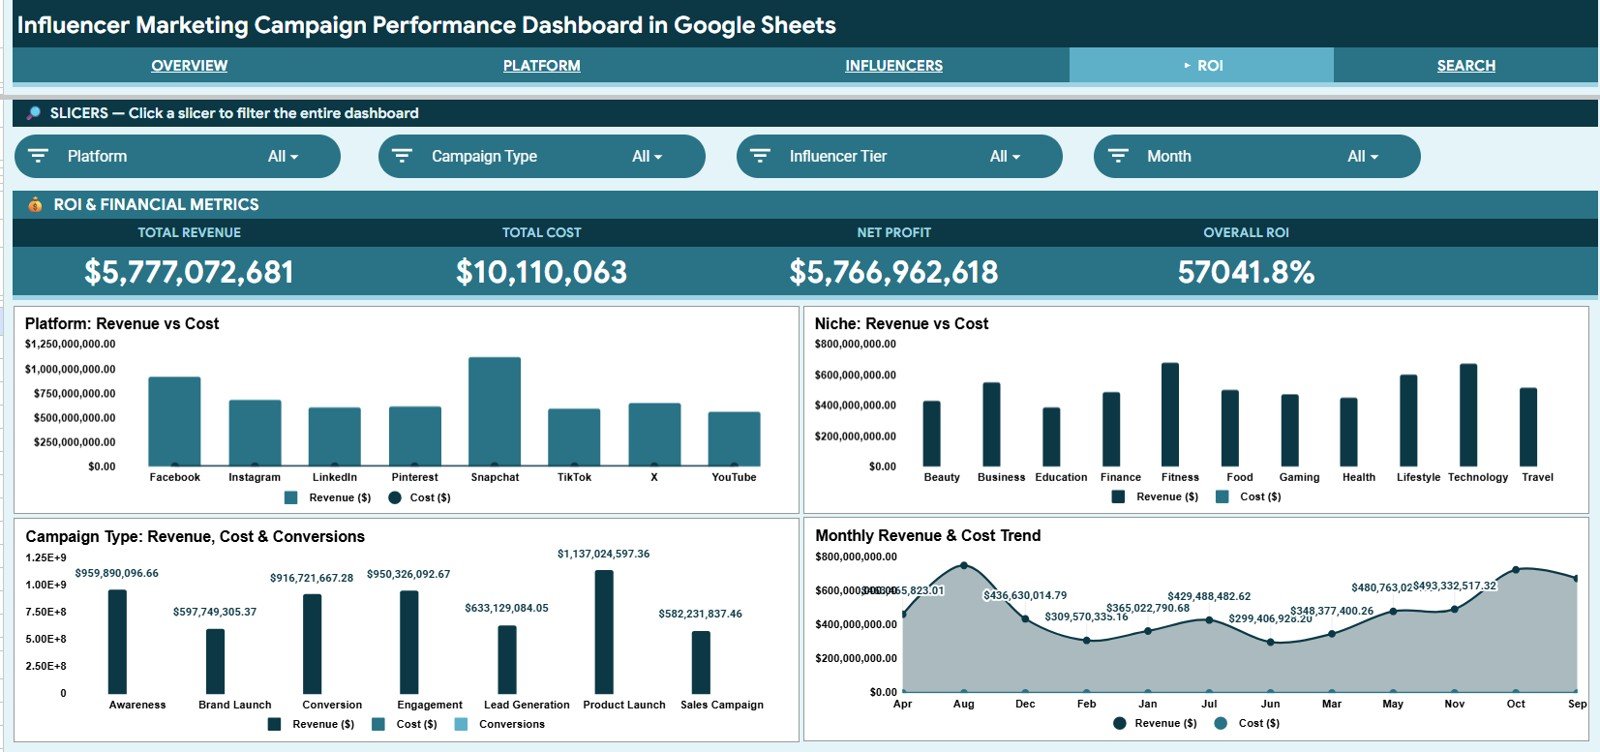
Revenue and Cost by Platform and Revenue and Cost by Niche expose areas where spend and return are out of balance. Revenue, Cost and Conversions by Campaign Type compares financial input with recorded outcomes by activation approach.
Revenue and Cost by Month makes budget movement visible over time. Review it for expensive periods, profitable months, and timing patterns worth investigating.
5. Search Sheet
Select one Campaign ID from the dropdown to display its date, platform, campaign type, influencer, tier, niche, content type, reach, impressions, engagements, clicks, and conversions. This is useful when a client or manager asks for the details behind a specific activation.
6. Data Sheet Tab
Add or replace campaign rows here while preserving the supplied column structure. Consistent platform, tier, niche, content type, and campaign type labels help the slicers and charts group records correctly.
Influencer Marketing Campaign Performance Dashboard in Google Sheets vs. Microsoft Excel Dashboard vs. Paid Marketing SaaS – Where This Fits
| Feature | This Google Sheets Template | Microsoft Excel Dashboard | Paid Marketing SaaS |
|---|---|---|---|
| Cost | $9.99 sale price | Template cost plus Excel licensing where needed | Recurring, plan-dependent |
| Platform | Browser-based Google Sheets | Desktop or web Excel | Vendor-hosted application |
| Setup time | Copy the file and replace sample rows | Open the workbook and replace data | Account configuration and integrations vary |
| Real-time collaboration | Native file sharing and simultaneous editing | Available with cloud storage and compatible accounts | Usually included by plan |
| Mobile access | Google Sheets app or browser | Excel app or browser | Vendor app or browser |
| Customizable fields | Editable sheet structure | Editable workbook structure | Limited by configuration and plan |
| Share with link | Yes, with owner-controlled permissions | Yes, with supported cloud sharing | Usually user-account based |
| Year-1 cost at 5 users | $9.99 template price | Depends on existing licenses | Depends on vendor and plan |
| Campaign-ID lookup | Included | Possible with workbook formulas | Varies by platform |
Who This Template Is For – and Who It’s Not For
Best for: influencer agencies, brand teams, freelance campaign managers, creator partnerships teams, and small businesses using manual records or exports.
Not the right fit for: teams needing API imports, contracting, payments, social listening, attribution modeling, or enterprise access controls. It analyzes entered data; it is not a connected influencer-management platform.
How to Use the Influencer Marketing Campaign Performance Dashboard in Google Sheets
- Use the PDF guide’s copy link.
- Create an editable copy in Google Drive.
- Review the sample Data sheet and keep its column order.
- Replace sample records and standardize labels.
- Use slicers to isolate a segment.
- Select a Campaign ID when you need one record.
Real-World Use Cases
Maya, an agency account manager, filters by platform and tier before a client review, then searches one requested campaign.
Arjun, an in-house marketer, compares revenue and cost by niche before testing the next budget.
Leena, a creator manager, uses monthly revenue and engagement trends for her performance recap.
Frequently Asked Questions
What campaign metrics does the dashboard track?
It covers revenue, cost, conversions, engagements, reach, impressions, and clicks across the supplied dimensions.
Do I need Microsoft Excel?
No. This version is built for Google Sheets and is used through a Google account.
Can several team members use the dashboard?
Yes. The owner controls viewer, commenter, or editor access.
Does the template import data automatically?
No. Add records to the Data sheet; API integrations are not included.
Can I find one campaign without filtering every chart?
Yes. Select its Campaign ID on the Search sheet to retrieve the available campaign fields.
Can I customize the dashboard?
Google Sheets files are editable, but preserve formulas, chart ranges, and column structure unless you are comfortable updating them.
About the Author
Built by PK – Microsoft Certified Professional with 15+ years of Excel, Google Sheets, and Power BI experience. Founder of NextGenTemplates, reaching 300K+ subscribers across YouTube channels. Every template is hand-built and tested before release.
Explore Related Templates
- Social Media Influencer Tracking Dashboard in Google Sheets
- Influencer ROI KPI Dashboard in Google Sheets
- Influencer Marketing Dashboard in Excel
- Influencer Marketing Dashboard in Power BI
- Browse more Google Sheets templates and Google Sheets dashboards.
Ready to replace scattered campaign recaps? Add the Influencer Marketing Campaign Performance Dashboard in Google Sheets to your toolkit and turn a consistent campaign table into repeatable reporting.
Watch the step-by-step video Demo:
Last updated: July 15, 2026.
Compatibility and Requirements
- Works in Google Sheets. You need a free Google account and a web browser.
- You pick a Campaign ID from a dropdown on the Search Sheet. Google explains dropdowns in Create an in-cell dropdown list.































Reviews
There are no reviews yet.