

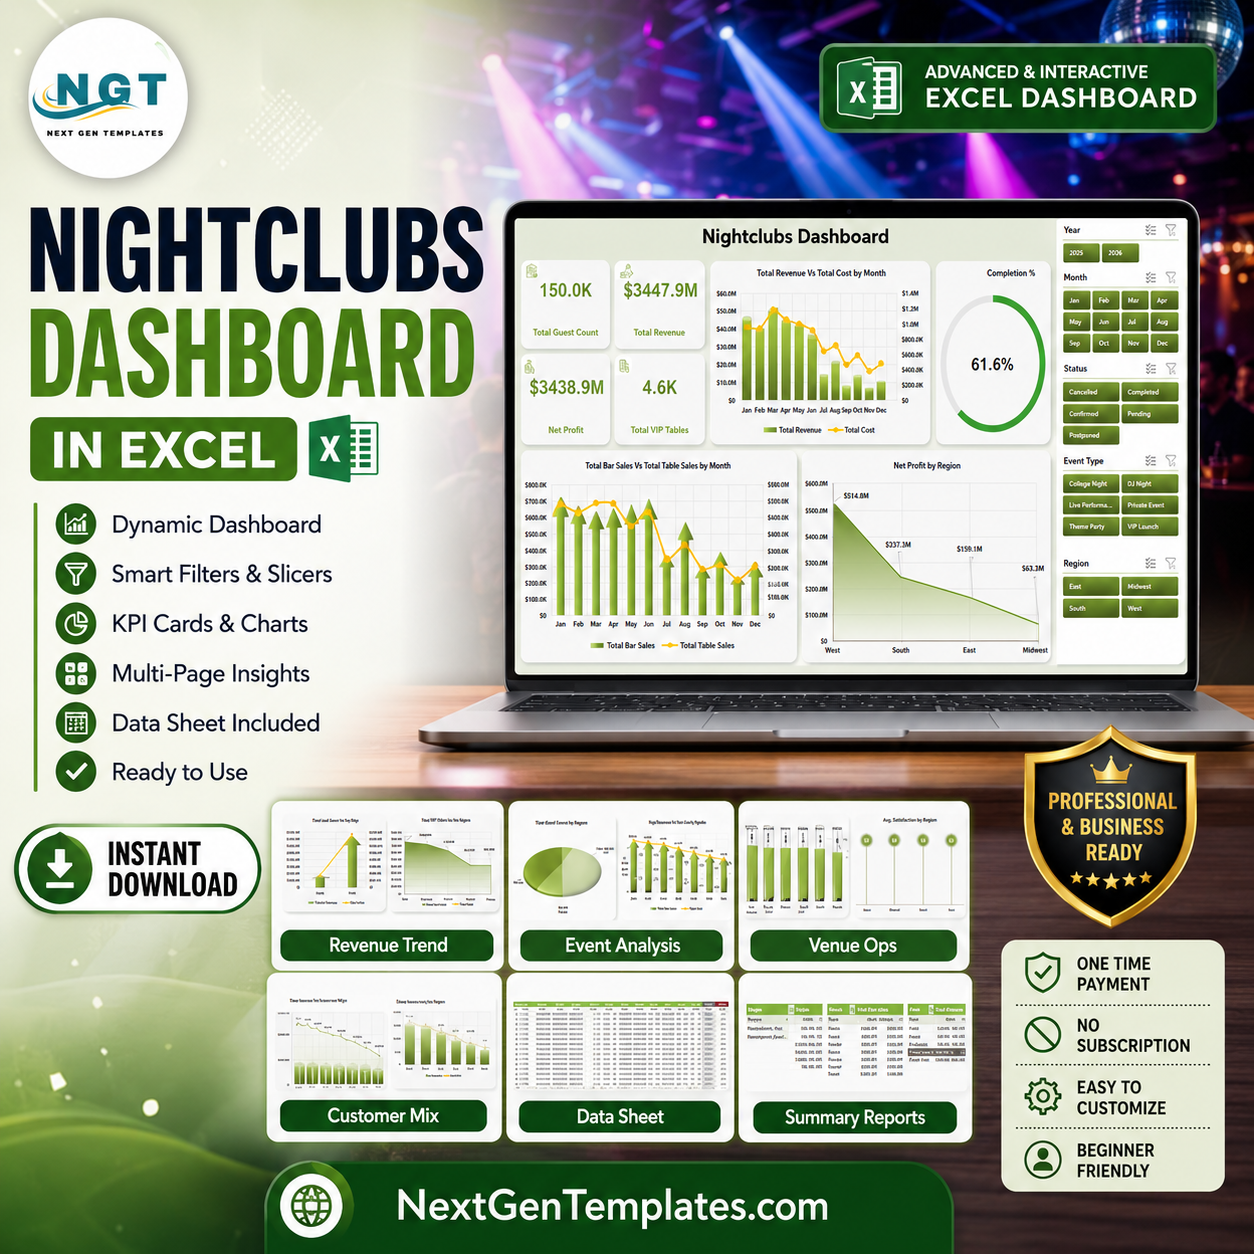



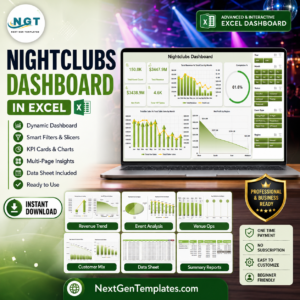
Nightclubs Dashboard in Excel is a ready-to-use reporting workbook for nightclub owners, venue operators, promoters, event managers, and hospitality analysts who need fast visibility into guest count, revenue, cost, net profit, VIP tables, bar sales, table sales, incidents, satisfaction, music genres, and customer mix. The template includes 5 interactive dashboard pages, 4 high-level KPI cards, 20 analytical charts, a structured Data Sheet, and a Support Sheet with pivot tables. Instead of reviewing event exports, sales files, and promoter reports separately, this Excel dashboard gives you one clean place to measure nightclub performance.
The workbook is built for Microsoft Excel users who want a one-time downloadable template without committing to expensive club management software. Replace the sample data, click Refresh All, and use slicers to review performance by month, region, city, club name, event type, promoter, music genre, status, and customer segment.
Key Features of Nightclubs Dashboard in Excel
- 5 interactive dashboard pages: Overview, Revenue Trend, Event Analysis, Venue Ops, and Customer Mix.
- 4 top KPI cards: Total Guest Count, Total Revenue, Net Profit, and Total VIP Tables.
- 20 chart views: Analyze revenue, cost, profit, bar sales, table sales, attendance, incidents, satisfaction, and guest mix.
- Excel slicers: Filter dashboard pages quickly without changing formulas or rebuilding charts.
- Pivot-powered structure: Refresh all pivots after updating the Data Sheet and every chart updates together.
- No VBA required: Built with Excel tables, pivot tables, slicers, formulas, and charts.
- Editable workbook: Change labels, add fields, adjust charts, or expand the source table for local reporting needs.
What’s Inside the Nightclubs Dashboard in Excel
Overview Page
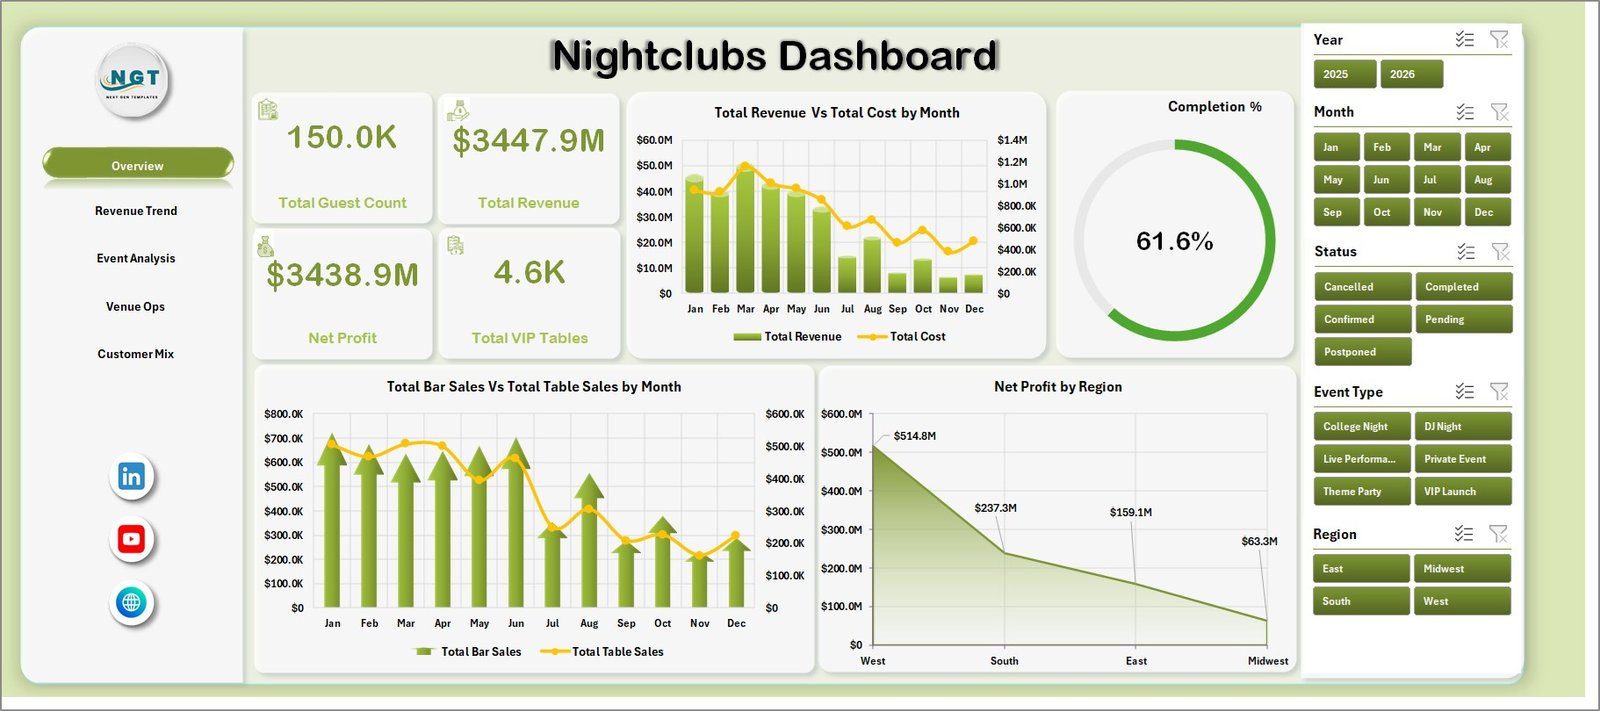
The Overview page shows the main performance snapshot with KPI cards for Total Guest Count, Total Revenue, Net Profit, and Total VIP Tables. It includes charts for Total Revenue Vs Total Cost by Month, Completion % by Status, Total Bar Sales Vs Total Table Sales by Month, and Net Profit by Region.
Nightclubs Dashboard in Excel
Revenue Trend
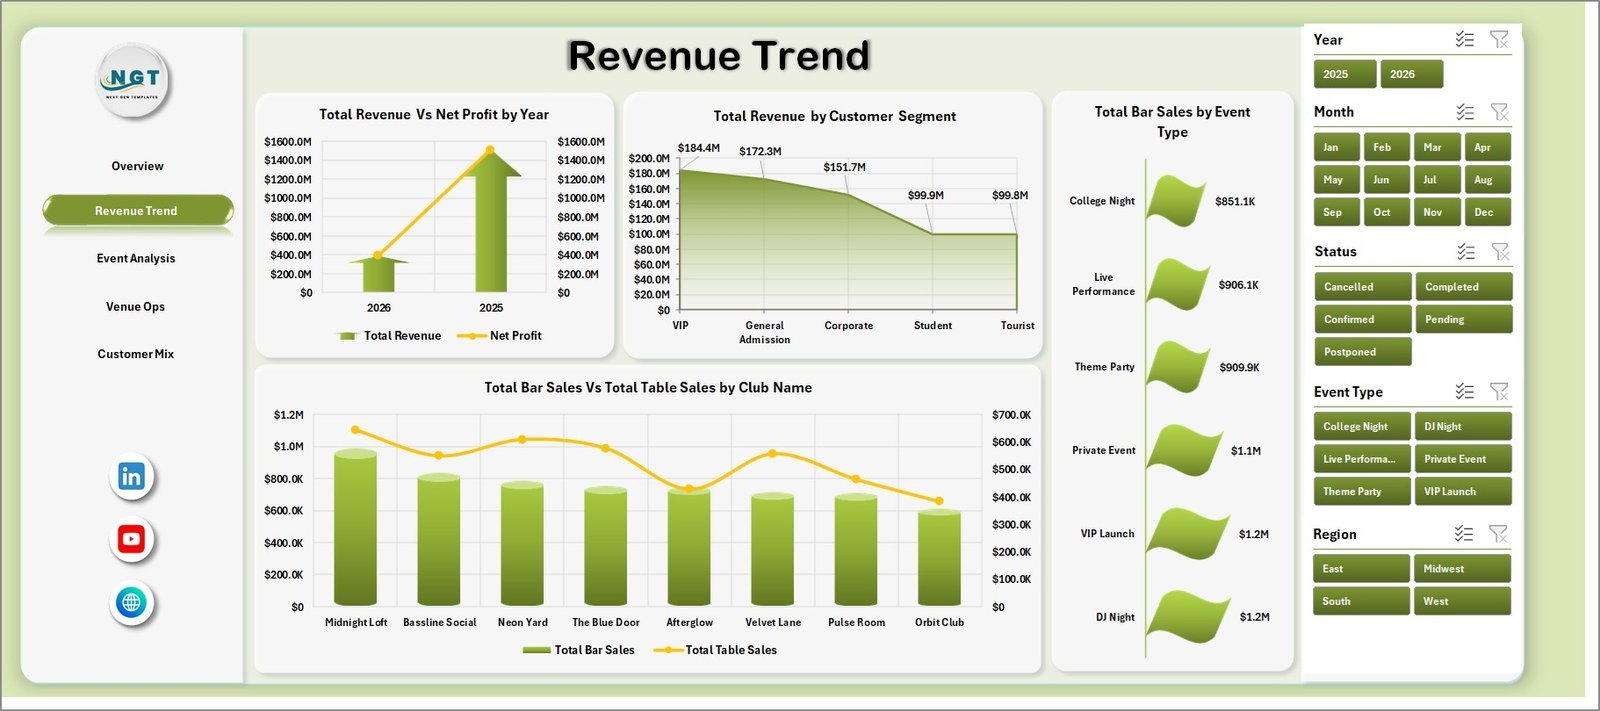
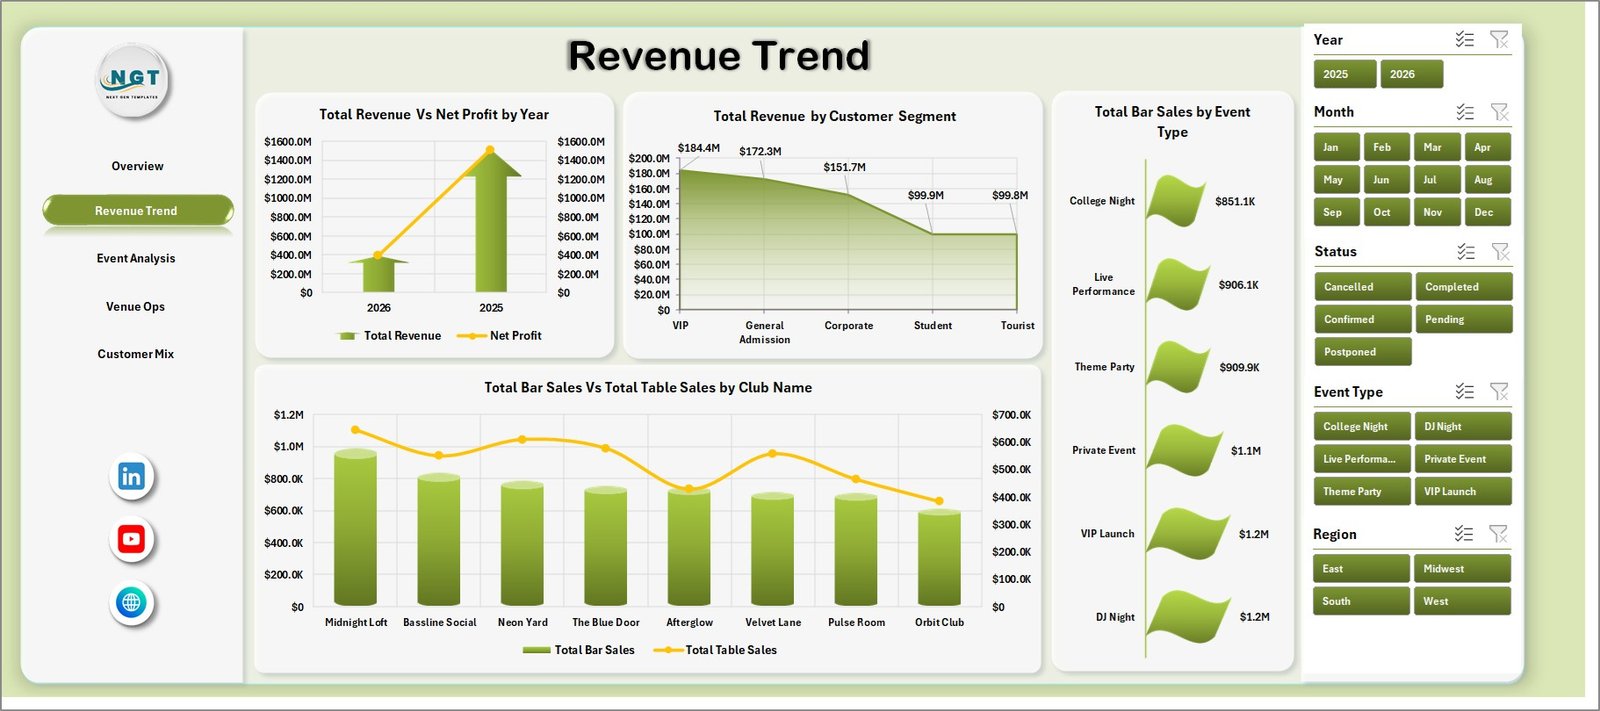
This sheet focuses on yearly and segment-level revenue analysis. It includes Total Revenue Vs Net Profit by Year, Total Revenue by Customer Segment, Total Bar Sales by Event Type, and Total Bar Sales Vs Total Table Sales by Club Name.
Revenue Trend
Event Analysis
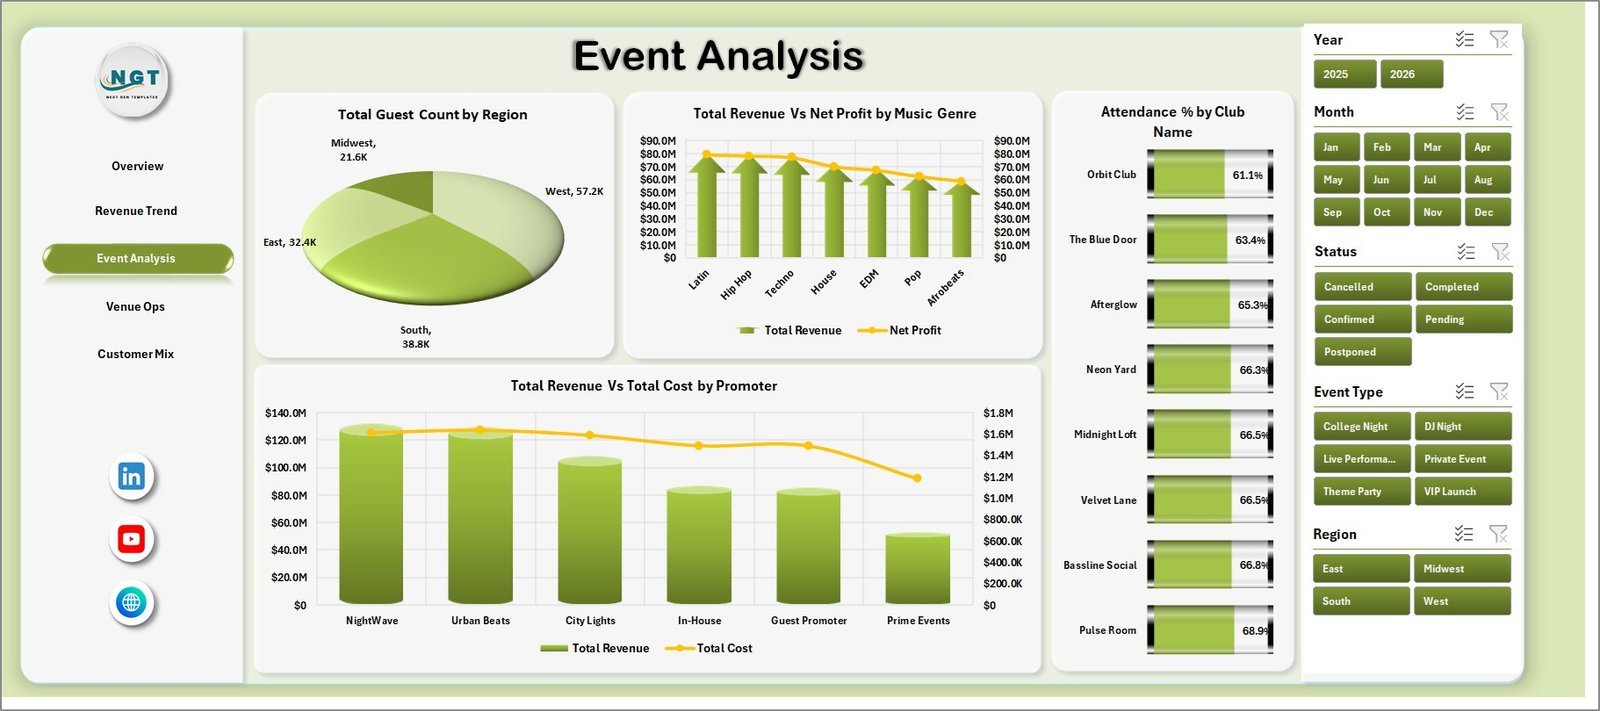
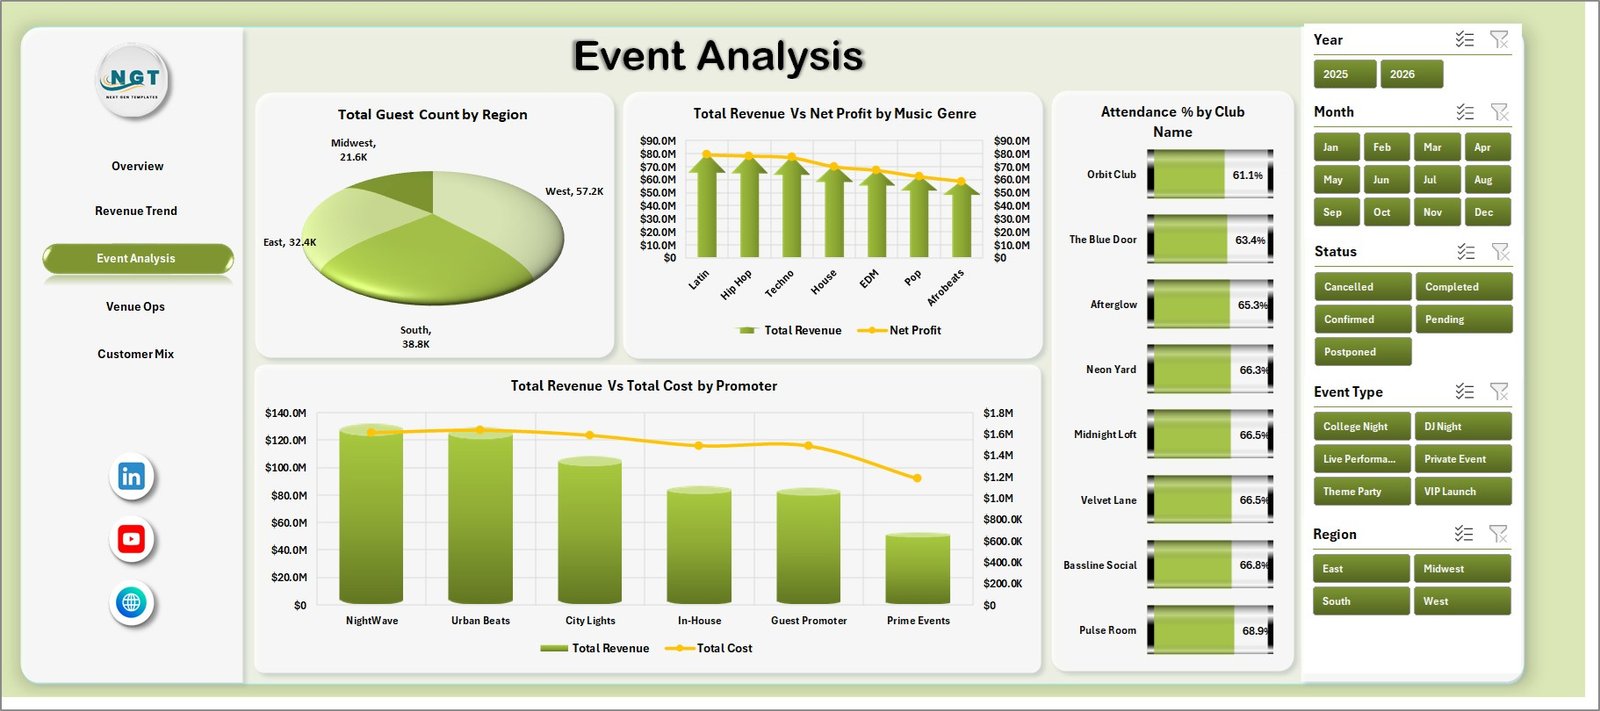
The Event Analysis sheet helps review event performance by location, music genre, club attendance, and promoter. It includes Total Guest Count by Region, Total Revenue Vs Net Profit by Music Genre, Attendance % by Club Name, and Total Revenue Vs Total Cost by Promoter.
Event Analysis
Venue Ops
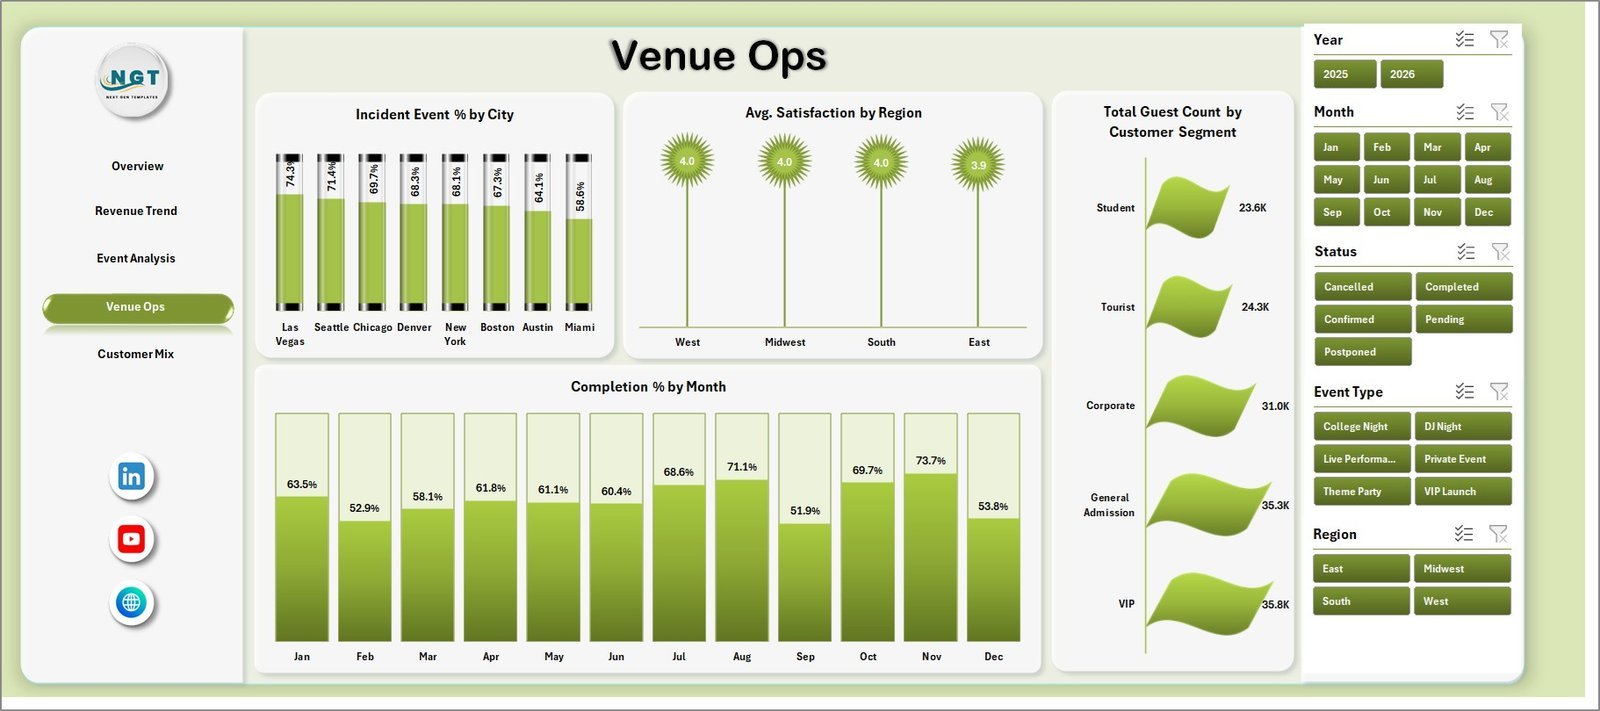
The Venue Ops sheet is designed for operational review. It tracks Incident Event % by City, Avg. Satisfaction by Region, Total Guest Count by Customer Segment, and Completion % by Month.
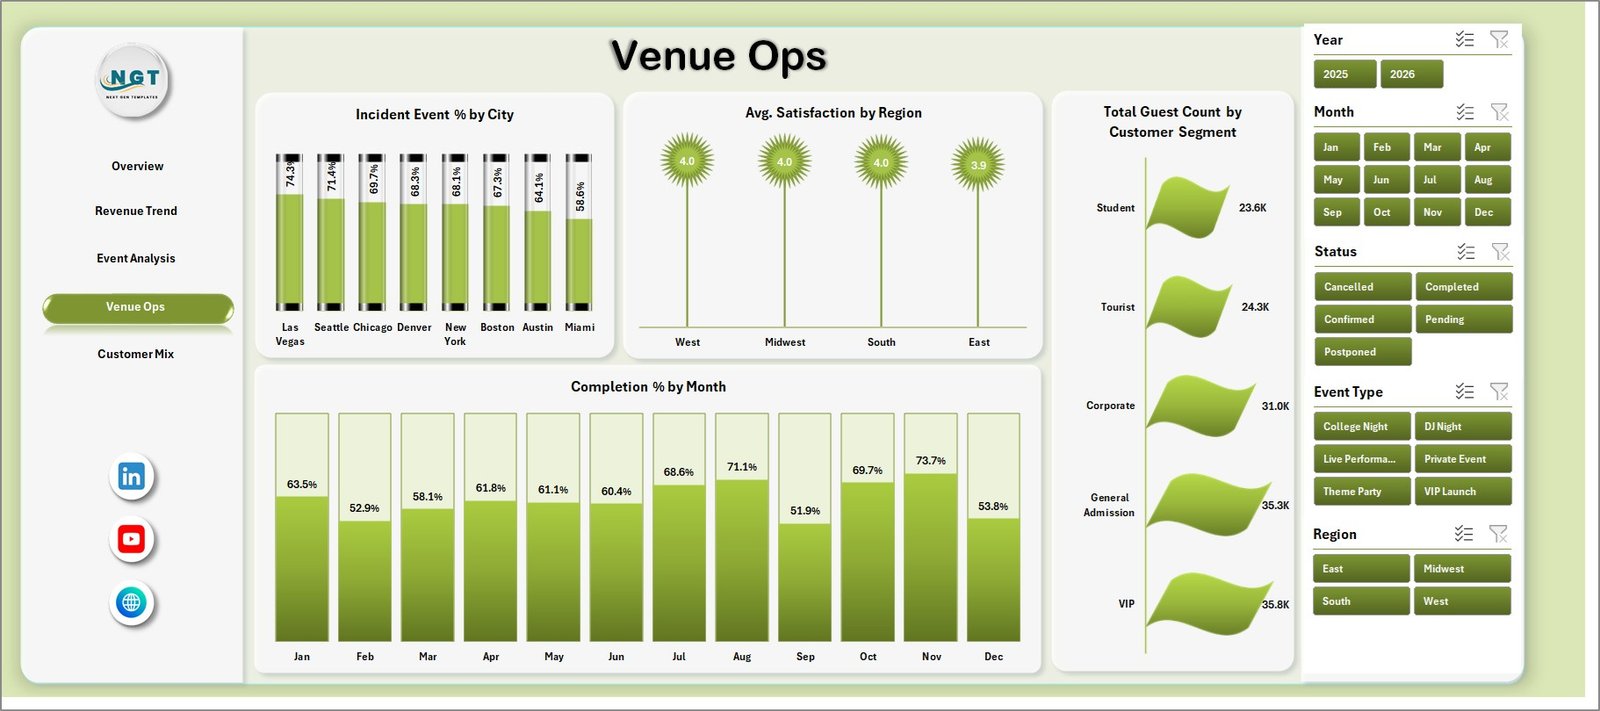
Venue Ops
Customer Mix
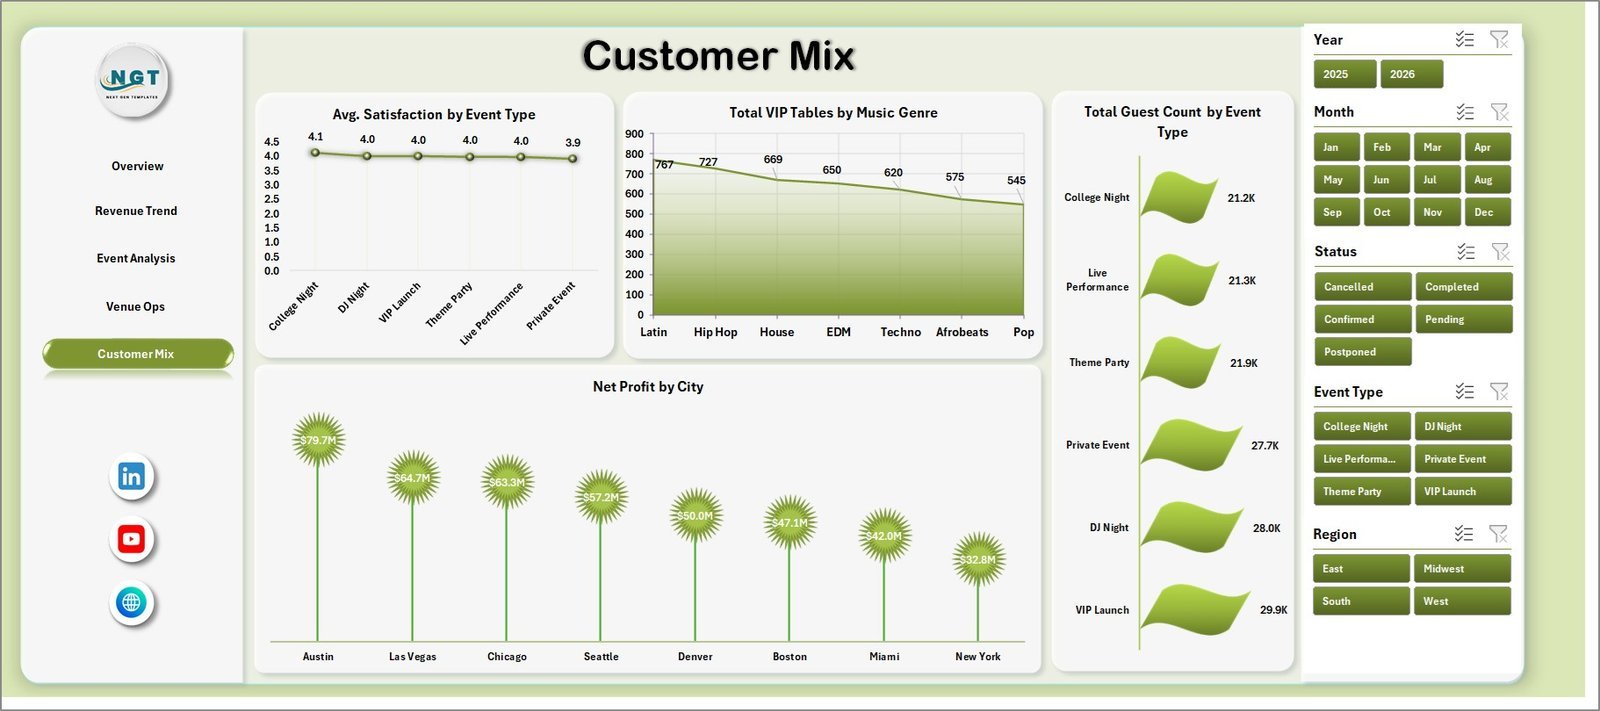
The Customer Mix sheet explains guest behavior and profitability by segment. It includes Avg. Satisfaction by Event Type, Total VIP Tables by Music Genre, Total Guest Count by Event Type, and Net Profit by City.
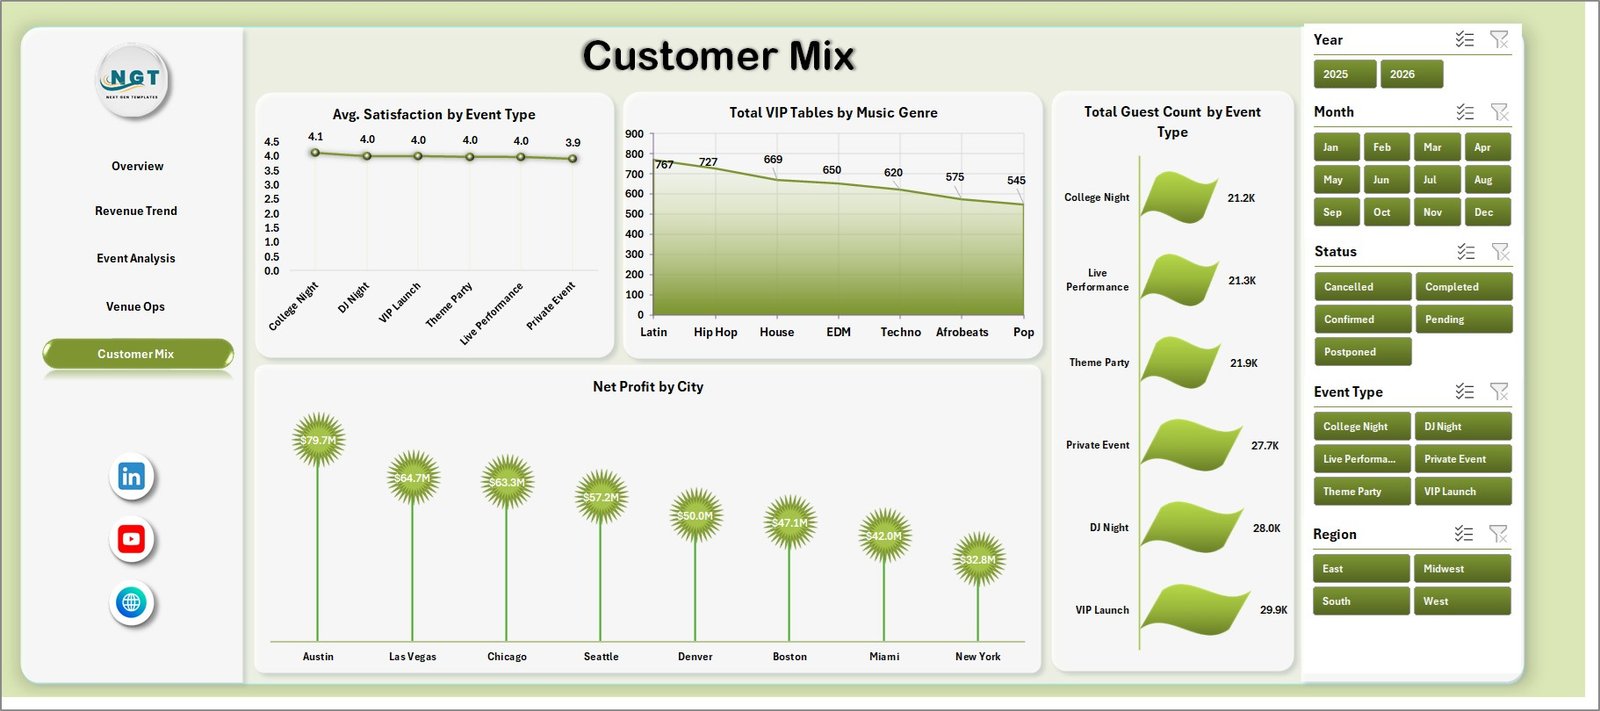
Customer Mix
Data Sheet Tab
The Data Sheet is where you add your nightclub event records in the same format as the sample data. Keep the headers consistent so pivots, slicers, charts, and KPI cards continue to work correctly.

Data Sheet tab
Support Sheet
The Support Sheet contains the pivot tables used to create the dashboard dynamically. After updating the Data Sheet, go to the Excel Data ribbon and click Refresh All. You can keep this sheet hidden for regular users.

Support sheet tab
Nightclubs Dashboard in Excel vs. Google Sheets vs. Paid CRM/SaaS – Where This Fits
| Feature | This Excel template | Google Sheets alternative | Paid venue SaaS |
|---|---|---|---|
| Cost | $17.99 one-time sale price | Low software cost but more setup work | Recurring subscription |
| Platform | Microsoft Excel | Browser-based spreadsheet | Vendor-hosted system |
| Setup time | Replace data and refresh pivots | Import and rebuild formulas/charts | Onboarding and configuration |
| Custom analysis | Editable sheets, pivots, slicers, and charts | Editable if built carefully | Depends on plan permissions |
| Year-1 cost at 5 users | $17.99 plus Microsoft licensing if needed | Low software cost plus build time | Often hundreds or thousands |
Who This Template Is For – and Who It’s Not For
This template is useful for nightclub owners, club general managers, event promoters, venue operations teams, hospitality analysts, finance teams, and consultants who prepare venue performance reports. It is not a POS system, ticketing platform, payroll system, table reservation tool, live accounting feed, or staff scheduling app. It works best when your event and sales data is already available in structured rows and columns.
How to Use the Nightclubs Dashboard in Excel
- Open the workbook in Microsoft Excel.
- Go to the Data Sheet and replace the sample rows with your own nightclub event data.
- Keep the same headers and data format.
- Click Refresh All from the Excel Data ribbon.
- Use slicers and dashboard pages to review revenue, profit, guests, VIP tables, incidents, and satisfaction.
Real-World Use Cases
Maya, nightclub owner: reviews Total Revenue, Net Profit, VIP Tables, and Net Profit by Region before weekly leadership meetings.
Dev, event promoter: compares revenue, cost, attendance, and music genre performance to decide which event formats deserve more promotion.
Arun, venue operations manager: monitors incident percentage, satisfaction, completion status, and guest count patterns before improving staffing and crowd-flow plans.
Frequently Asked Questions
What does the Nightclubs Dashboard in Excel track?
It tracks guest count, revenue, cost, net profit, VIP tables, bar sales, table sales, completion percentage, attendance percentage, incident event percentage, satisfaction, regions, cities, club names, event types, music genres, promoters, and customer segments.
Can I use my own nightclub data?
Yes. Replace the sample rows in the Data Sheet, keep the same column structure, and click Refresh All in Excel.
Does this template use macros?
No. It is designed around standard Excel tables, pivot tables, slicers, and charts.
Can I customize the dashboard?
Yes. You can edit chart labels, pivot fields, slicers, colors, sheet names, and source data fields if you are comfortable with Excel.
Is this a subscription?
No. It is a one-time downloadable Excel template from NextGenTemplates.
Is this a full nightclub management system?
No. It is an analytics dashboard. It does not replace POS, payroll, ticketing, or reservation systems.
About the Author
Built by PK – Microsoft Certified Professional with 15+ years of Excel, Google Sheets, and Power BI experience. Founder of NextGenTemplates, reaching 300K+ subscribers across YouTube channels. Every template is hand-built and tested before release.
Explore Related Templates
You may also like Hotel and Hospitality Revenue Dashboard in Excel, Event Management Analysis Dashboard in Excel, and Hospitality Dashboard in Excel. You can also browse all Excel dashboard templates.
Download the Nightclubs Dashboard in Excel today and turn your nightclub event data into clear, filterable performance reports.
Last updated: July 12, 2026.






























Reviews
There are no reviews yet.