

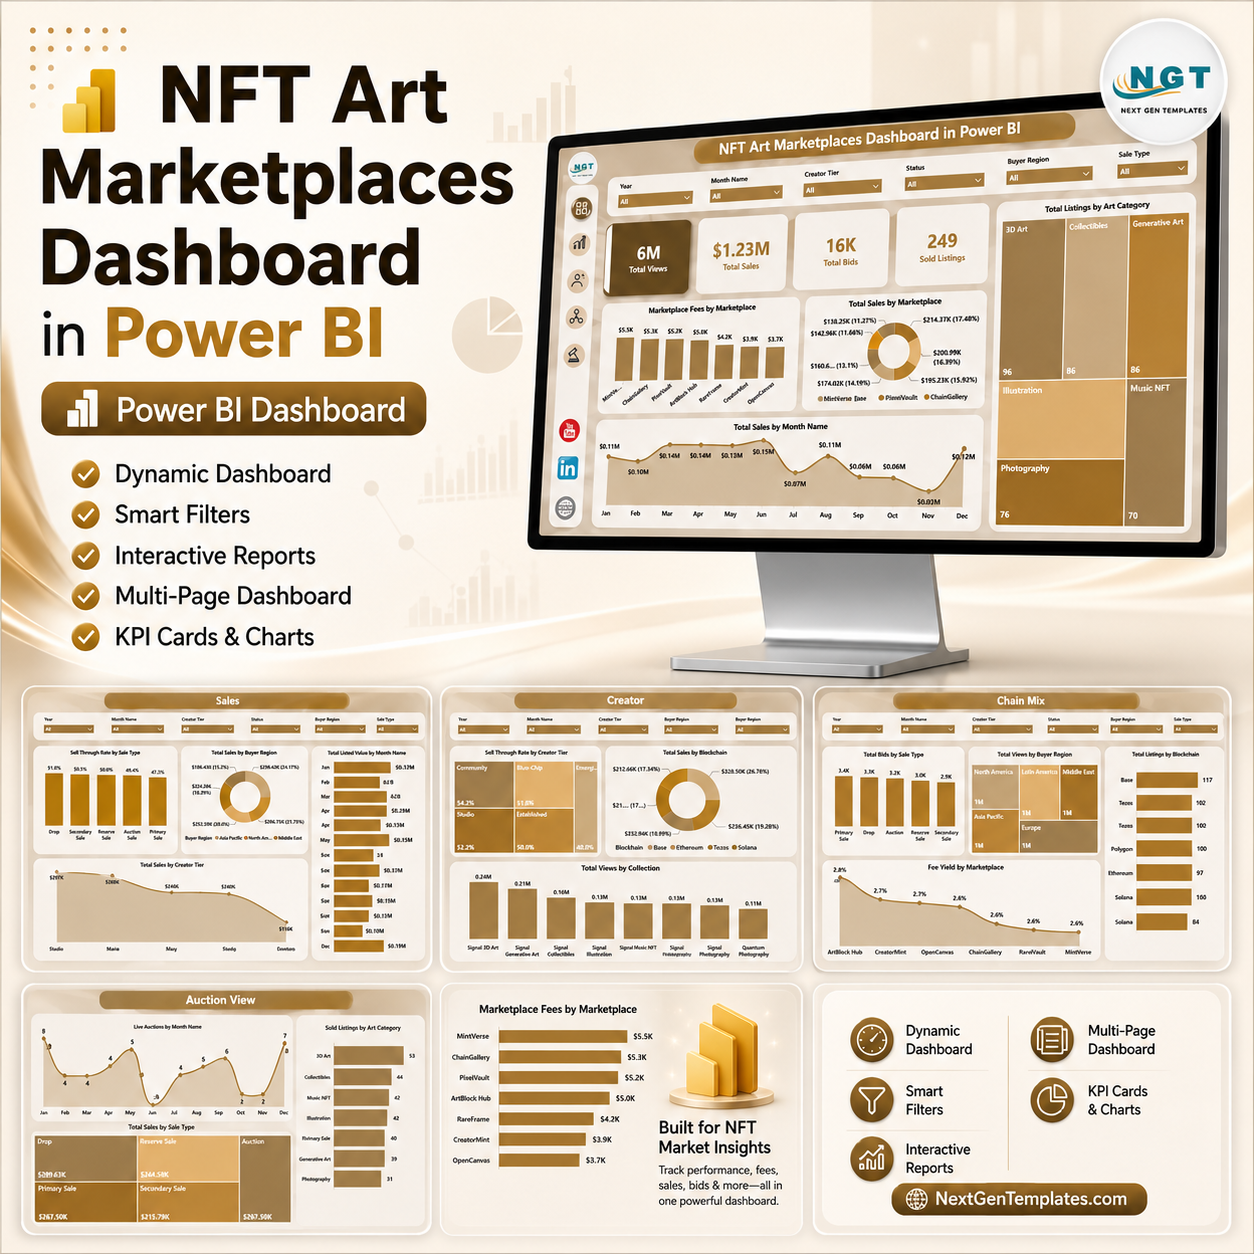

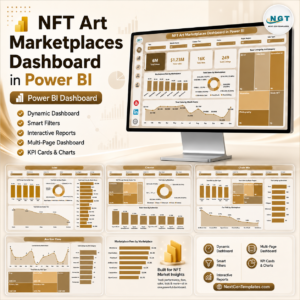
NFT Art Marketplaces Dashboard in Power BI gives NFT marketplace operators, creator teams, Web3 analysts, and digital art businesses a ready-to-use Power BI report with 5 report pages, 4 high-level KPI cards, 18 focused visual analyses, and slicer-based filtering. Instead of reviewing marketplace exports one chart at a time, you can monitor views, sales, bids, sold listings, marketplace fees, creator royalties, blockchain mix, buyer regions, art categories, live auctions, and sale types in one interactive dashboard. The report is built for one-time use, no recurring dashboard subscription, and includes a clear risk reversal: replace the sample data with your own marketplace data and customize the model as needed in Power BI Desktop.
Key Features of NFT Art Marketplaces Dashboard in Power BI
- 5 Power BI pages: Overview, Sales, Creator, Chain Mix, and Auction View.
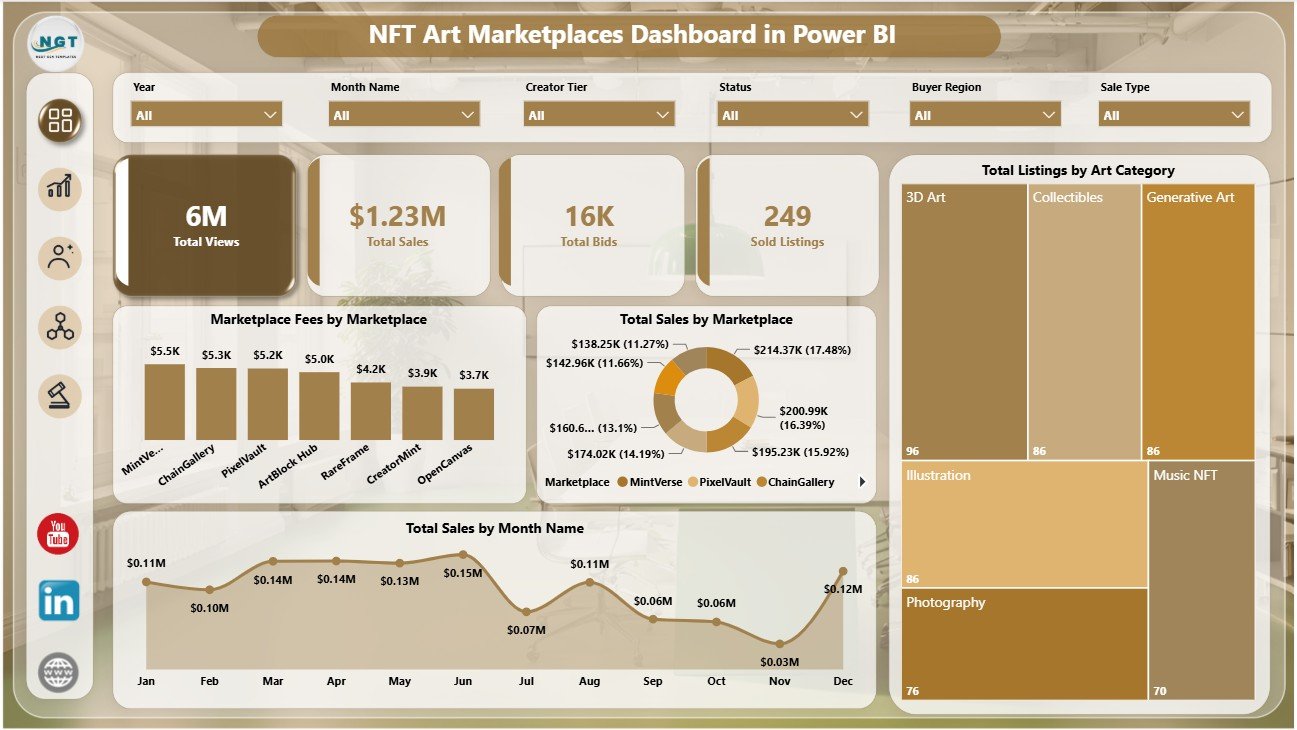
- 4 executive KPI cards: Total Views, Total Sales, Total Bids, and Sold Listings.
- 18 analytical visuals: Analyze marketplace fees, sales, listings, sell-through rate, royalties, blockchain mix, bids, auctions, and buyer regions.
- Fast slicer filtering: Filter report pages by marketplace, blockchain, creator tier, buyer region, art category, sale type, and date fields where included.
- Power BI-ready structure: Open the .pbix file in Power BI Desktop and adapt the sample model to your own NFT marketplace records.
- Designed for decision reviews: Use high-level cards for executive summaries and page-level visuals for deeper analysis.
What’s Inside the NFT Art Marketplaces Dashboard in Power BI
The report is organized into five practical pages. The Overview page summarizes performance with KPI cards and marketplace/category trends. The Sales page focuses on sale type, buyer region, monthly listed value, and creator tier. The Creator page highlights sell-through, blockchain, royalties, and collection demand. The Chain Mix page compares bidding, buyer engagement, blockchain listings, and fee yield. The Auction View page tracks live auctions, sold listings, and sales by sale type.
Overview Page
The Overview page shows Total Views, Total Sales, Total Bids, and Sold Listings at the top so teams can read marketplace performance quickly. Marketplace Fees by Marketplace highlights fee burden, Total Sales by Marketplace shows revenue concentration, Total Sales by Month Name reveals trend movement, and Total Listings by Art Category explains inventory mix.
Sales Page
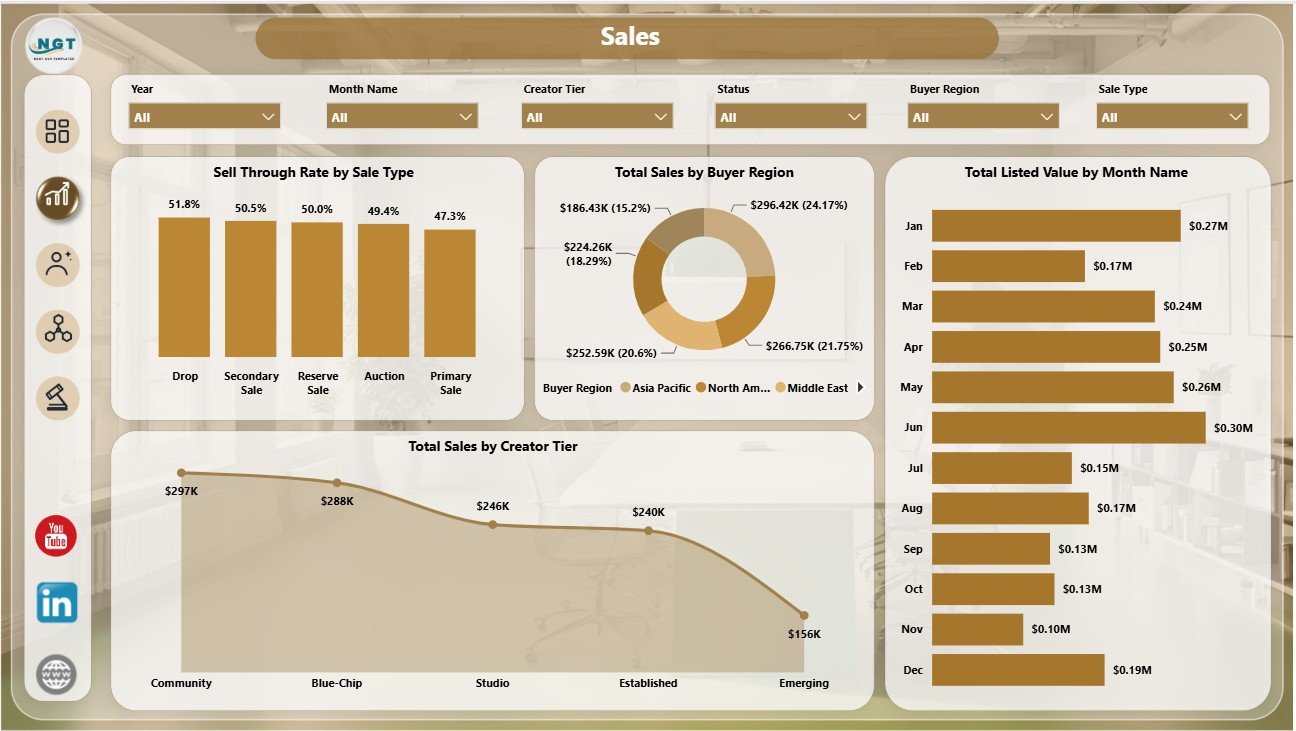
The Sales page helps users review revenue quality and buyer patterns. Sell Through Rate by Sale Type compares auction and fixed-price effectiveness, Total Sales by Buyer Region shows geographic demand, Total Listed Value by Month Name shows listing pipeline movement, and Total Sales by Creator Tier highlights creator segment performance.
Creator Page
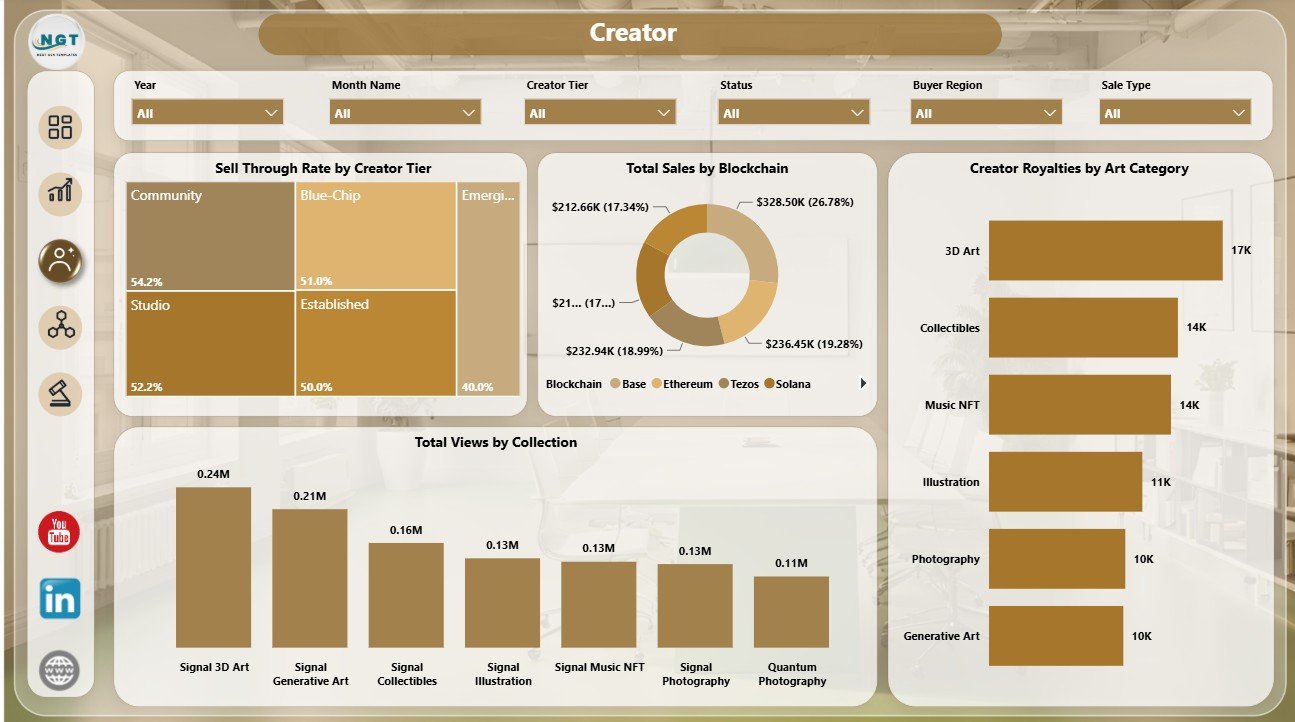
The Creator page is useful for collection managers and artist relations teams. Sell Through Rate by Creator Tier compares performance across creator levels, Total Sales by Blockchain shows which network contributes revenue, Creator Royalties by Art Category shows where royalty value is generated, and Total Views by Collection identifies the collections attracting buyer attention.
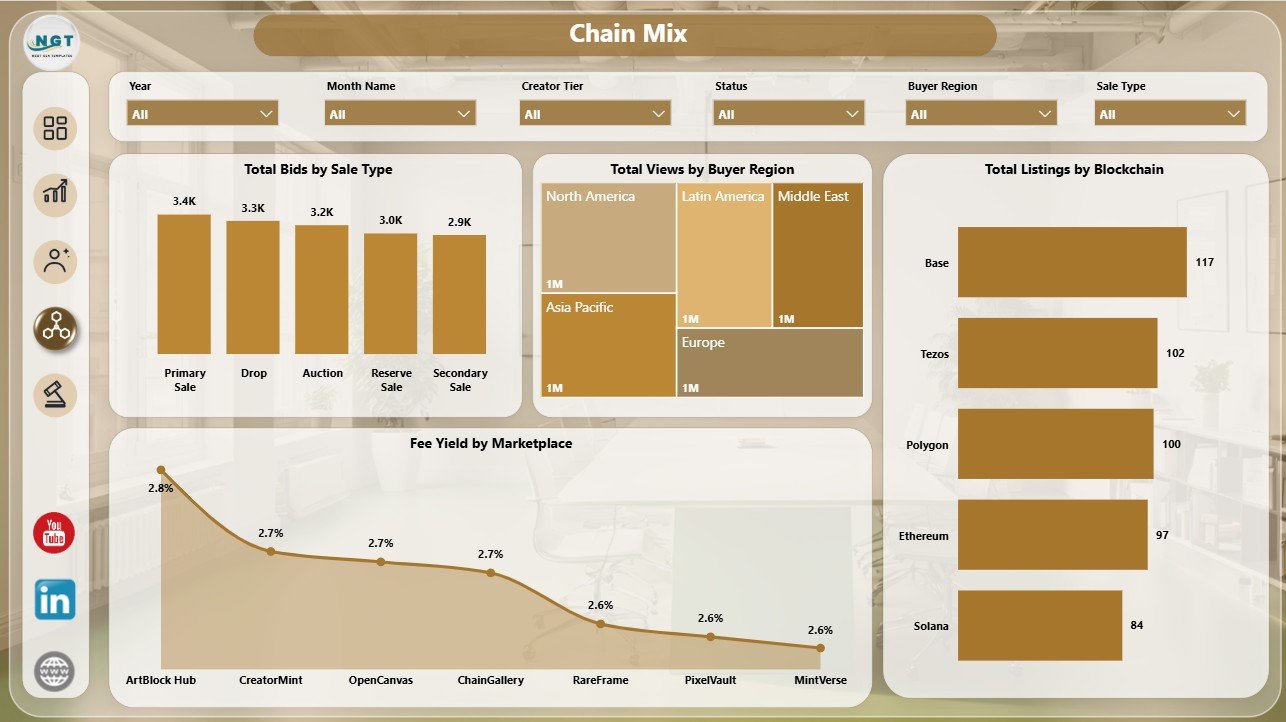
Chain Mix Page
The Chain Mix page helps compare platform economics and audience distribution. Total Bids by Sale Type shows buyer activity by sale model, Total Views by Buyer Region shows where attention is coming from, Total Listings by Blockchain explains network distribution, and Fee Yield by Marketplace compares fee efficiency.
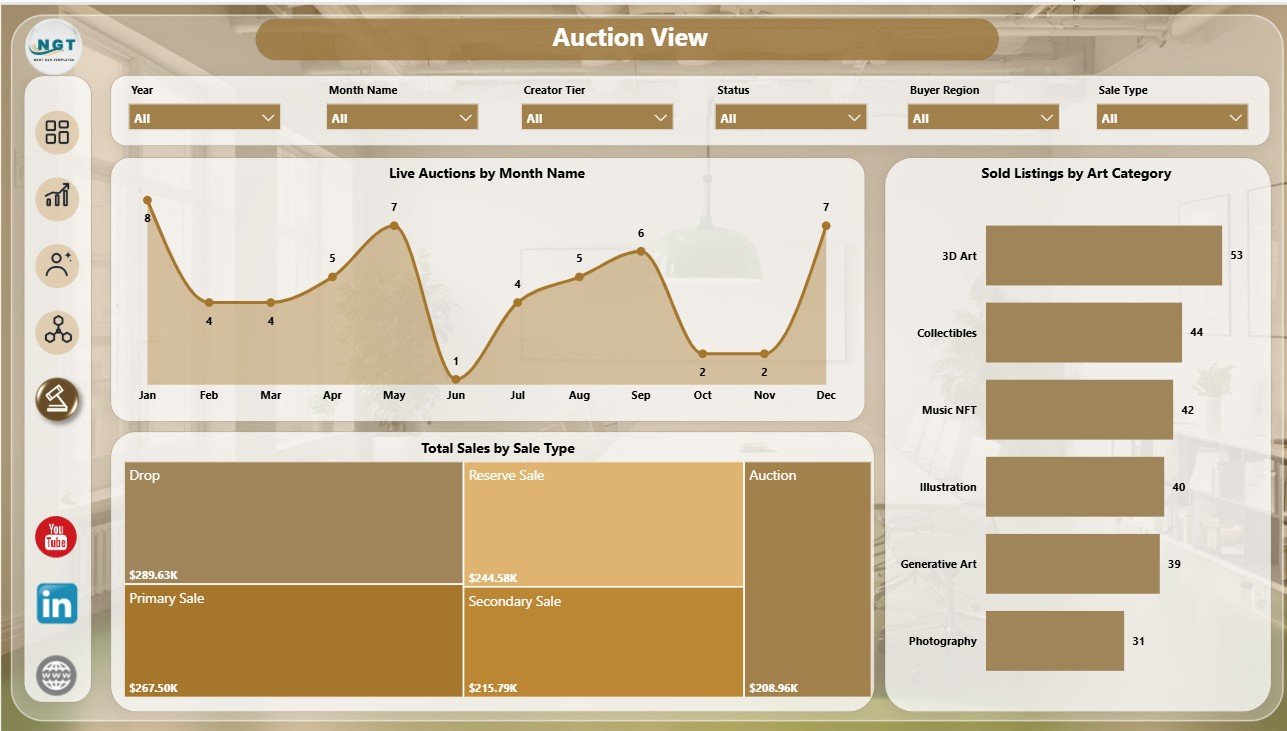
Auction View Page
The Auction View page focuses on active marketplace selling activity. Live Auctions by Month Name shows auction momentum, Sold Listings by Art Category reveals which categories convert, and Total Sales by Sale Type compares how much revenue comes from auctions versus other sale methods.
NFT Art Marketplaces Dashboard in Power BI vs. Tableau vs. Paid CRM/SaaS – Where This Fits
| Feature | This Power BI Dashboard | Tableau Alternative | Paid SaaS Alternative |
|---|---|---|---|
| Cost | $17.99 one-time template purchase | License or creator subscription may be needed | Monthly subscription |
| Platform | Power BI Desktop and Power BI Service | Tableau Desktop or Cloud | Vendor-hosted platform |
| Setup time | Open .pbix and replace sample data | Requires report recreation or conversion | Often needs onboarding |
| Customizable fields | Editable model, visuals, measures, and filters | Editable if rebuilt in Tableau | Often plan-limited |
| Share with link | Available through Power BI Service | Available through Tableau Cloud/Server | Usually included |
| Year-1 cost at 5 users | $17.99 plus any Microsoft licensing | Can be hundreds or thousands depending on license | Often $600 to $6,000+ |
| NFT marketplace metrics | Built into the report pages | Requires dashboard build | Depends on vendor coverage |
Who This Template Is For – and Who It’s Not For
This template is for NFT marketplace founders, digital art teams, creator relations managers, Web3 analysts, collector communities, and agencies that need a Power BI dashboard for sales, bids, listings, fees, royalties, buyer regions, chains, and auctions.
This template is not for teams that need live wallet indexing, automatic blockchain node ingestion, smart contract monitoring, or a managed SaaS analytics backend. Those teams can still use this dashboard as a reporting layer after exporting or preparing data.
How to Use the NFT Art Marketplaces Dashboard in Power BI
- Download and unzip the product file.
- Open the .pbix file in Power BI Desktop.
- Review the sample data structure and replace it with your own prepared marketplace data.
- Refresh the report and check all 5 pages.
- Use slicers and page filters to review marketplace, chain, creator, buyer, category, and sale-type performance.
Real-World Use Cases
Maya, an NFT marketplace operator, uses the Overview and Auction View pages to prepare weekly updates on views, bids, sales, sold listings, live auctions, and fee pressure.
Dev, a creator success manager, uses the Creator page to compare royalty contribution, creator tier sell-through, collection views, and blockchain-level sales.
Arun, a Web3 reporting analyst, updates the data model with monthly exports and uses Chain Mix to explain buyer region, sale type, marketplace, and blockchain shifts to stakeholders.
Frequently Asked Questions
What does this NFT Art Marketplaces Dashboard in Power BI track?
It tracks total views, total sales, total bids, sold listings, marketplace fees, sales by marketplace and month, listings by art category, sell-through rate, buyer region, creator tier, blockchain, royalties, collection views, live auctions, and sale types.
Do I need Power BI Desktop?
Yes. The dashboard is a Power BI file, so you should open it in Power BI Desktop, which is available from Microsoft.
Can I replace the sample data?
Yes. The template is designed so you can replace the sample source with your own prepared NFT marketplace data and refresh the visuals.
Does it connect to live NFT marketplaces automatically?
No. This is a Power BI dashboard template, not a live blockchain API connector. You can connect your own source if you have a prepared export or API workflow.
Can I customize pages and visuals?
Yes. You can edit Power BI visuals, measures, filters, colors, model fields, and page layouts.
Is this only for NFT art?
It is designed around NFT art marketplaces, but the structure can be adapted for other digital collectibles if the data fields are similar.
About the Author
Built by PK – Microsoft Certified Professional with 15+ years of Excel, Google Sheets, and Power BI experience. Founder of NextGenTemplates, reaching 300K+ subscribers across YouTube channels. Every template is hand-built and tested before release.
Explore Related Templates
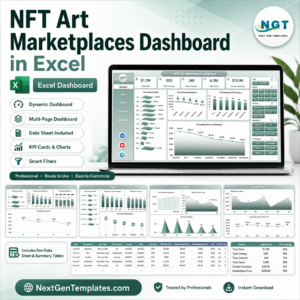
- NFT Art Marketplaces Dashboard in Excel
- Mutual Funds Dashboard in Power BI
- Browse Power BI templates
- Explore Power BI Dashboard templates
Ready to review NFT art marketplace performance in Power BI? Download the NFT Art Marketplaces Dashboard in Power BI, replace the sample data, and start analyzing sales, bids, listings, royalties, fees, chains, and auctions in minutes.
Last updated: July 12, 2026.





























Reviews
There are no reviews yet.