






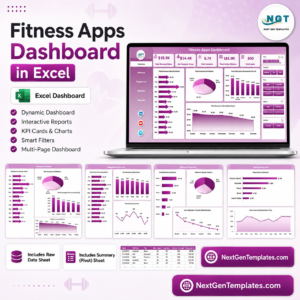
Fitness Apps Dashboard in Excel gives fitness app founders, product managers, subscription analysts, and growth teams a ready workbook for tracking app revenue, subscriptions, sessions, active minutes, users, churn, regions, acquisition channels, platforms, plans, trainers, workout categories, and support cost. The workbook includes 7 worksheet tabs, 5 headline KPI cards, 20 analysis charts, multiple slicers, a structured Data sheet, and a pivot-powered Support sheet. For a one-time price of $17.99, teams can move from scattered app exports to a refreshable Excel dashboard without paying for another SaaS analytics layer.
Key Features of Fitness Apps Dashboard in Excel
- 7 worksheet tabs covering Overview, Revenue, Engagement, Retention, Channels, Data Sheet, and Support Sheet.
- 5 executive KPI cards for Total Revenue Value, Net Revenue Value, Total Sessions, Total Active Minutes, and Total Users.
- Multiple slicers to filter the dashboard quickly by app, platform, region, plan, channel, workout category, trainer, status, segment, and time fields.
- Revenue analysis by month, region, subscription revenue, app name, plan type, acquisition channel, and support cost.
- Engagement reporting by trainer, user segment, user status, active minutes, sessions, and month.
- Retention views for Active User %, churn, plan type, region, and acquisition-channel revenue.
- Channel analysis for net revenue by platform, net revenue by user segment, and support cost by app.
- Refresh All workflow using Excel pivot tables so charts and KPI cards update after data replacement.
What’s Inside the Fitness Apps Dashboard in Excel
1. Overview Page
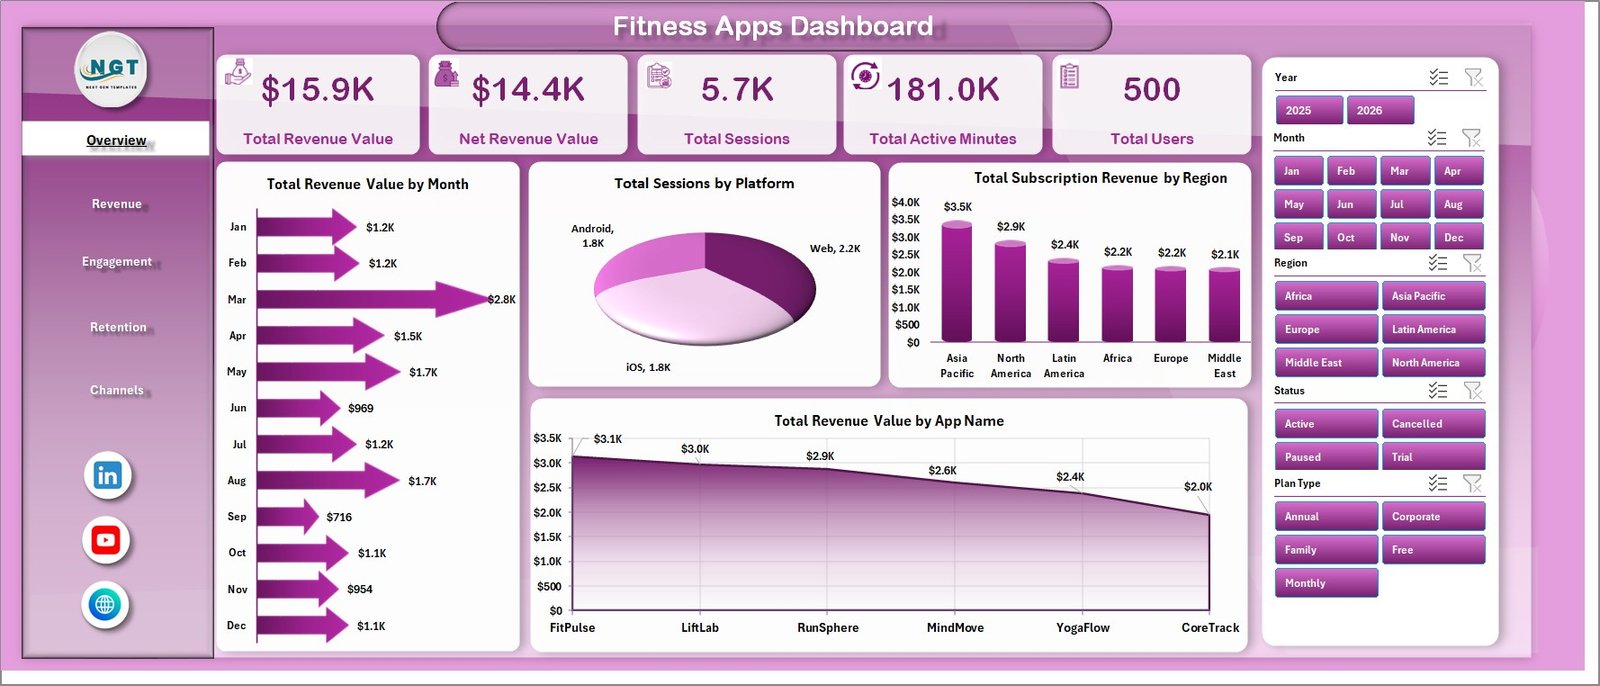
The Overview Page gives a leadership-level summary of app performance. At the top, KPI cards show Total Revenue Value, Net Revenue Value, Total Sessions, Total Active Minutes, and Total Users, while slicers let users filter the full dashboard in seconds.
Total Revenue Value by Month: This chart shows how revenue moves month by month, making it easier to identify seasonal trends, campaign impact, and subscription growth patterns. It is useful for monthly business reviews and app monetization discussions.
Total Sessions by Platform: This chart compares usage volume across platforms such as iOS, Android, and web. It helps product and growth teams understand where users are spending the most time.
Total Subscription Revenue by Region: This visual breaks subscription revenue by geographic region. It helps teams spot high-value markets and prioritize local campaigns or pricing reviews.
Total Revenue Value by App Name: This chart compares revenue across multiple app names or app brands. It is helpful for portfolio owners managing more than one fitness or wellness app.
2. Revenue
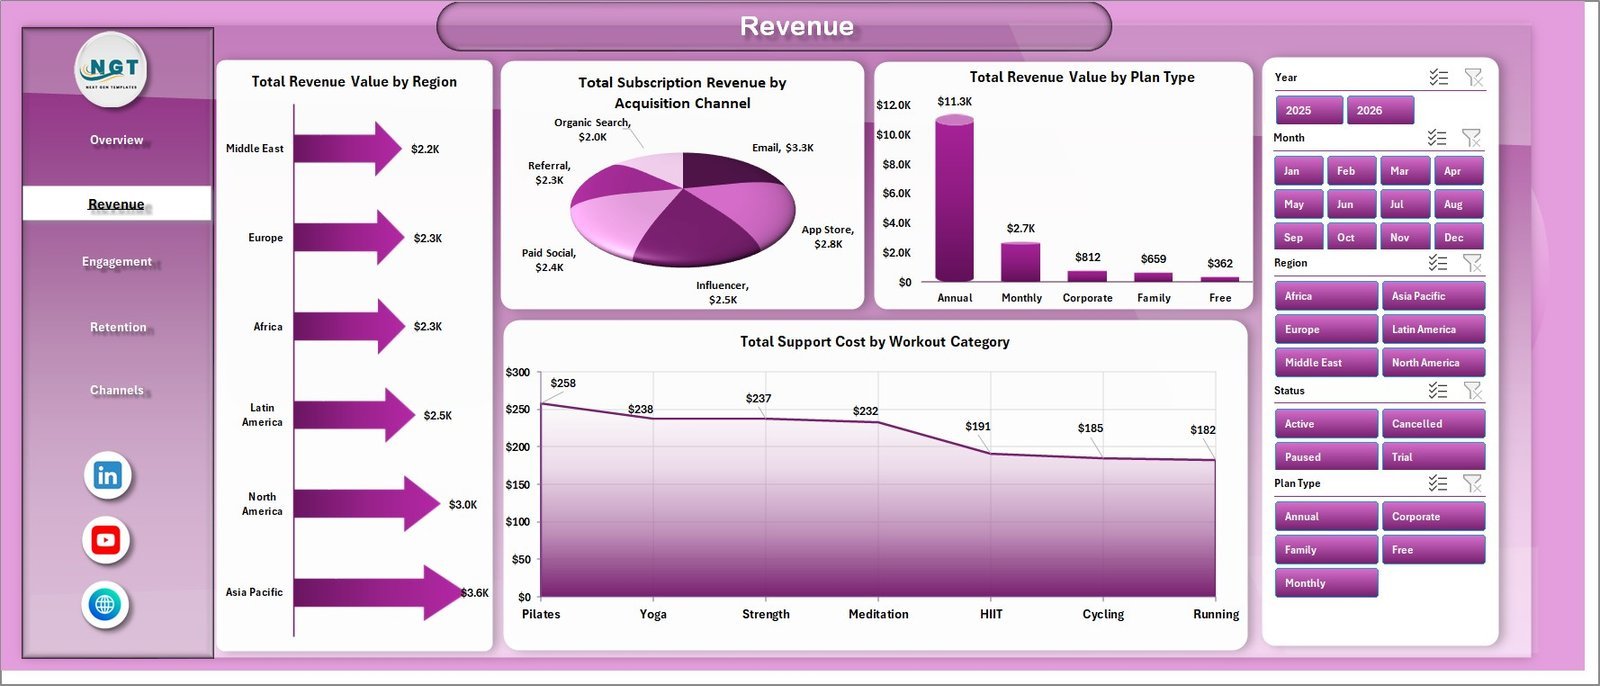
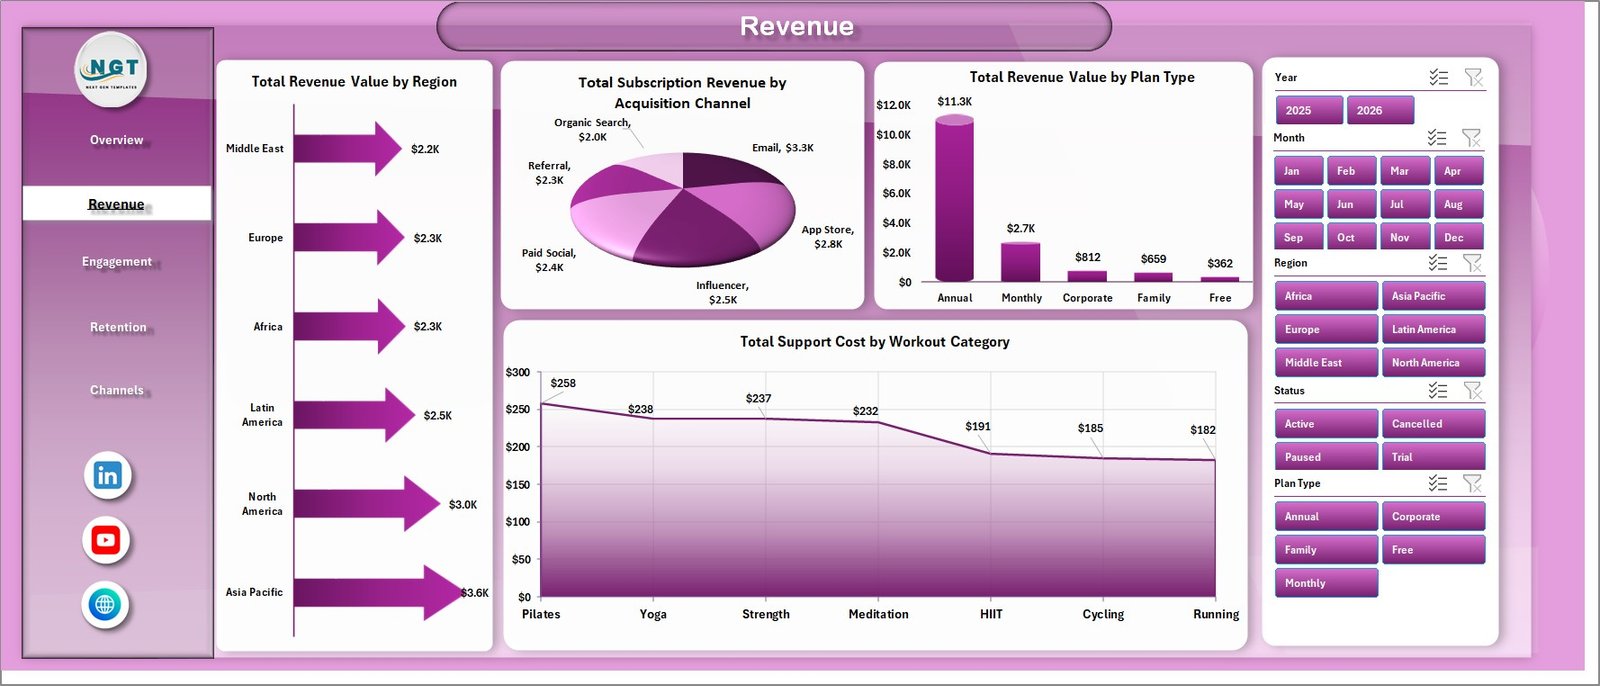
The Revenue sheet focuses on income drivers and cost pressure. It includes Total Revenue Value by Region, Total Subscription Revenue by Acquisition Channel, Total Revenue Value by Plan Type, and Total Support Cost by Workout Category.
3. Engagement
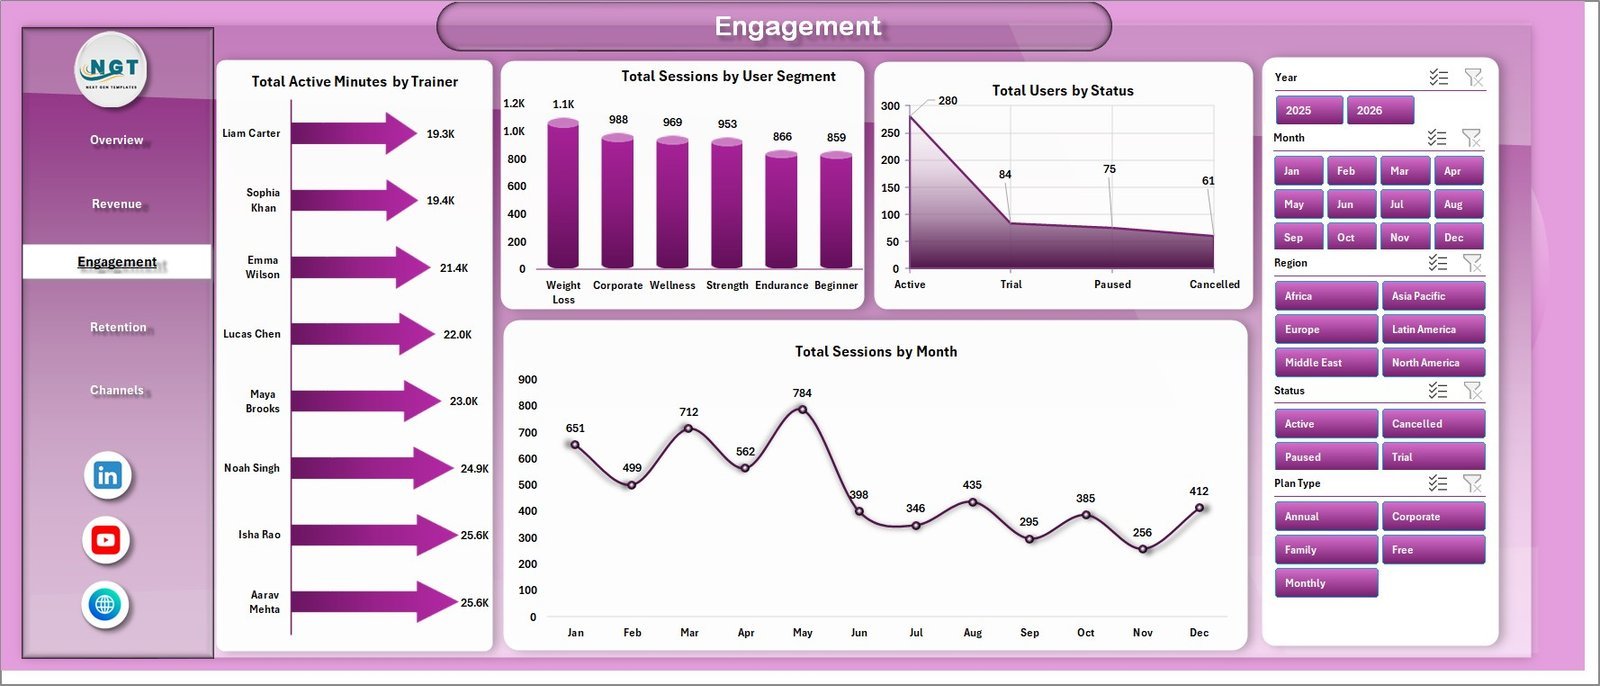
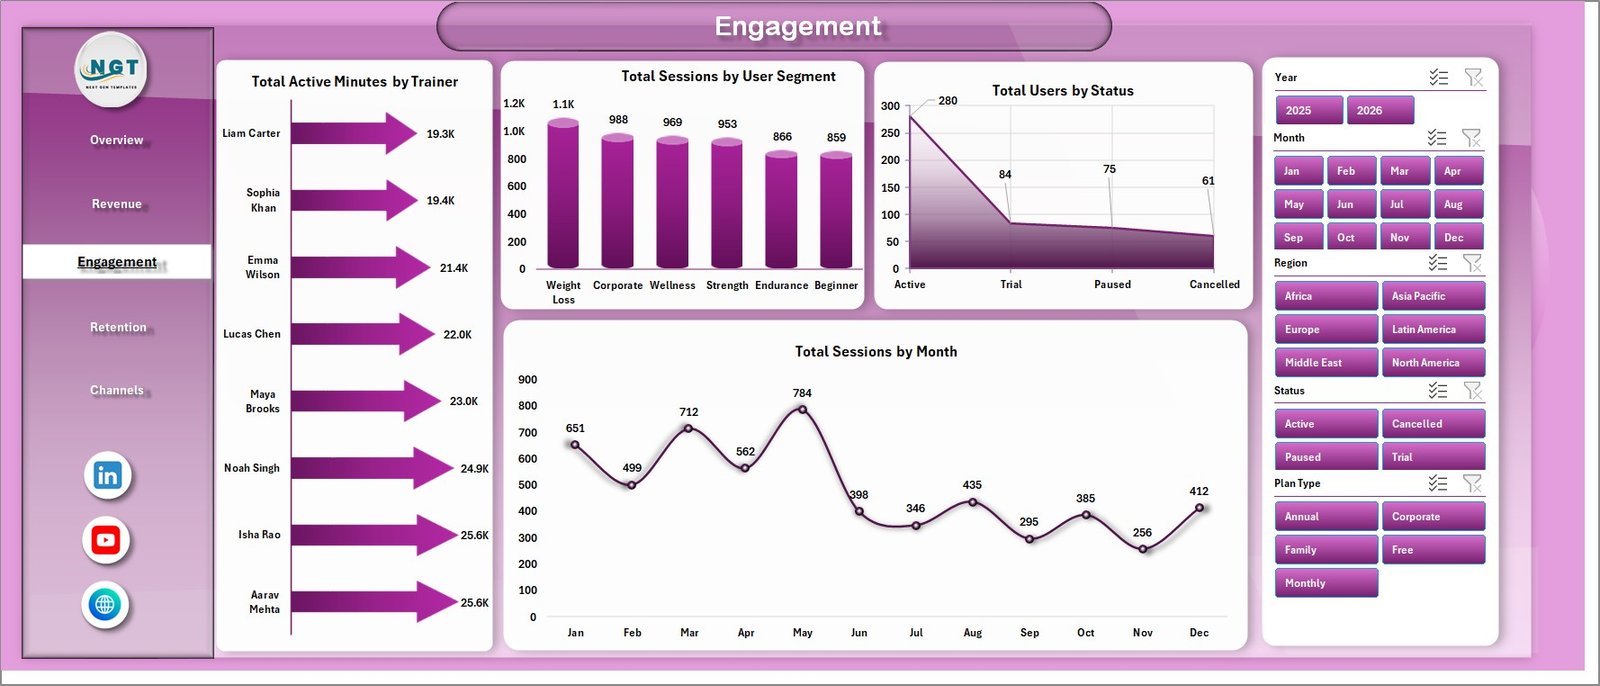
The Engagement sheet explains how users interact with the fitness app. It includes Total Active Minutes by Trainer, Total Sessions by User Segment, Total Users by Status, and Total Sessions by Month.
4. Retention
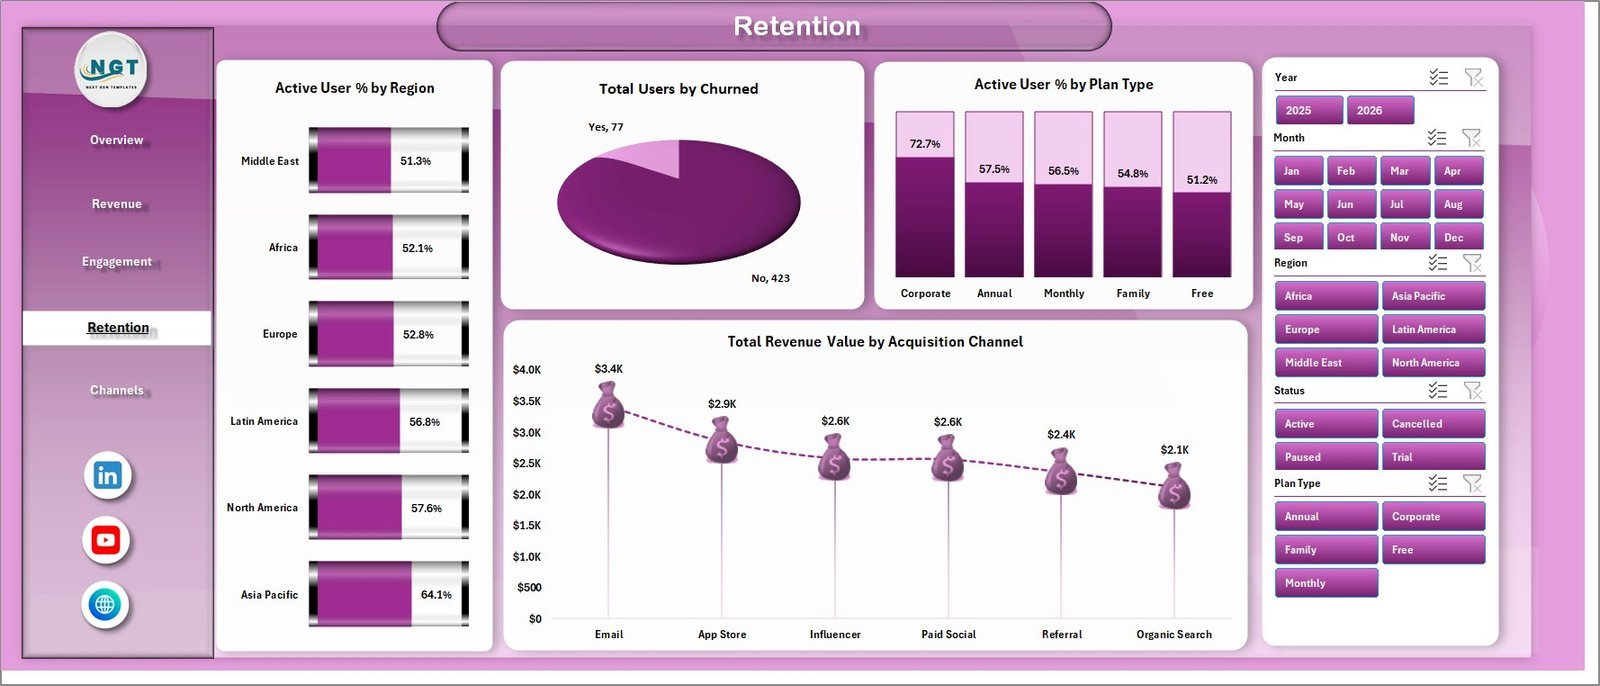
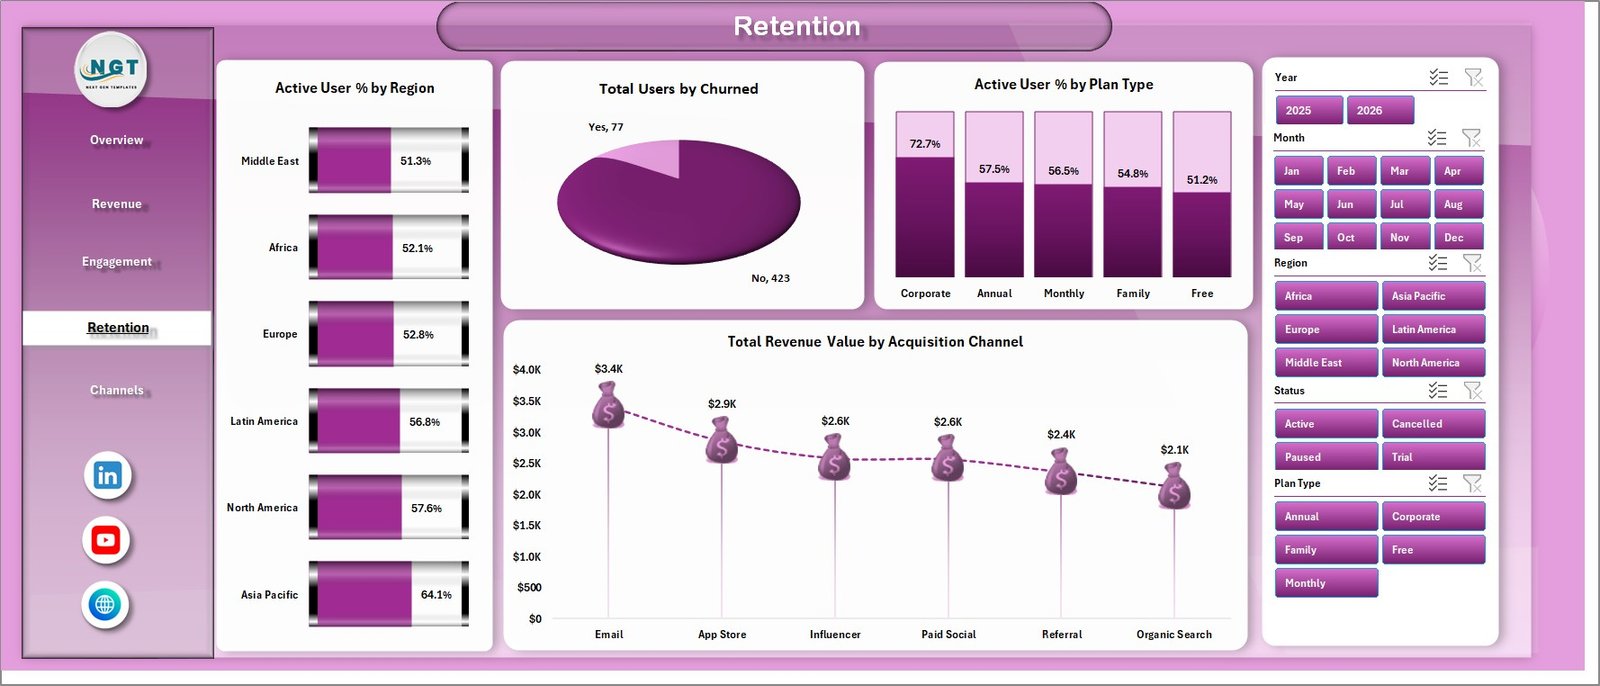
The Retention sheet helps teams review churn, active user percentage, and revenue quality. It includes Active User % by Region, Total Users by Churned, Active User % by Plan Type, and Total Revenue Value by Acquisition Channel.
5. Channels
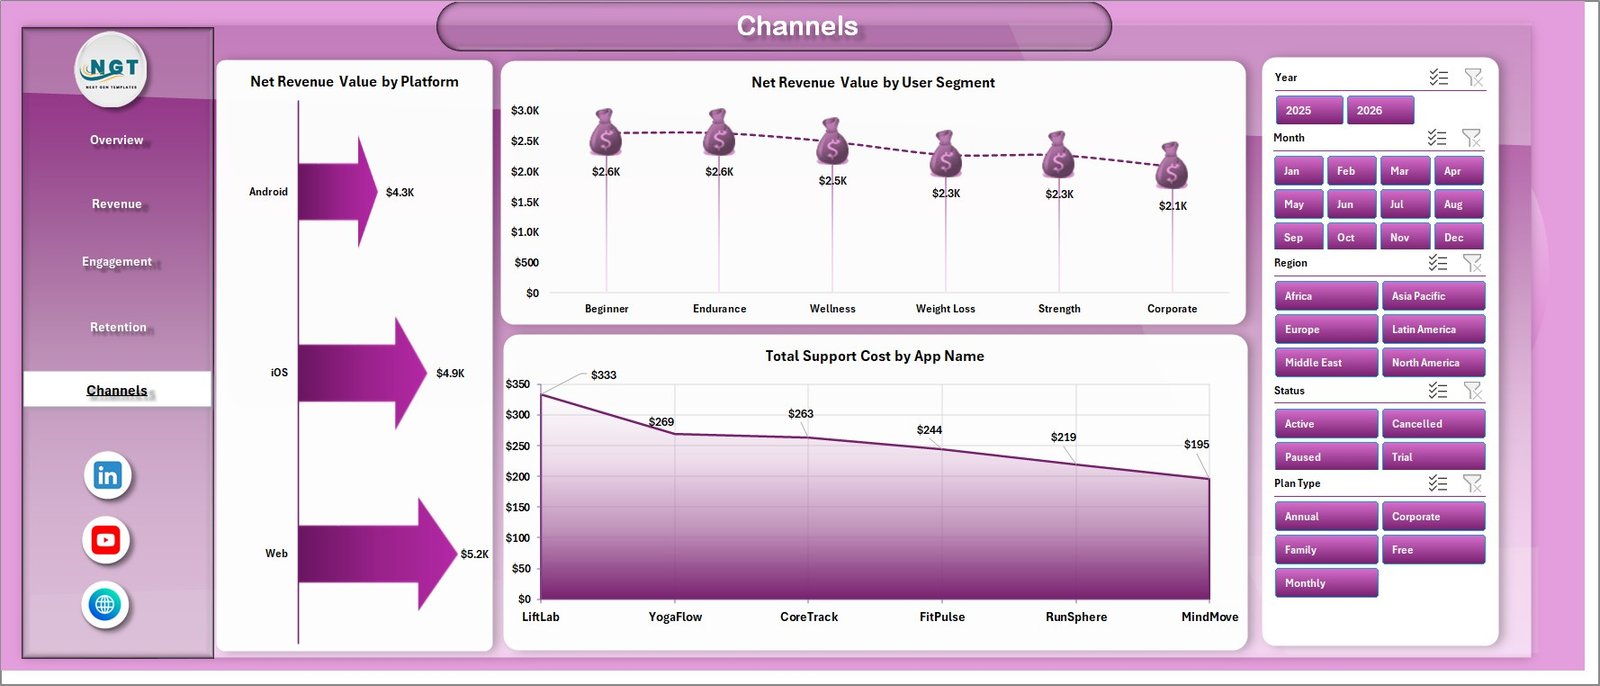
The Channels sheet connects user source, platform, segment, and cost. It includes Net Revenue Value by Platform, Net Revenue Value by User Segment, and Total Support Cost by App Name.
6. Data Sheet Tab
The Data Sheet is where users paste or enter fitness app records in the same column format as the sample data. Keep the structure unchanged, refresh the workbook, and the dashboard pages update automatically.

7. Support Sheet Tab
The Support Sheet contains the pivot tables used to build the dynamic dashboard. After updating the Data sheet, go to the Data tab in the Excel Ribbon and click Refresh All. You can keep this sheet hidden during normal use.

Fitness Apps Dashboard in Excel vs. Google Sheets vs. Paid App Analytics SaaS – Where This Fits
| Feature | This Excel Dashboard | Google Sheets Alternative | Paid App Analytics SaaS |
|---|---|---|---|
| Cost | $17.99 one-time | Low cost, but often needs rebuild | Monthly or annual subscription |
| Platform | Microsoft Excel | Browser spreadsheet | Vendor cloud platform |
| Setup time | Replace data and refresh | Copy sheet and adjust formulas | Requires onboarding and integrations |
| Customizable fields | Fully editable workbook | Editable sheet | Limited by vendor setup |
| Share with link | Use OneDrive or SharePoint if needed | Built-in sharing | Login controlled |
| Year-1 cost at 5 users | $17.99 plus Excel licensing already used | Usually low | Often hundreds or thousands |
| Fitness app analytics | 5 dashboard pages plus data and pivots | Requires equivalent build | Depends on plan and source connectors |
Who This Template Is For – and Who It’s Not For
This template is for fitness app owners, wellness app teams, subscription analysts, product managers, trainers managing digital programs, growth marketers, and finance users who need recurring visibility into revenue, sessions, active minutes, users, subscriptions, churn, regions, platforms, plans, and acquisition channels.
It is not a live app-store connector, mobile SDK, push notification tool, attribution platform, or replacement for Firebase, Amplitude, Mixpanel, Appsflyer, or in-app billing systems. It works best when your app data can be exported into a structured Excel table.
How to Use the Fitness Apps Dashboard in Excel
- Download and unzip the product file.
- Open the workbook in Microsoft Excel.
- Go to the Data Sheet tab and replace the sample records with your own fitness app data.
- Keep the same column headers and field format so pivots and slicers continue working.
- Open the Data ribbon and click Refresh All.
- Use slicers to review performance by app, platform, region, plan, acquisition channel, trainer, user status, segment, and time period.
- Hide the Support Sheet if you only want end users to see the dashboard pages.
Real-World Use Cases
Aarav, Fitness App Founder: Aarav reviews monthly revenue, net revenue, active minutes, and platform sessions before investor updates.
Maya, Product Manager: Maya filters engagement by user segment, trainer, and plan type to understand which programs drive repeat sessions.
Jordan, Growth Analyst: Jordan compares subscription revenue by acquisition channel and region to decide where campaign budget should move next.
Frequently Asked Questions
What KPI cards are included?
The Overview page includes Total Revenue Value, Net Revenue Value, Total Sessions, Total Active Minutes, and Total Users.
How many worksheet tabs are included?
The workbook includes 7 worksheet tabs: Overview, Revenue, Engagement, Retention, Channels, Data Sheet, and Support Sheet.
Can I use data from more than one app?
Yes. The dashboard includes app-name analysis, so you can compare multiple fitness apps or product lines as long as they follow the same Data Sheet format.
Do I need macros?
No macros are required for the dashboard workflow described here. It uses Excel tables, pivot tables, charts, slicers, and Refresh All.
Can I customize the dashboard?
Yes. You can edit chart titles, slicers, formulas, pivots, fields, colors, and sheet labels to match your app reporting process.
Can the Support Sheet be hidden?
Yes. The Support Sheet powers the dashboard and can be hidden after setup.
About the Author
Built by PK – Microsoft Certified Professional with 15+ years of Excel, Google Sheets, and Power BI experience. Founder of NextGenTemplates, reaching 300K+ subscribers across YouTube channels. Every template is hand-built and tested before release.
Explore Related Templates
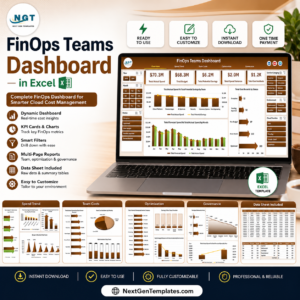
Browse more MS Excel templates and Excel Dashboard templates. Related downloads include Gym and Fitness Center Membership Management System Web App, Gym Retention Dashboard in Power BI, and FinOps Teams Dashboard in Excel.
Download the Fitness Apps Dashboard in Excel and turn app exports into a clear Excel dashboard for revenue, engagement, retention, channels, and support-cost review.
Watch the step-by-step video tutorial:
Compatibility and Requirements
- Works in Microsoft Excel desktop (Excel 2016 or later, or Microsoft 365).
- The dashboard uses pivot tables, charts and slicers, so keep the Data Sheet columns in the same format and click Refresh All after you add data. Microsoft explains slicers in Use slicers to filter data.
More Questions About This Template
Which sheets are in the workbook?
Seven sheets: Overview, Revenue, Engagement, Retention, Channels, Data Sheet and Support Sheet.
How do I load my own data?
Replace the sample records on the Data Sheet tab with your own, keep the same column headers, then open the Data ribbon and click Refresh All.
Which KPI cards are on the Overview page?
Total Revenue Value, Net Revenue Value, Total Sessions, Total Active Minutes and Total Users.
Does it need macros?
No. It uses Excel tables, pivot tables, charts, slicers and Refresh All.
Is there a Power BI version?
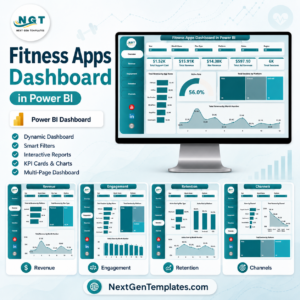
Yes. See the Fitness Apps Dashboard in Power BI.
Related Fitness Templates
- Fitness Apps Dashboard in Power BI: the same fitness app reporting in Power BI
- Fitness Apps KPI Dashboard in Excel: a KPI-focused view for fitness apps
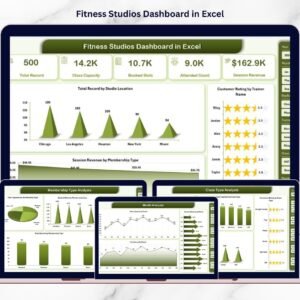
- Fitness Studios Dashboard in Excel: a dashboard for studio operations
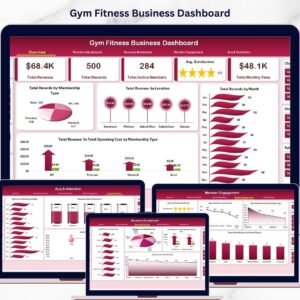
- Gym Fitness Business Dashboard in Excel: a gym-level business dashboard
- Fitness and Wellness Dashboard in Excel: a wider wellness view
Browse all Excel dashboards.




















Reviews
There are no reviews yet.