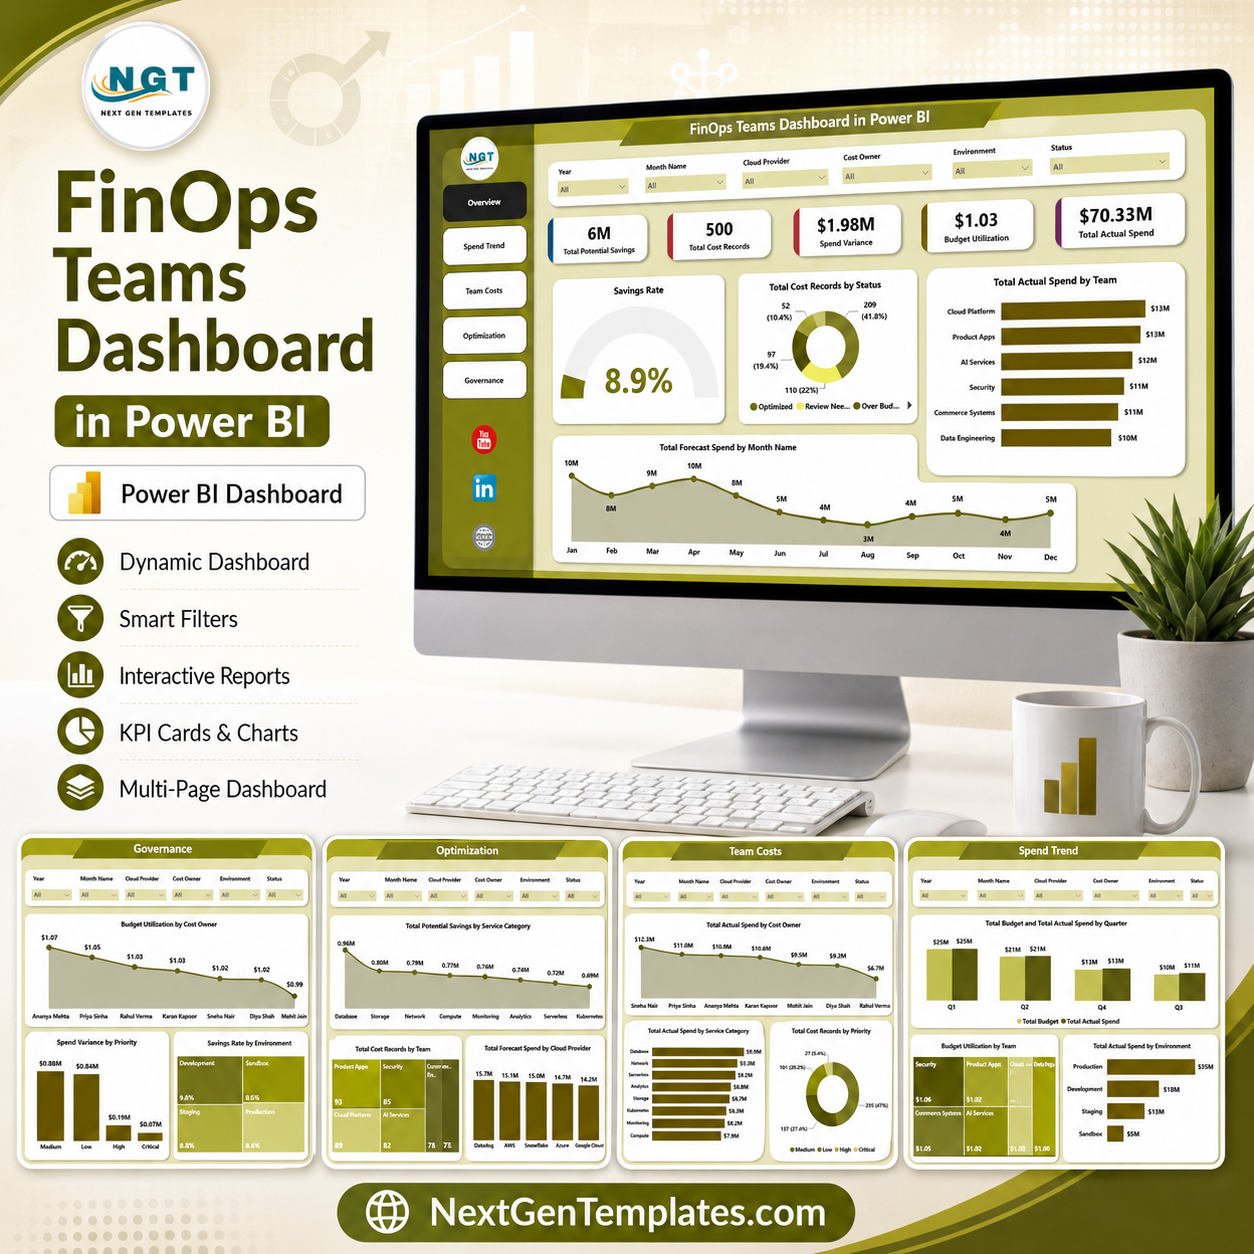


FinOps Teams Dashboard in Power BI gives cloud finance teams, engineering managers, platform owners, and cost governance leads a ready .pbix reporting template for spend control, budget tracking, savings analysis, forecast review, and FinOps governance. The dashboard includes 5 Power BI report pages, 6 executive KPI cards, 13 analytical visuals, and multiple slicers for fast filtering. For a one-time price of $17.99, teams can turn exported cloud cost records into a Power BI review dashboard without starting from a blank report or paying for another dashboard subscription.
Key Features of FinOps Teams Dashboard in Power BI
- 5 Power BI pages covering Overview, Spend Trend, Team Costs, Optimization, and Governance.
- 6 high-level KPI cards for Total Potential Savings, Total Cost Records, Spend Variance, Budget Utilization, Total Actual Spend, and Savings Rate.
- Interactive slicers to filter the dashboard quickly by cloud, team, owner, service, status, priority, environment, and time fields.
- Spend trend analysis by quarter, month, team, environment, and budget utilization.
- Team cost visibility by cost owner, service category, and priority.
- Optimization reporting for potential savings, forecast spend, cost records, teams, and cloud providers.
- Governance page for budget utilization, spend variance, savings rate, owners, priorities, and environments.
- Editable .pbix file so users can customize visuals, measures, colors, fields, and pages in Power BI Desktop.
What’s Inside the FinOps Teams Dashboard in Power BI
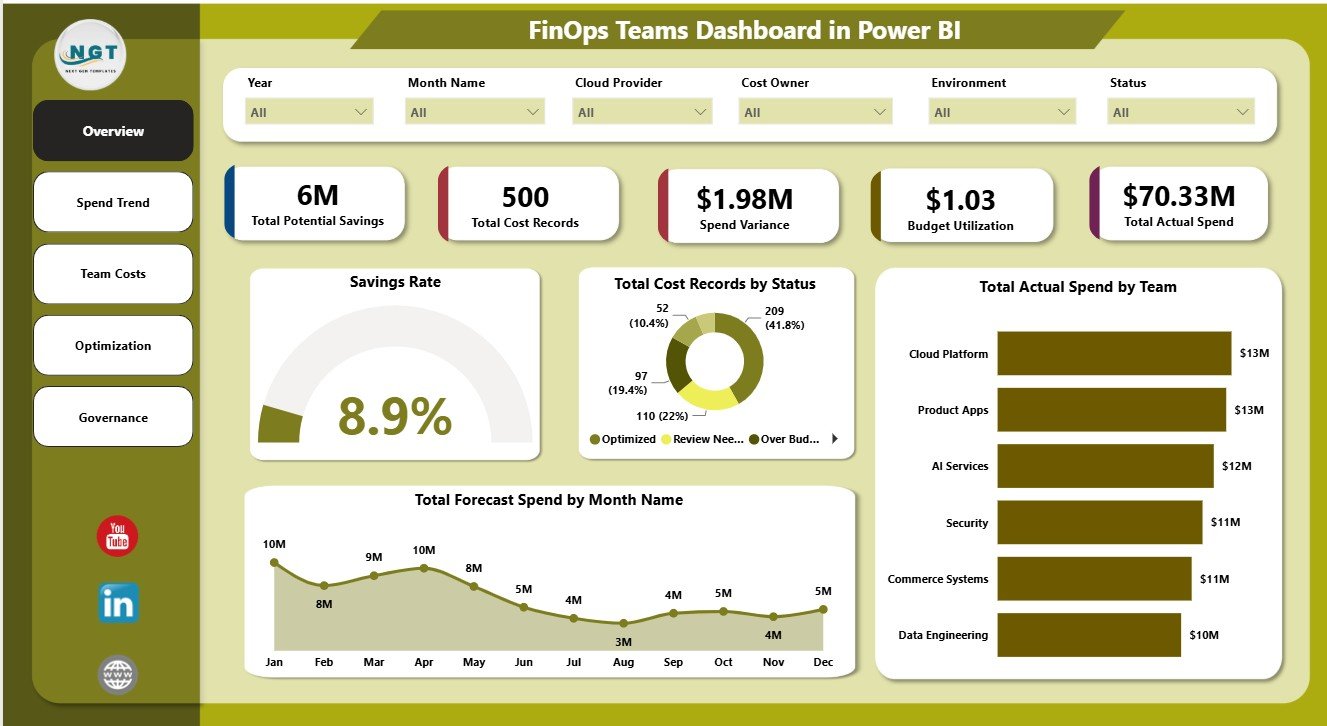
1. Overview Page
The Overview page is built for leadership-level FinOps review. The cards show Total Potential Savings, Total Cost Records, Spend Variance, Budget Utilization, Total Actual Spend, and Savings Rate, so users can understand cost health before moving into deeper analysis.
Total Cost Records by Status: This chart groups cloud cost records by status so teams can see what is open, reviewed, optimized, pending, or closed. It helps managers monitor the flow of cost actions and identify items that still need ownership.
Total Actual Spend by Team: This visual compares actual spend across teams and helps show where cloud usage is concentrated. It is useful for monthly team reviews, chargeback conversations, and engineering accountability.
Total Forecast Spend by Month Name: This trend shows forecast spend month by month. It helps finance and FinOps teams compare expected cloud spend patterns before reviewing variance.
Savings Rate by Overall Dashboard: This visual summarizes the savings rate at dashboard level. It gives stakeholders a quick indicator of optimization progress and the overall efficiency of spend reduction efforts.
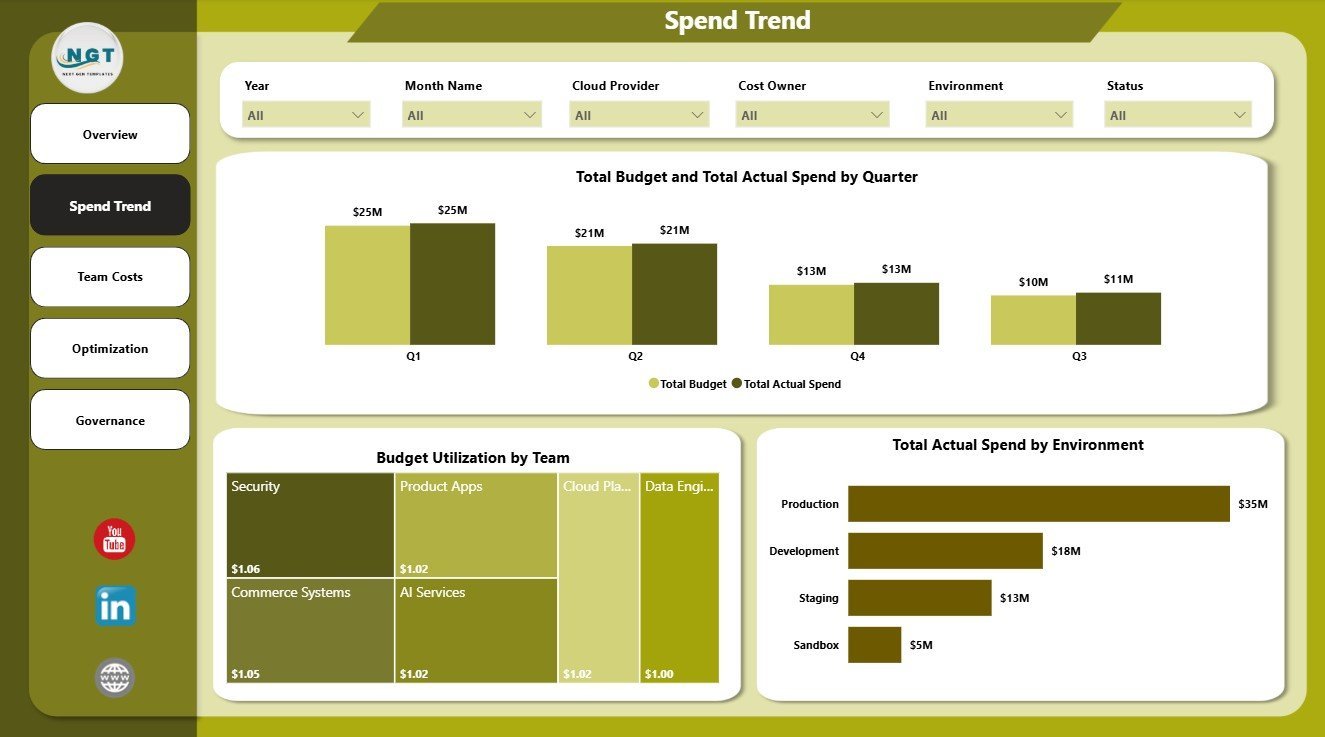
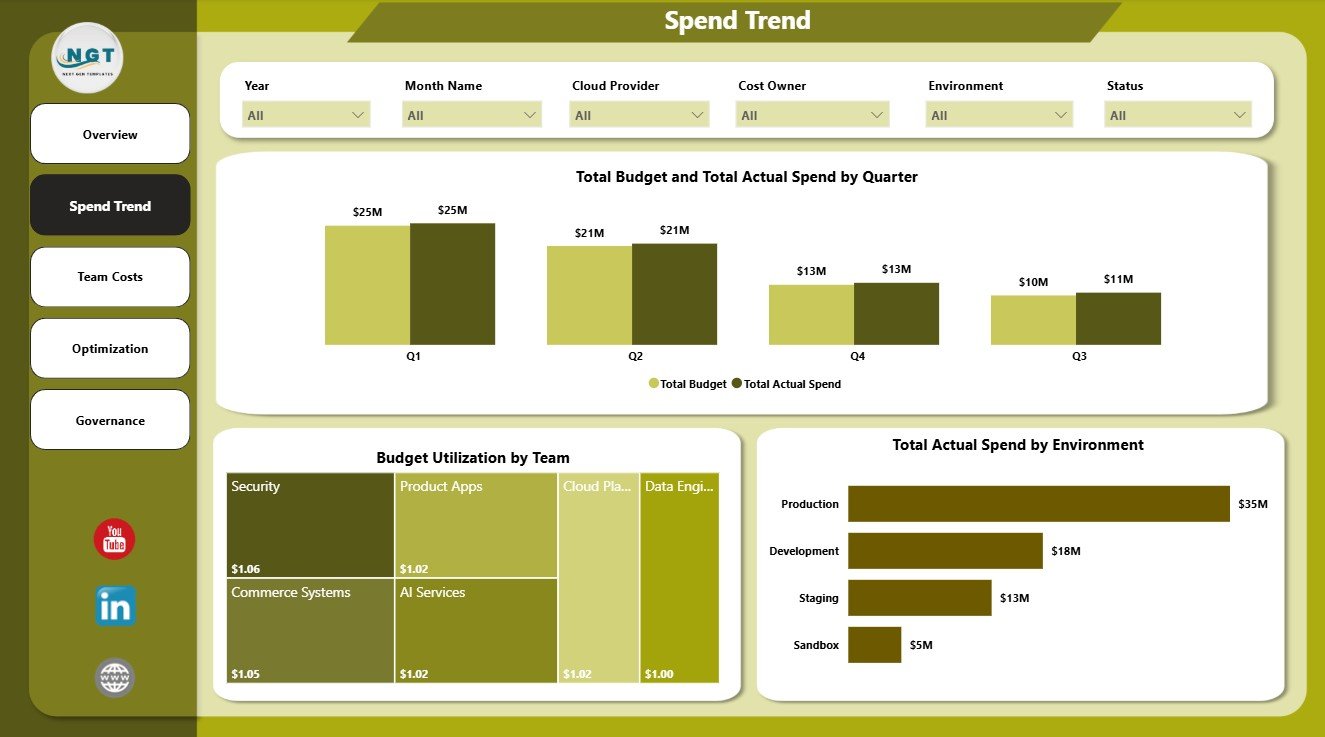
2. Spend Trend
The Spend Trend page focuses on time, budget, and environment performance. It includes Total Budget and Total Actual Spend by Quarter, Budget Utilization by Team, and Total Actual Spend by Environment.
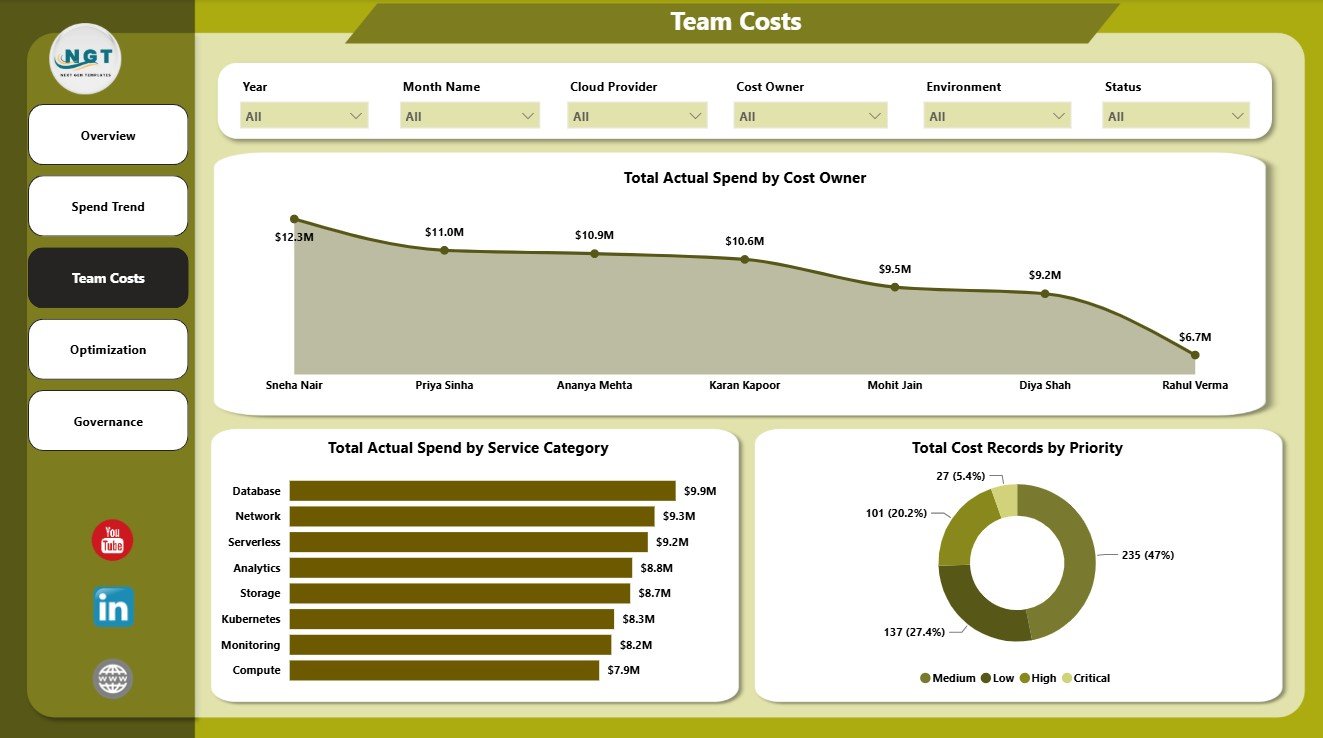
3. Team Costs
The Team Costs page helps connect cloud spend to owners and operating priorities. It includes Total Actual Spend by Cost Owner, Total Actual Spend by Service Category, and Total Cost Records by Priority.
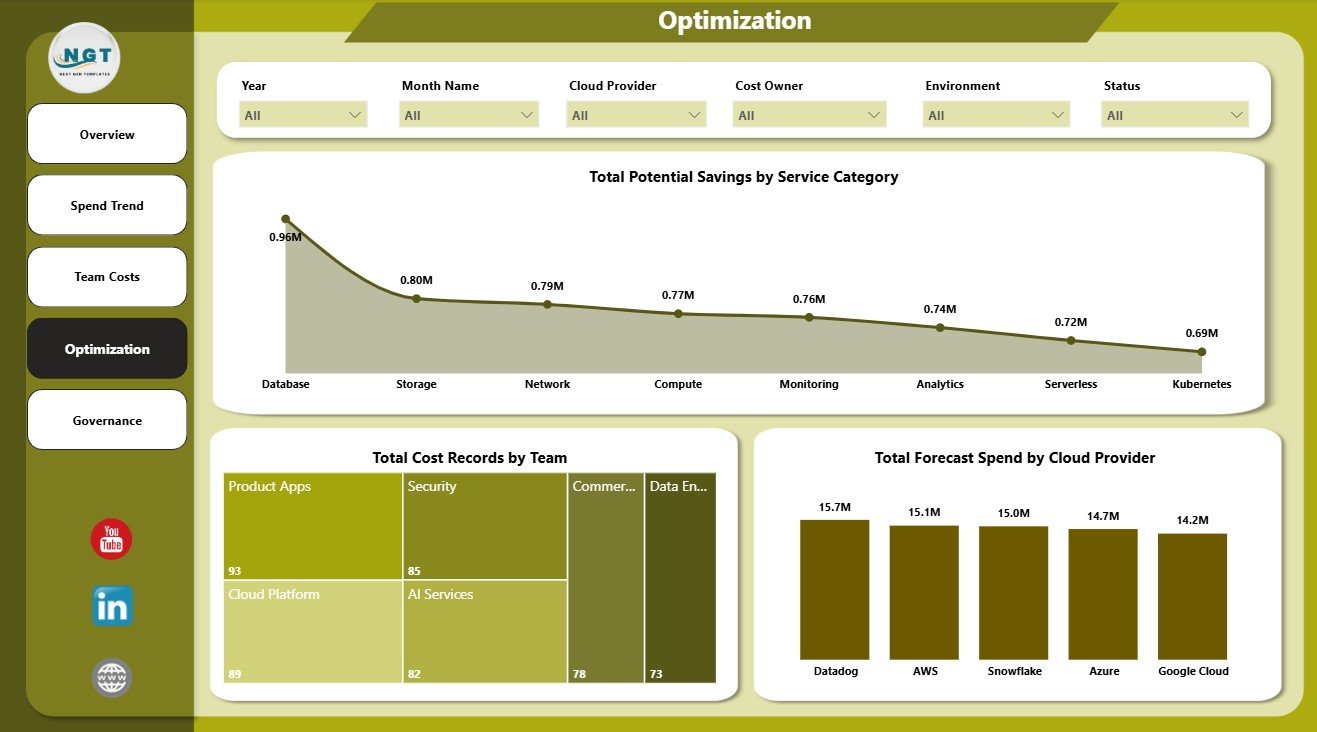
4. Optimization
The Optimization page highlights opportunities to reduce waste and improve cloud cost efficiency. It includes Total Potential Savings by Service Category, Total Cost Records by Team, and Total Forecast Spend by Cloud Provider.
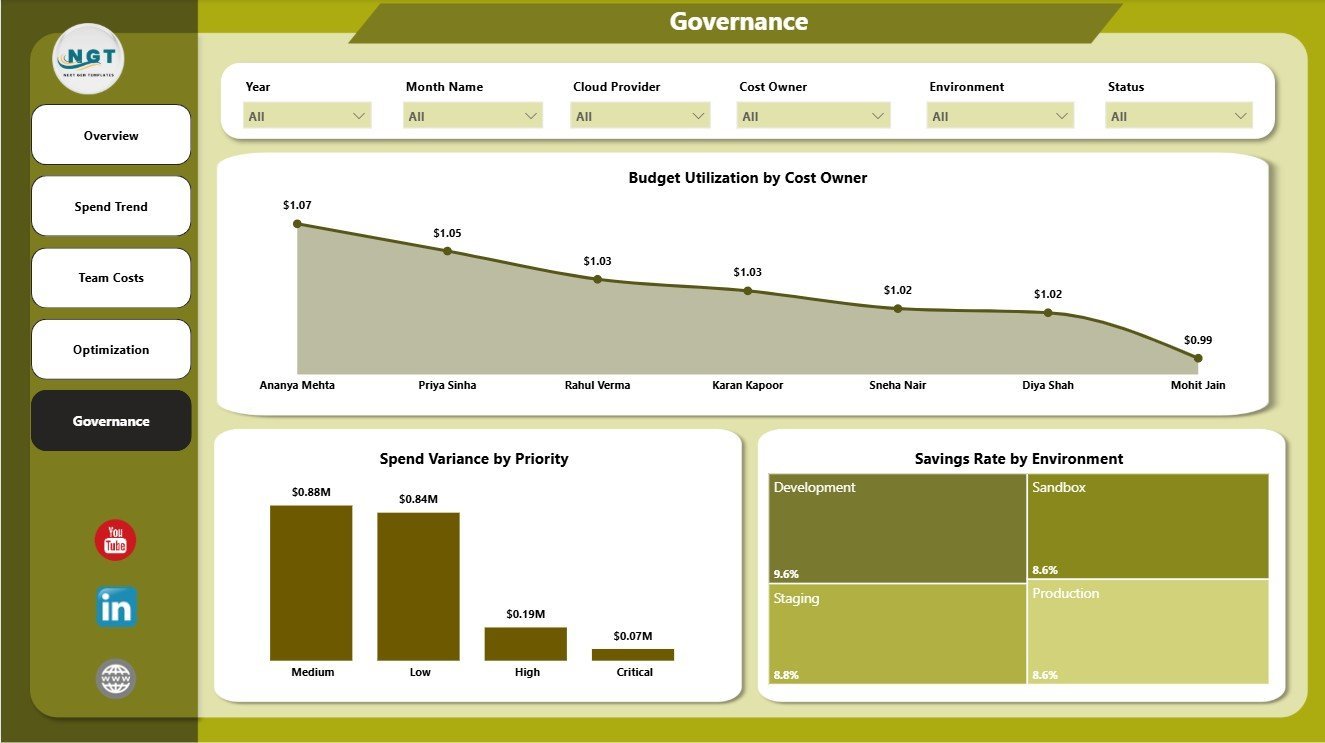
5. Governance
The Governance page supports cost control, variance review, and accountability. It includes Budget Utilization by Cost Owner, Spend Variance by Priority, and Savings Rate by Environment.

FinOps Teams Dashboard in Power BI vs. Tableau vs. Paid Cloud Cost SaaS – Where This Fits
| Feature | This Power BI Dashboard | Tableau Alternative | Paid Cloud Cost SaaS |
|---|---|---|---|
| Cost | $17.99 one-time | License plus dashboard build time | Monthly or annual subscription |
| Platform | Power BI Desktop and Power BI Service | Tableau Desktop or Cloud | Vendor cloud platform |
| Setup time | Open .pbix, connect or replace data, refresh | Build or adapt workbook | Requires onboarding and integrations |
| Real-time team collaboration | Available after publishing to Power BI Service | Available through Tableau Cloud | Usually included by plan |
| Mobile access | Available after Power BI publishing | Available after publishing | Usually included |
| Customizable fields | Editable model, visuals, measures, and filters | Editable if you own the workbook | Limited by vendor configuration |
| Share with link | Available through Power BI Service | Available through Tableau Cloud | Login controlled |
| Year-1 cost at 5 users | $17.99 plus any Microsoft licensing | Usually much higher | Often hundreds or thousands |
| FinOps page structure | 5 ready report pages included | Requires custom dashboard design | Depends on product tier and integrations |
Who This Template Is For – and Who It’s Not For
This template is for FinOps practitioners, cloud finance analysts, engineering managers, IT operations teams, platform teams, cost governance leads, and CFO office users who need recurring visibility into cloud spend, budgets, forecasts, owners, teams, savings, environments, priorities, statuses, and providers.
It is not a live AWS, Azure, or Google Cloud billing connector, anomaly detection engine, rightsizing automation system, approval workflow, or replacement for native cloud cost management tools. It works best when your cloud cost records can be exported or connected to Power BI in a clean table structure.
How to Use the FinOps Teams Dashboard in Power BI
- Download and unzip the dashboard package.
- Open the .pbix file in Power BI Desktop.
- Review the sample data fields and included report pages.
- Replace or connect your own FinOps cost dataset.
- Refresh the report and validate KPI cards, slicers, and visuals.
- Use slicers to review teams, owners, environments, services, statuses, priorities, cloud providers, and periods.
- Publish to Power BI Service if you want controlled sharing, scheduled refresh, or mobile viewing.
Real-World Use Cases
Priya, FinOps Lead: Priya uses the Overview and Optimization pages before monthly cloud cost reviews to identify savings opportunities and open cost records.
Marcus, Engineering Manager: Marcus filters Team Costs by his department to understand actual spend, service category usage, and priority-level cost records.
Ana, Finance Analyst: Ana uses Spend Trend and Governance to compare budget utilization, variance, forecast movement, and owner accountability.
Frequently Asked Questions
What pages are included?
The report includes Overview, Spend Trend, Team Costs, Optimization, and Governance pages.
What KPI cards are shown on the Overview page?
The Overview page shows Total Potential Savings, Total Cost Records, Spend Variance, Budget Utilization, Total Actual Spend, and Savings Rate.
Do I need Power BI Desktop?
Yes. Power BI Desktop is used to open, refresh, edit, and customize the .pbix file.
Can I use AWS, Azure, or Google Cloud data?
Yes. You can use exported or connected cloud cost data as long as it matches the required table structure.
Can I customize the dashboard?
Yes. You can edit visuals, measures, labels, colors, data fields, filters, and pages in Power BI Desktop.
Does this replace FinOps software?
No. It is a reporting dashboard for analysis and review, not a live billing platform or automation engine.
About the Author
Built by PK – Microsoft Certified Professional with 15+ years of Excel, Google Sheets, and Power BI experience. Founder of NextGenTemplates, reaching 300K+ subscribers across YouTube channels. Every template is hand-built and tested before release.
Explore Related Templates
- FinOps Teams Dashboard in Excel
- Fertilizer Manufacturing Dashboard in Power BI
- Consultant’s Toolkit – Excel and Power BI dashboard bundle
- Browse Power BI Dashboard Templates
- Browse Power BI Templates
Download the FinOps Teams Dashboard in Power BI and turn cloud cost records into a clear Power BI dashboard for spend, savings, budget, and governance review.
Last updated: June 13, 2026.


Reviews
There are no reviews yet.