

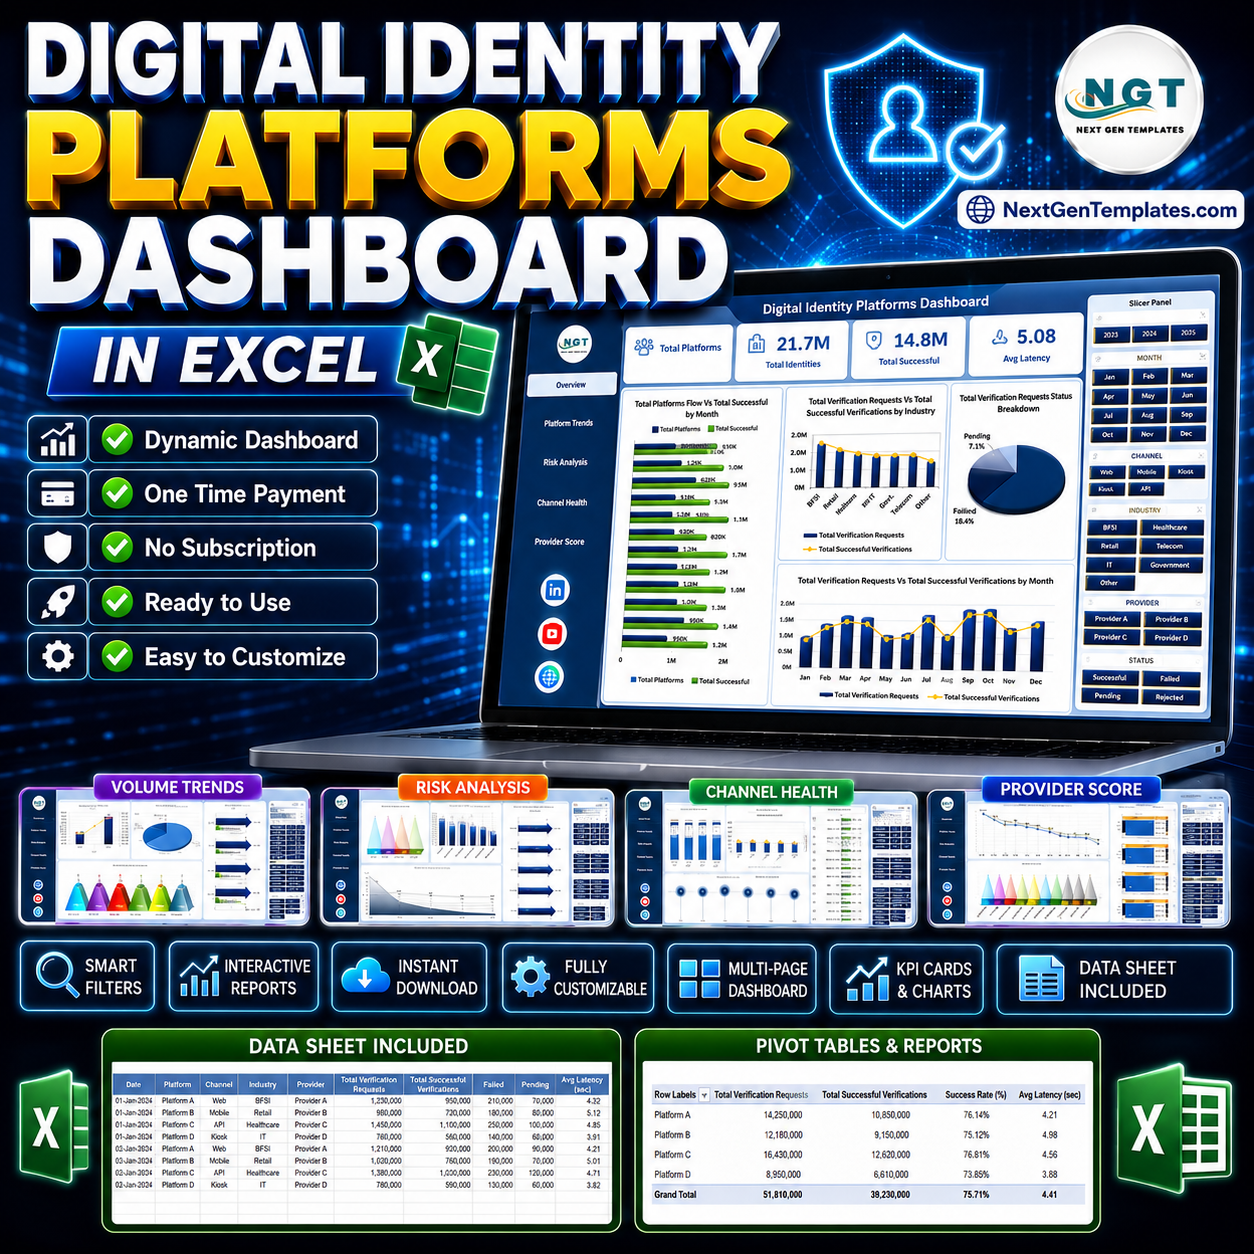



Digital Identity Platforms Dashboard in Excel gives identity, compliance, fintech, SaaS, and operations teams a ready-to-use reporting workbook for monitoring verification volume, success rate, fraud risk, latency, platform fees, costs, and gross profit. Instead of paying a BI consultant or exporting disconnected reports from every identity provider, this $17.99 Excel dashboard organizes the core metrics across 5 dashboard pages, a structured Data tab, and a Support sheet powered by pivot tables. Replace the sample records, refresh the workbook, and review filtered identity verification performance in minutes.
Instant download. One-time payment. No subscription. Built for Microsoft Excel.
Key Features of Digital Identity Platforms Dashboard in Excel
- 5 interactive dashboard pages covering Overview, Volume Trends, Risk Analysis, Channel Health, and Provider Score.
- 5 executive KPI cards for Total Platform Fees, Total Gross Profit, Total Verification, Total Successful, and Avg. Latency.
- 23 analysis views across verification volume, success, cost, profit, provider, region, risk tier, status, channel, and industry.
- Multiple slicers to filter the workbook quickly by the dimensions built into the data model.
- Provider profitability analysis for comparing platform fees, cost, gross profit, fraud flag rate, and success rate.
- Risk and manual review monitoring for reviewing fraud flags, identity risk, failed verifications, and manual review workload.
What’s Inside the Digital Identity Platforms Dashboard in Excel
1. Overview Page
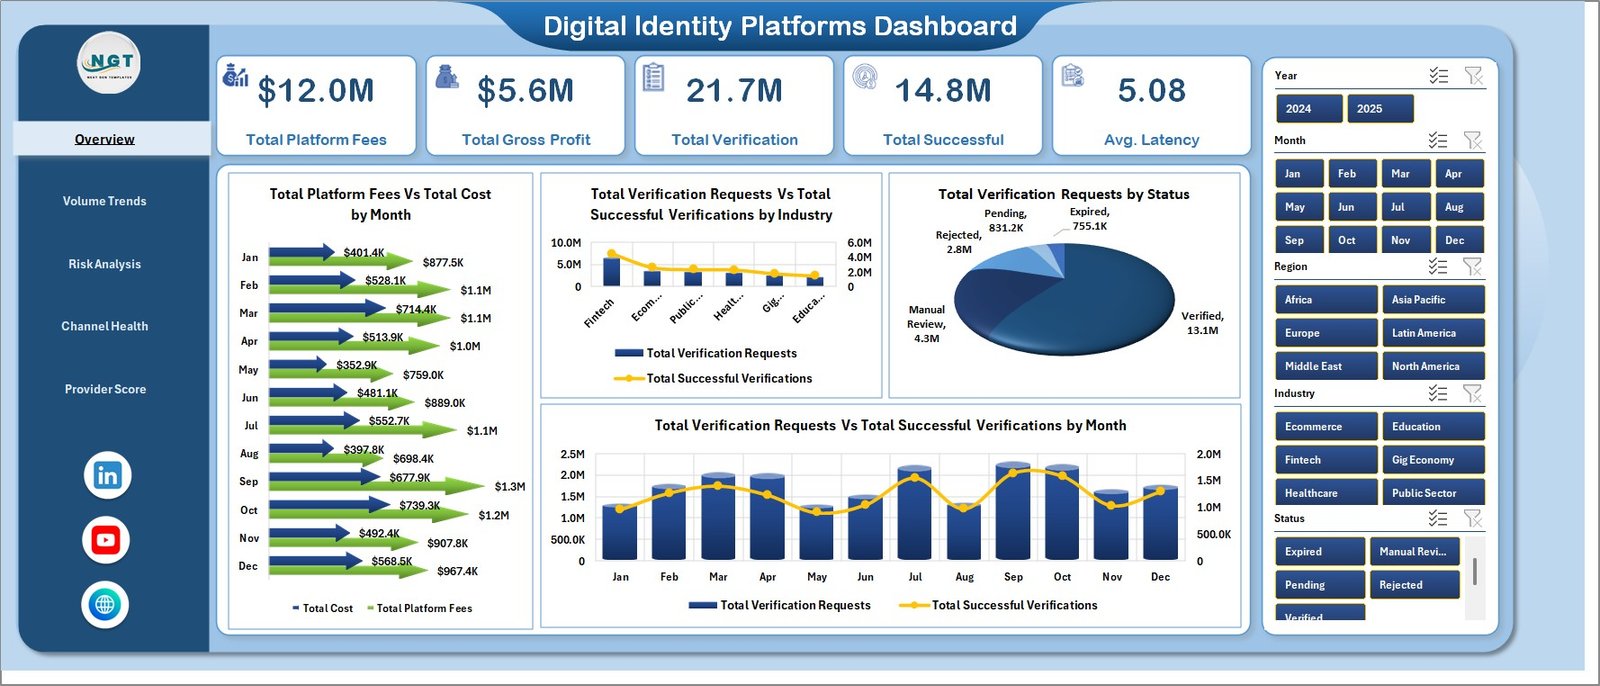
The Overview page is the leadership snapshot for the whole identity verification workflow. The top KPI cards show Total Platform Fees, Total Gross Profit, Total Verification, Total Successful, and Avg. Latency so teams can quickly see commercial performance, operating volume, and service speed.
Total Platform Fees by Month shows how identity platform fees move over time. Total Cost by Month helps finance and operations teams compare spend against fee income. Total Verification Requests by Industry and Total Successful Verifications by Industry help teams see which customer segments drive demand and successful outcomes. Total Verification Requests by Status, Total Verification Requests by Month, and Total Successful Verifications by Month help teams monitor workload and monthly quality trends.
2. Volume Trends
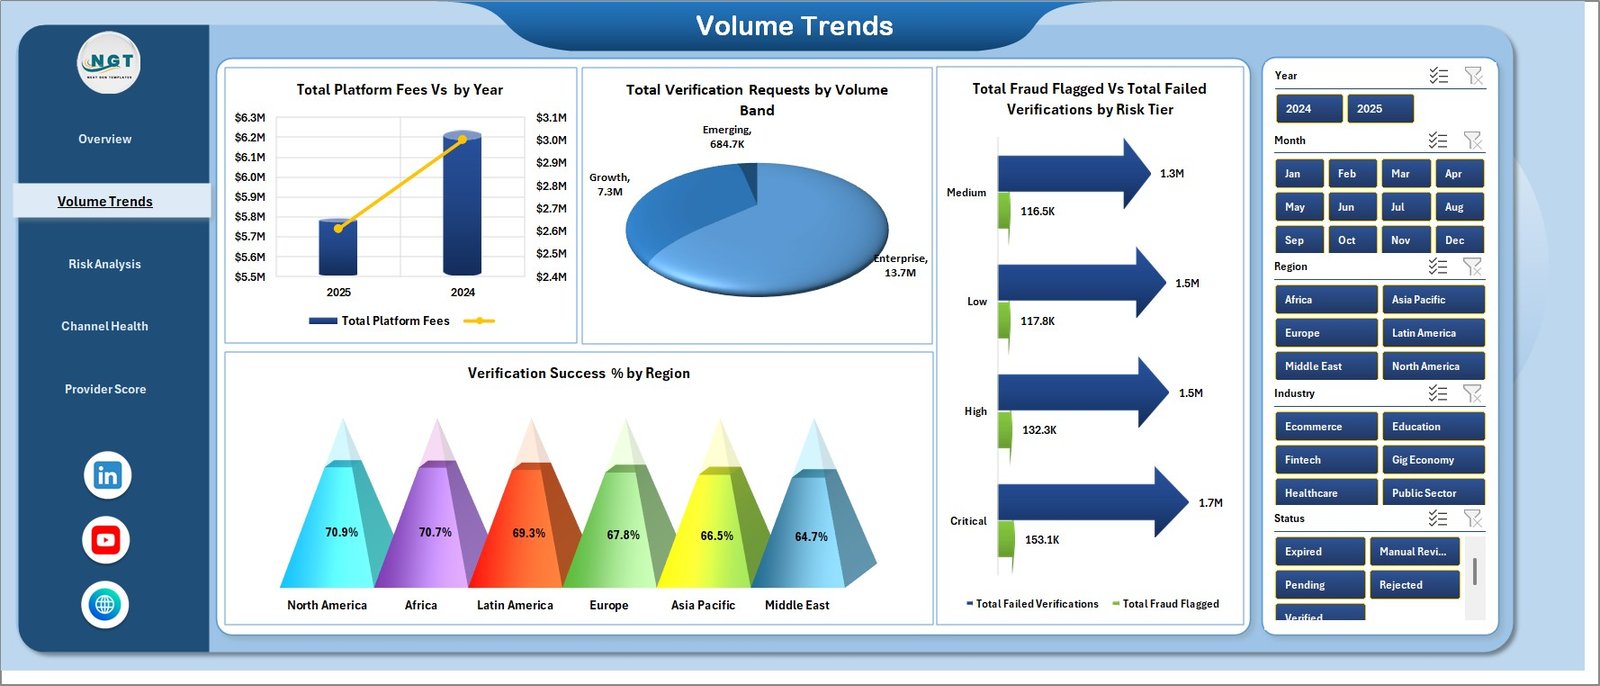
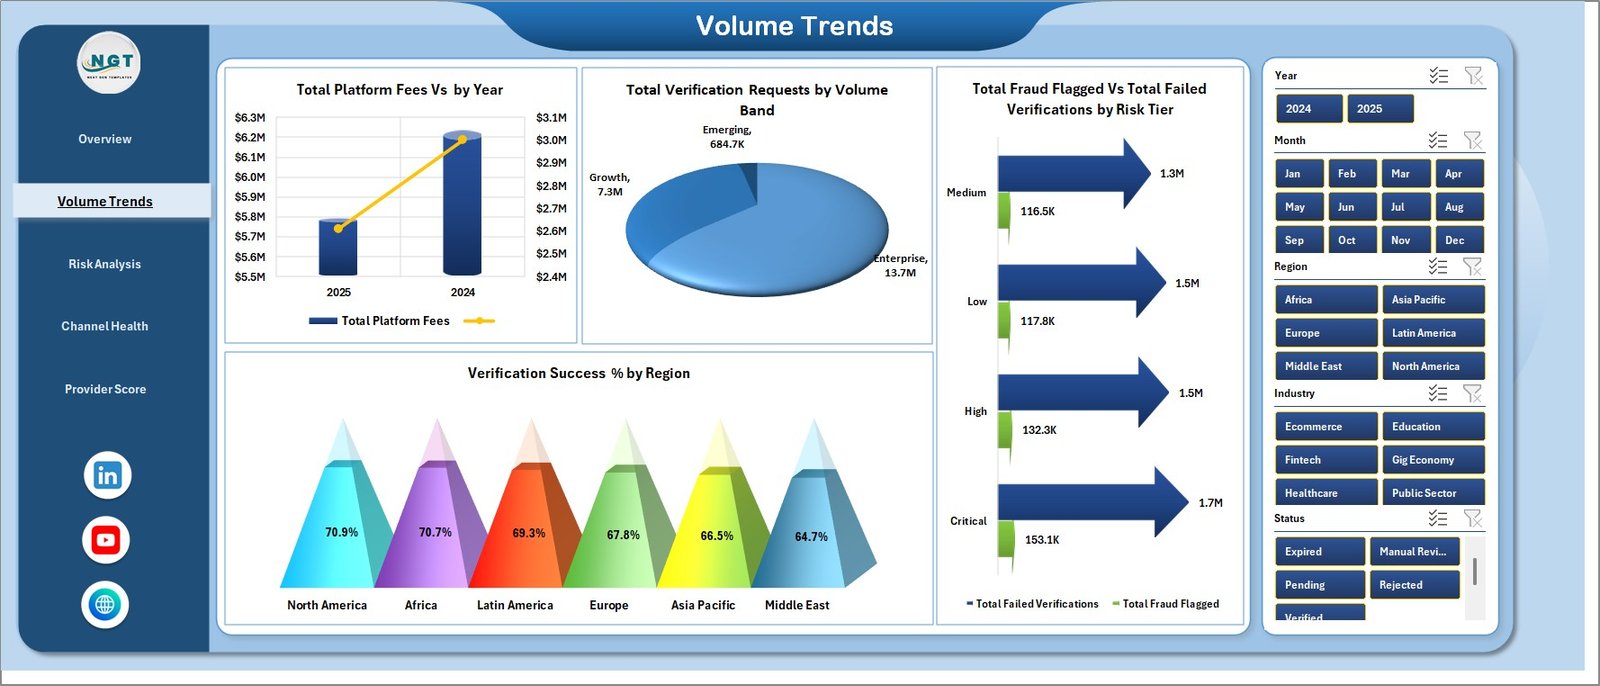
The Volume Trends tab focuses on growth and scale. Total Platform Fees by Year shows long-term fee movement, while Total Verification Requests by Volume Band helps teams understand whether activity is concentrated in small, medium, or high-volume customer groups. Total Fraud Flagged by Risk Tier and Total Failed Verifications by Risk Tier connect volume with risk severity. Verification Success % by Region shows where identity checks are performing well and where local process, document, or provider issues may be affecting outcomes.
3. Risk Analysis
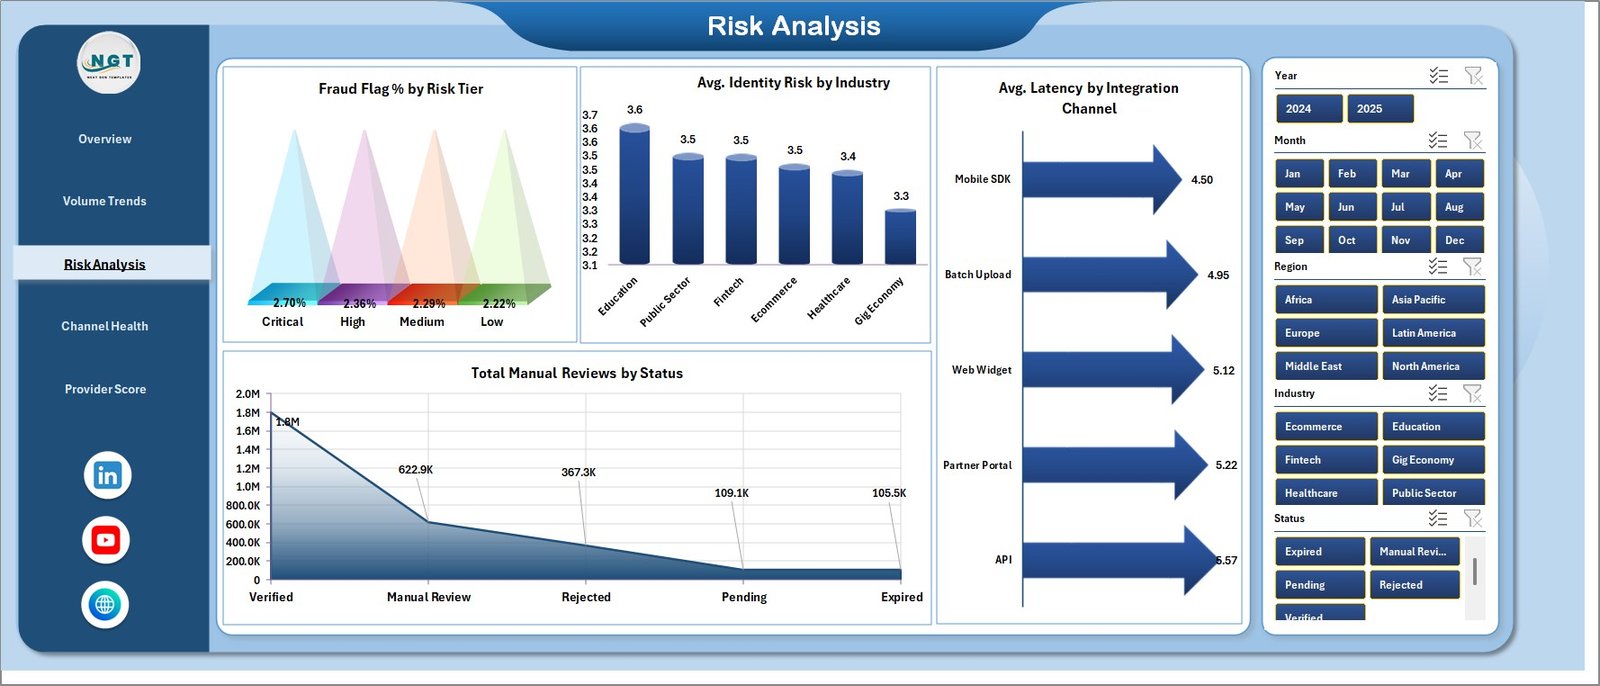
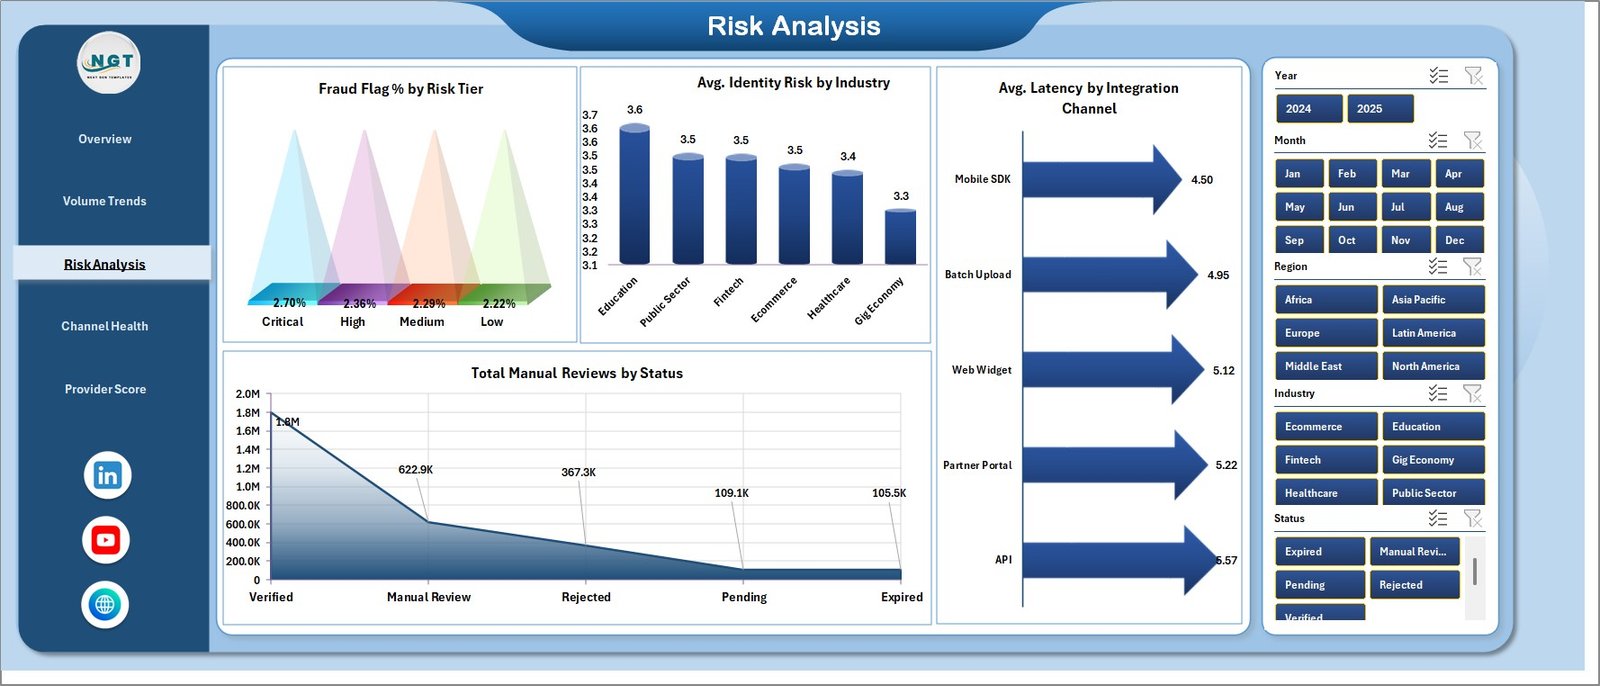
The Risk Analysis page helps compliance and trust teams inspect the quality of verification traffic. Fraud Flag % by Risk Tier shows where suspicious activity is concentrated, while Avg. Identity Risk by Industry helps compare industry-level identity risk exposure. Avg. Latency by Integration Channel shows which integration paths respond fastest or slowest. Total Manual Reviews by Status helps supervisors monitor review workload.
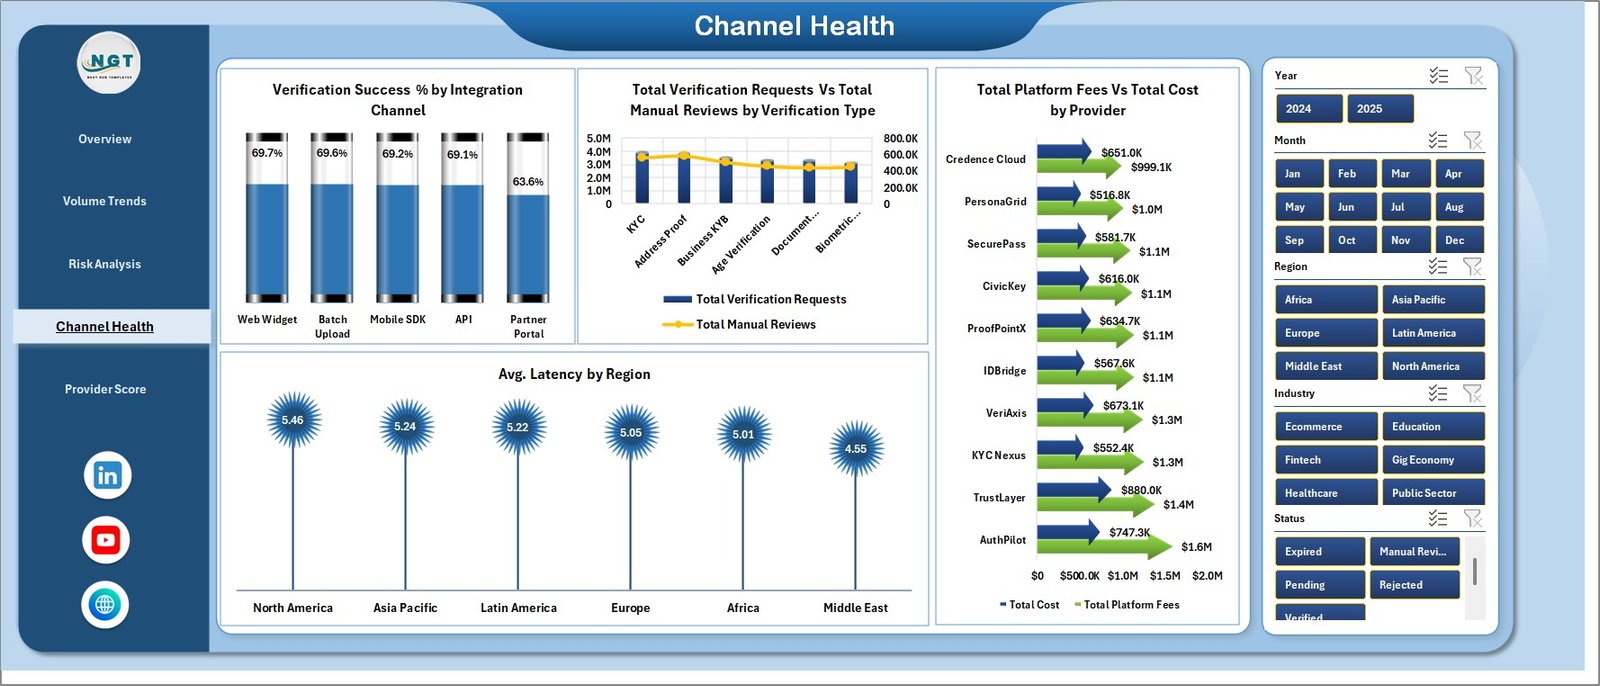
4. Channel Health
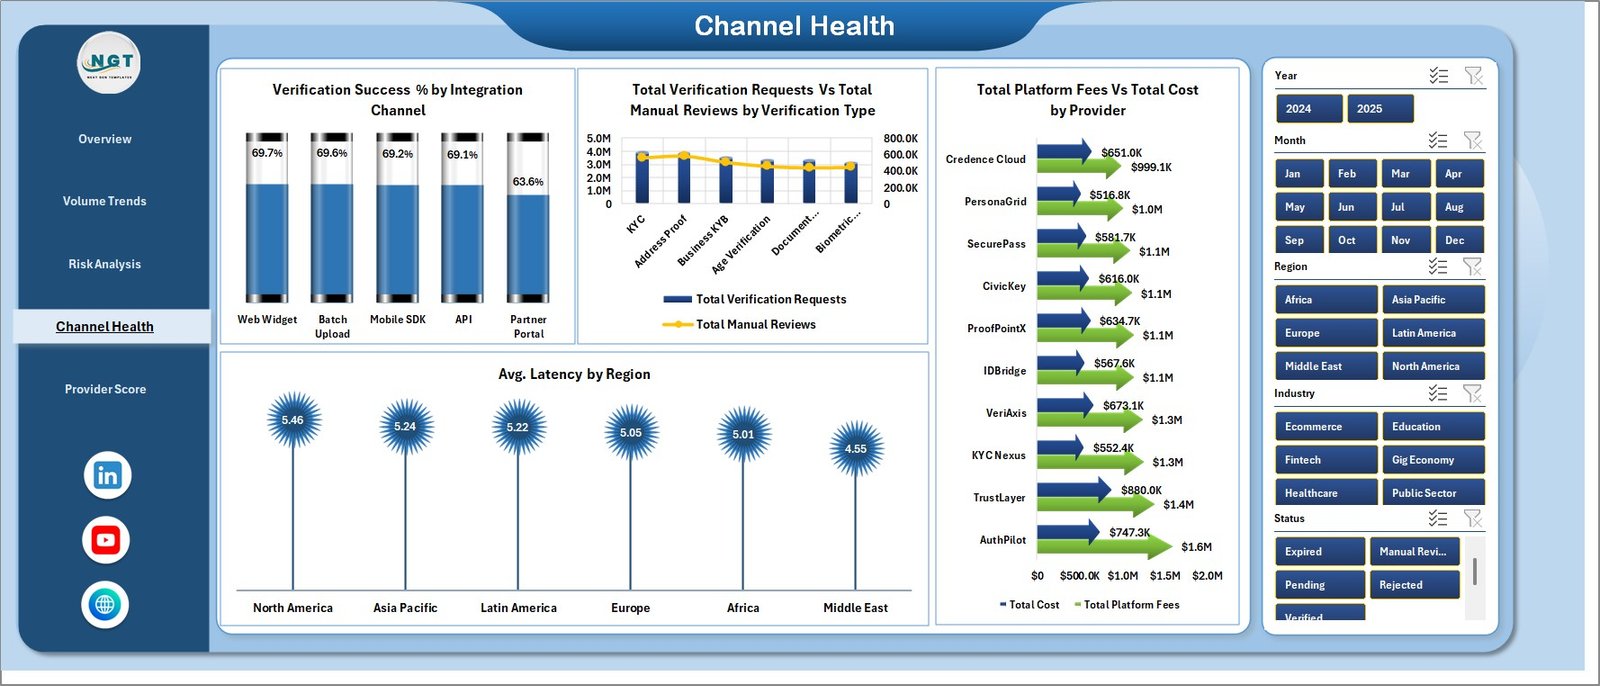
The Channel Health tab compares verification performance across channels, verification types, providers, and regions. Verification Success % by Integration Channel shows which channel is converting checks successfully, while Total Verification Requests by Verification Type reveals where demand is coming from. Total Manual Reviews by Verification Type highlights review-heavy processes. Avg. Latency by Region helps identify slow locations, and Total Platform Fees by Provider plus Total Cost by Provider gives a vendor-level cost view.
5. Provider Score
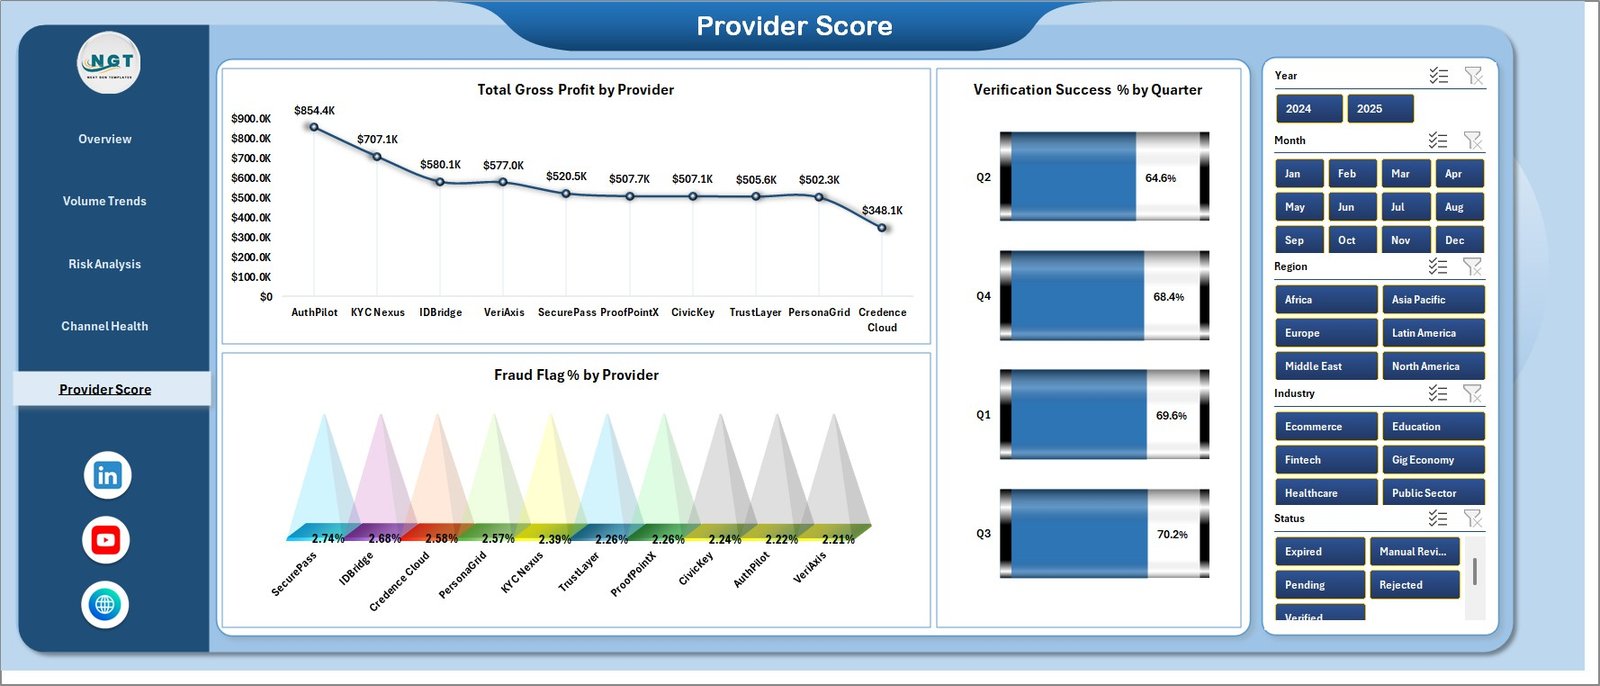
The Provider Score page is built for vendor comparison. Total Gross Profit by Provider shows which providers contribute the strongest commercial return after cost, while Fraud Flag % by Provider highlights quality and risk differences across vendors. Verification Success % by Quarter adds a time-based provider quality view.
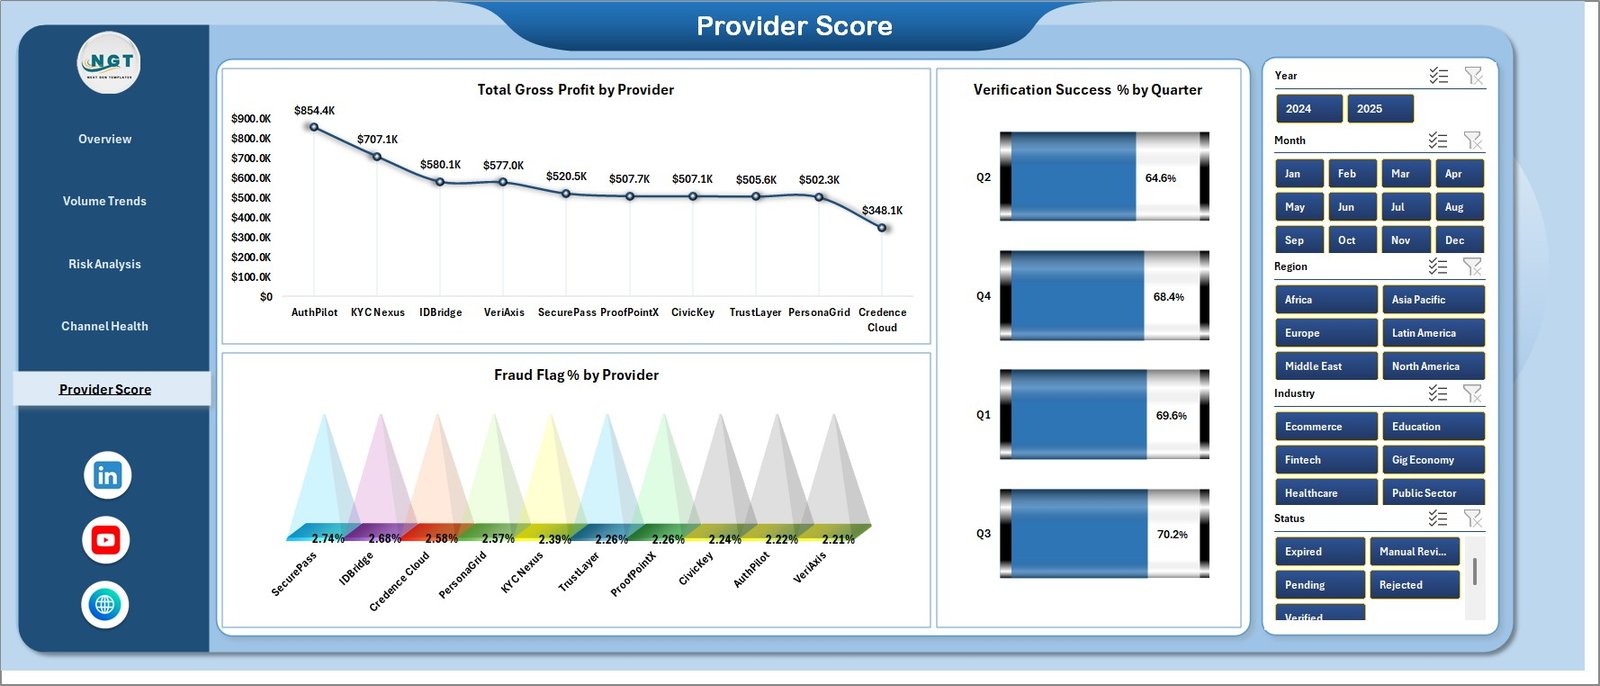
6. Data Sheet Tab
The Data sheet is where you add or replace the underlying identity verification records in the same column format as the sample file. Once your data is updated, the dashboard can refresh from the workbook’s pivot structure.

7. Support Sheet Tab
The Support sheet contains the pivot tables that drive the dashboard pages. After updating the Data sheet, go to the Data tab in the Excel Ribbon and click Refresh All. The pivots and charts refresh together, and you can keep this sheet hidden during normal use.

Digital Identity Platforms Dashboard in Excel vs. Google Sheets vs. Paid CRM/SaaS – Where This Fits
| Feature | This Excel dashboard | Google Sheets alternative | Paid identity/SaaS reporting |
|---|---|---|---|
| Cost | $17.99 one-time | One-time or shared sheet build | Monthly platform or BI subscription |
| Platform | Microsoft Excel desktop | Browser-based spreadsheet | Vendor-hosted software |
| Setup time | Under 10 minutes after data replacement | Depends on sheet and permissions | Often requires onboarding or data integration |
| Provider cost analysis | Built in | Possible with custom formulas | Depends on vendor reporting plan |
| Customizable fields | Fully editable workbook | Editable if shared permissions allow | Usually limited by vendor schema |
| Year-1 cost at 5 users | $17.99 plus Excel you already use | Low if self-managed | Can reach hundreds or thousands per year |
Who This Template Is For – and Who It’s Not For
This template is for digital identity providers, fintech operations teams, compliance analysts, onboarding teams, marketplace operators, trust and safety managers, and SaaS teams that export verification data and need a clear Excel reporting layer. It is not a live identity verification engine, fraud detection API, customer onboarding workflow, or automated KYC/AML decision system.
How to Use the Digital Identity Platforms Dashboard in Excel
- Download and unzip the product file after purchase.
- Open the workbook in Microsoft Excel.
- Review the sample Data sheet to understand the required structure.
- Replace the sample rows with your own verification records.
- Go to the Data tab in the Excel Ribbon and click Refresh All.
- Use slicers to review provider, region, channel, risk, and status performance.
Real-World Use Cases
Aisha, fintech operations lead: She uses the Overview and Risk Analysis pages before weekly onboarding reviews to compare successful verifications, failed checks, fraud flags, and manual review volume.
Daniel, identity product manager: He reviews Provider Score each month to compare gross profit, fraud flag rate, and success percentage by provider before contract discussions.
Meera, compliance analyst: She refreshes exported verification records and uses slicers to prepare region and risk-tier summaries for compliance meetings.
Frequently Asked Questions
What does this dashboard track?
It tracks platform fees, cost, gross profit, verification requests, successful verifications, failed verifications, fraud flags, manual reviews, latency, provider performance, region, industry, status, risk tier, channel, and verification type.
Do I need advanced Excel skills?
No. You only need to replace the sample records in the Data sheet and refresh the workbook. The charts and KPI cards are already built.
Does this connect live to an identity API?
No live API connector is included. The workbook is designed for exported or manually maintained verification data.
Can I customize the charts?
Yes. Because it is an Excel workbook, you can edit chart colors, field names, calculations, slicers, and sheet layout.
Is this a one-time purchase?
Yes. This is a one-time downloadable template from NextGenTemplates with no template subscription fee.
About the Author
Built by PK – Microsoft Certified Professional with 15+ years of Excel, Google Sheets, and Power BI experience. Founder of NextGenTemplates, reaching 300K+ subscribers across YouTube channels. Every template is hand-built and tested before release.
Explore Related Templates
- E-Learning Apps Dashboard in Excel – platform analytics for education technology teams.
- Content Personalization Startups Dashboard in Power BI – startup and campaign reporting in Power BI.
- Healthcare IT Cybersecurity Calendar in Excel – IT security scheduling and compliance planning.
- Browse Excel Dashboard templates.
- Browse IT Excel templates.
Click here to read the detailed blog post
Ready to turn digital identity verification data into a clear Excel reporting workflow? Download the Digital Identity Platforms Dashboard in Excel and start reviewing verification volume, provider performance, risk, and profit in one workbook.
Last updated: June 2026
Watch the step-by-step video tutorial:
Compatibility and Requirements
- Works in Microsoft Excel desktop (Excel 2016 or later, or Microsoft 365).
- The dashboard pages are driven by pivot tables on the Support sheet and filtered with slicers. Microsoft explains slicers in Use slicers to filter data.
Related Templates
- Digital Identity Platforms Dashboard in Power BI: the same topic as a Power BI report
- Digital Streaming Platforms Dashboard in Excel: platform reporting for streaming services
- Digital Marketing Campaign Dashboard in Excel: campaign results in Excel





























Reviews
There are no reviews yet.