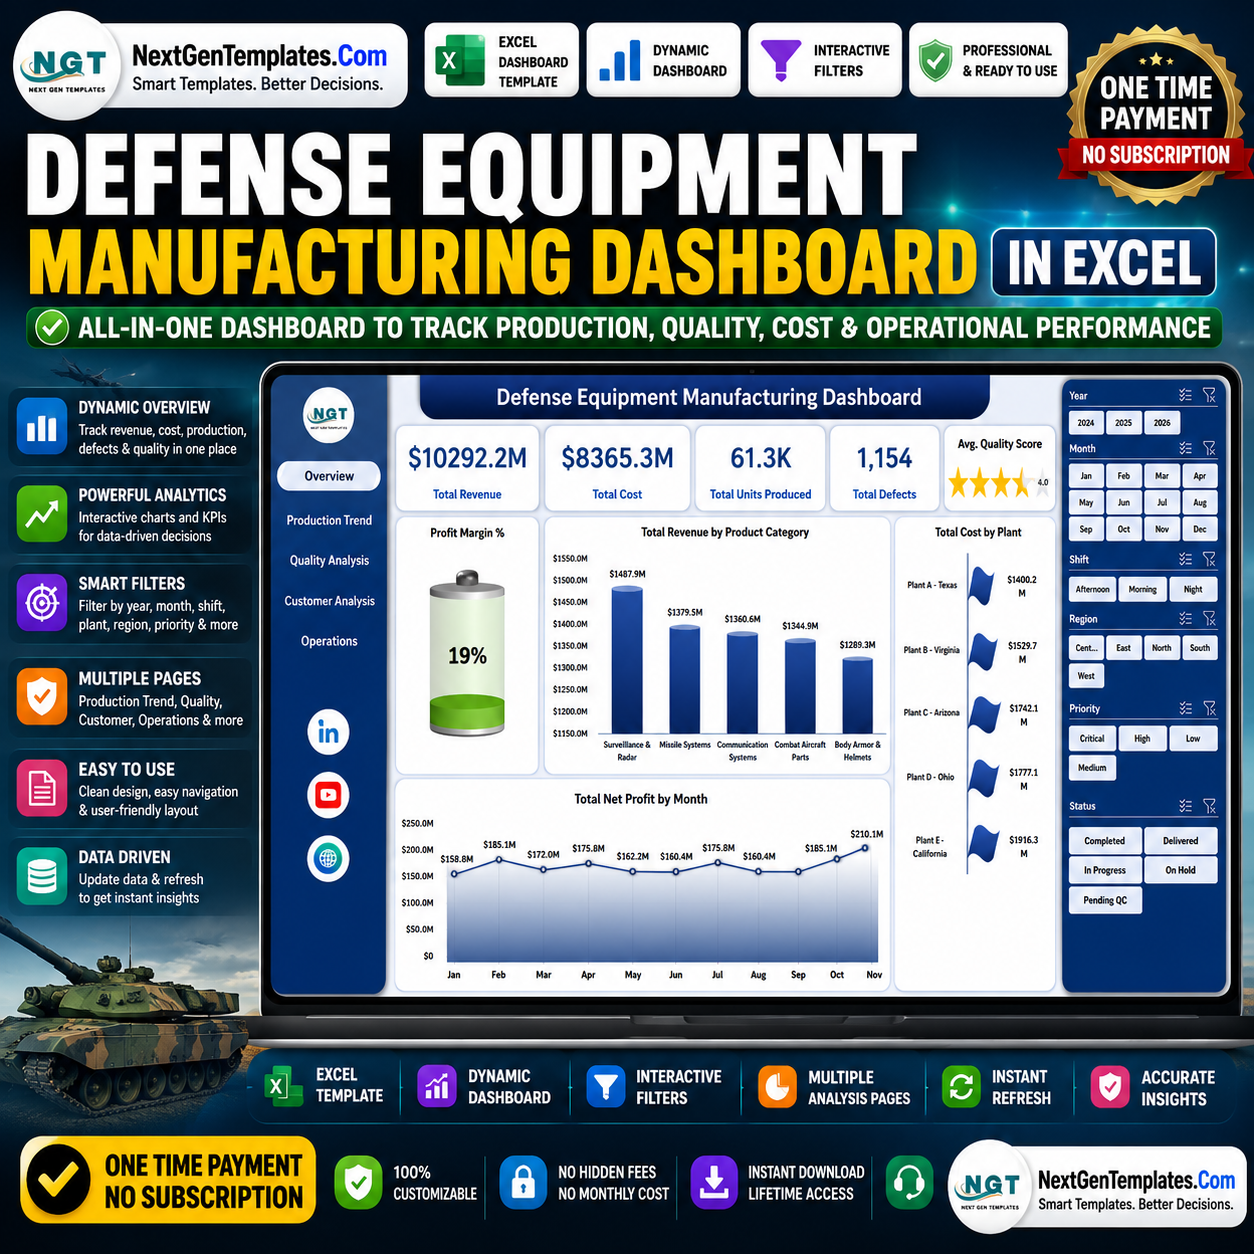

Defense Equipment Manufacturing Dashboard in Excel helps plant managers, defense contractors, quality teams, and operations analysts track 5 high-level KPIs, 5 analysis pages, 20+ manufacturing charts, slicers, a structured Data Sheet, and a pivot-powered Support Sheet in one editable workbook. Defense manufacturing teams deal with strict delivery schedules, quality checks, cost pressure, and contract visibility. Instead of building reports from scratch or paying for a dedicated analytics system, this Excel dashboard gives you a one-time-purchase reporting layer that can be updated by replacing the sample data and clicking Refresh All. Instant download, lifetime access, no subscription, and no per-user fees.
Key Features of Defense Equipment Manufacturing Dashboard in Excel
- 5 dashboard pages: Overview, Production Trend, Quality Analysis, Customer Analysis, and Operations.
- Executive KPI cards: Total Revenue, Total Cost, Total Units Produced, Total Defects, and Avg. Quality Score.
- 20+ built-in charts: Review revenue, cost, net profit, defect rate, downtime, lead time, production volume, and quality score.
- Multiple slicers: Filter quickly by manufacturing dimensions such as plant, product category, contract type, shift, region, status, and time period.
- Pivot-driven reporting: Update the Data Sheet, use Refresh All, and the dashboard pages refresh through the Support Sheet pivots.
- Editable Excel workbook: Customize headings, charts, slicers, fields, colors, and data columns to match your production reporting process.
What’s Inside the Defense Equipment Manufacturing Dashboard in Excel
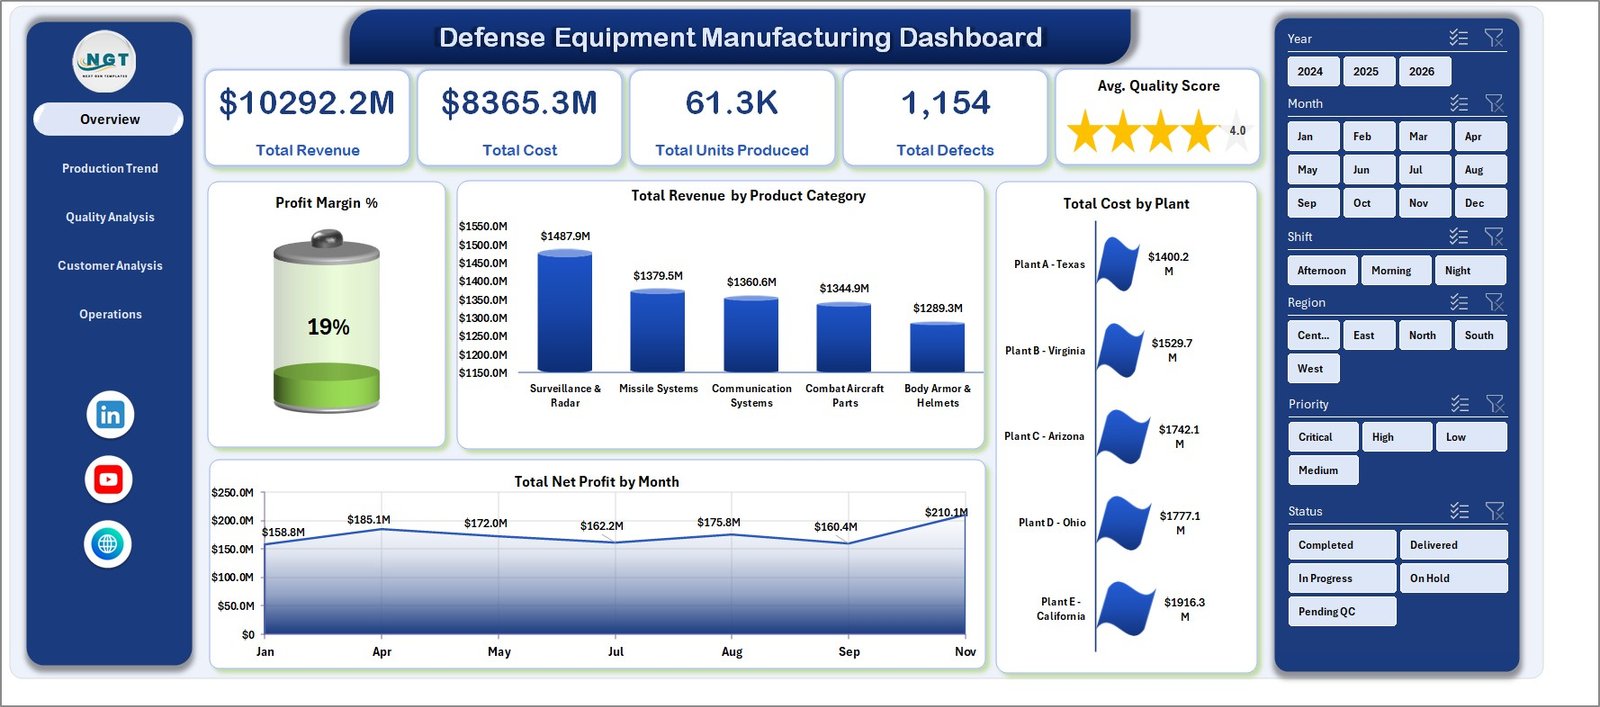
1. Overview Page
The Overview page gives leadership a fast view of production and financial performance. Cards summarize Total Revenue, Total Cost, Total Units Produced, Total Defects, and Avg. Quality Score.
Profit Margin % shows how effectively production activity turns revenue into profit. It is useful for spotting cost pressure before it becomes a larger contract issue.
Total Revenue by Product Category compares revenue across equipment lines. Use it to identify which product categories are driving the highest commercial value.
Total Cost by Plant highlights cost concentration by manufacturing location. This helps managers compare plant-level spending and investigate unusually high cost centers.
Total Net Profit by Month tracks monthly profit movement. It supports trend reviews, monthly operating reviews, and planning for upcoming production cycles.
Defense Equipment Manufacturing Dashboard in Excel
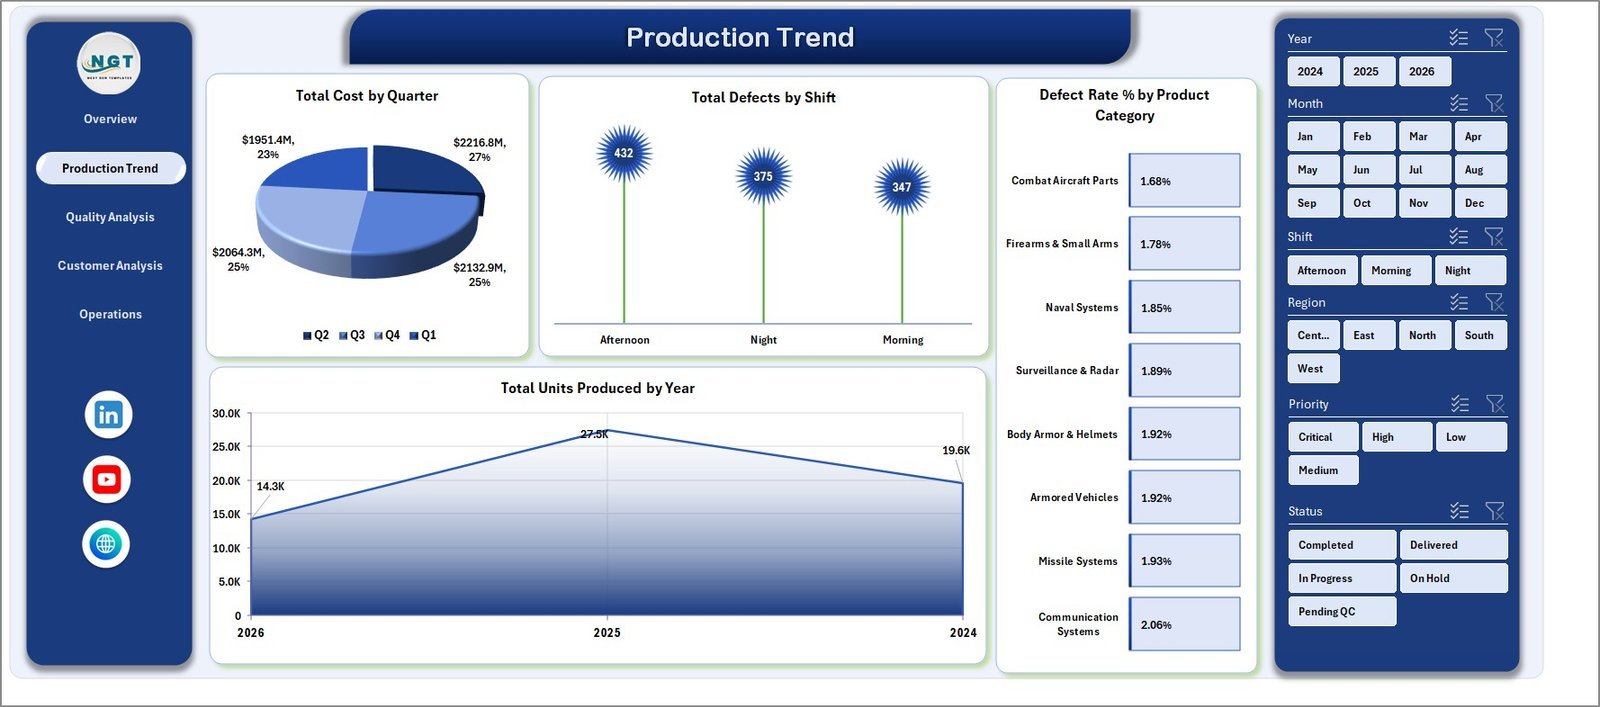
2. Production Trend
The Production Trend page explains cost, defects, defect rate, and production volume across quarters, shifts, product categories, and years.
Total Cost by Quarter shows how production cost changes across each quarter. It helps finance and operations teams review seasonal cost movement.
Total Defects by Shift compares defect counts by shift. Use it to identify training, staffing, or process control issues tied to specific working periods.
Defect Rate % by Product Category shows which equipment categories need more attention from quality teams. It is a quick way to prioritize corrective action.
Total Units Produced by Year summarizes annual production volume. This chart helps teams review capacity growth and long-term production output.

Production Trend
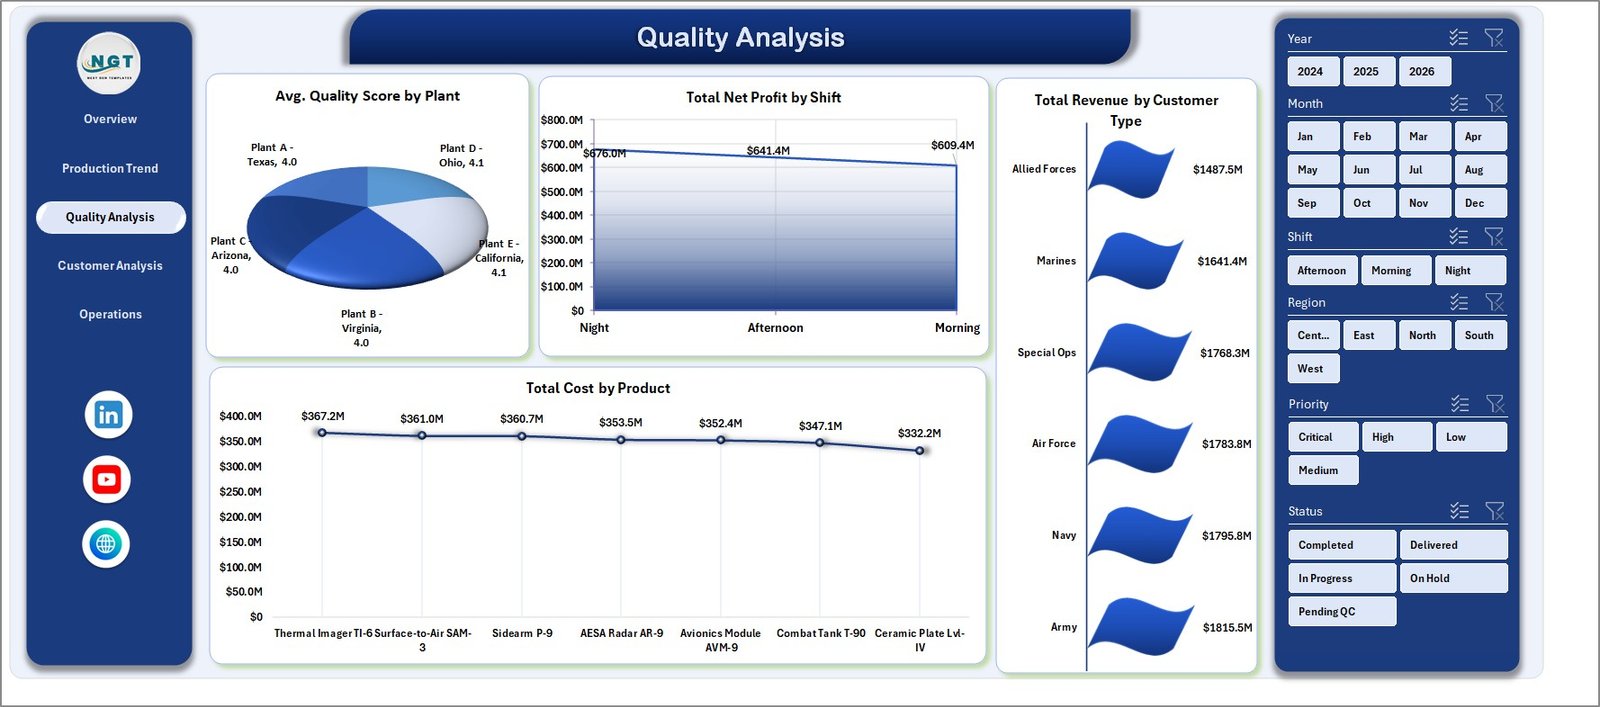
3. Quality Analysis
The Quality Analysis page connects quality score, profitability, revenue, and product cost to show whether production performance is profitable and controlled.
It includes Avg. Quality Score by Plant, Total Net Profit by Shift, Total Revenue by Customer Type, and Total Cost by Product.
Quality Analysis
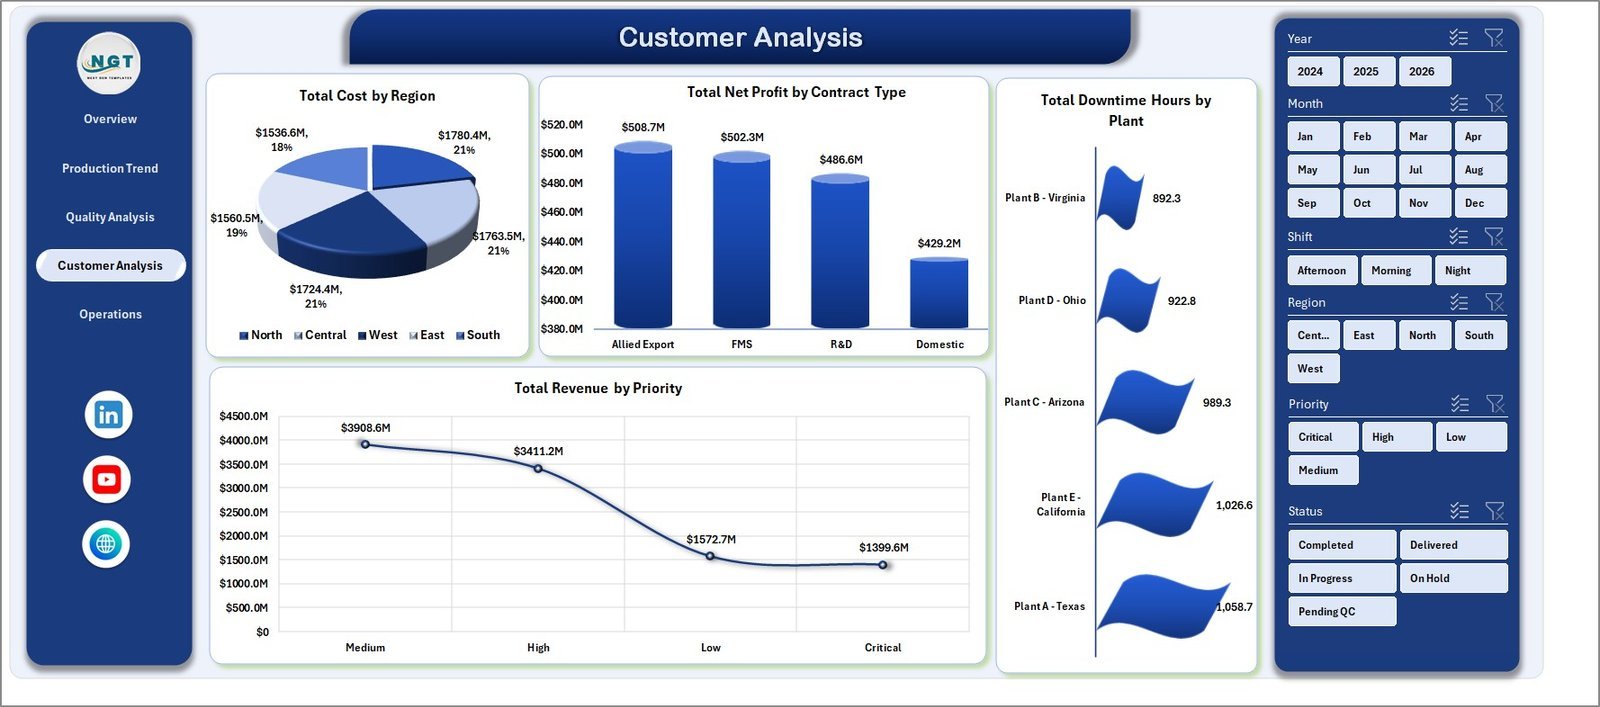
4. Customer Analysis
The Customer Analysis page reviews regional cost, contract profitability, downtime, and priority-based revenue. It is useful for contract reviews and customer-facing performance discussions.
It includes Total Cost by Region, Total Net Profit by Contract Type, Total Downtime Hours by Plant, and Total Revenue by Priority.

Customer Analysis
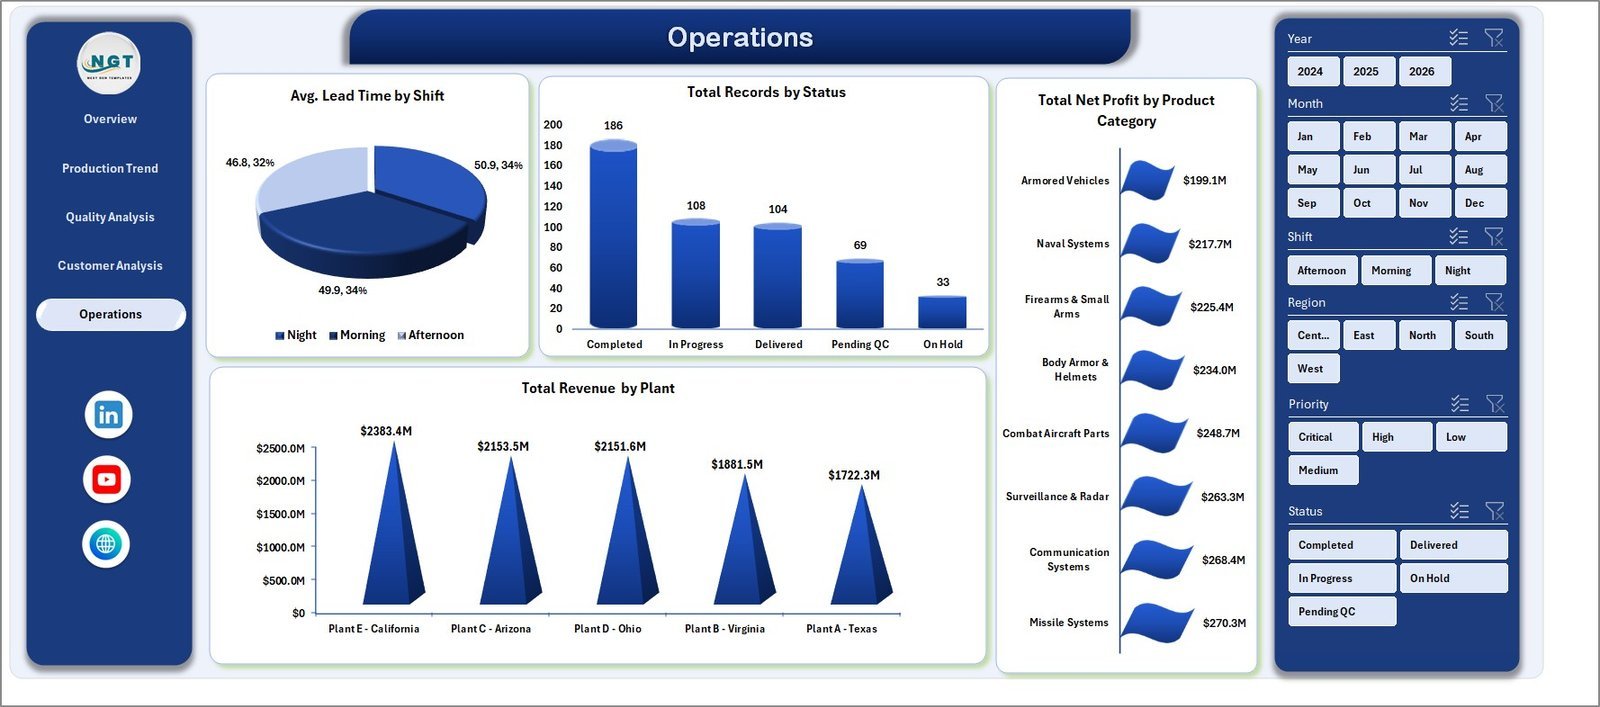
5. Operations
The Operations page gives managers a practical view of lead time, record status, profit by category, and revenue by plant.
It includes Avg. Lead Time by Shift, Total Records by Status, Total Net Profit by Product Category, and Total Revenue by Plant.

Operations
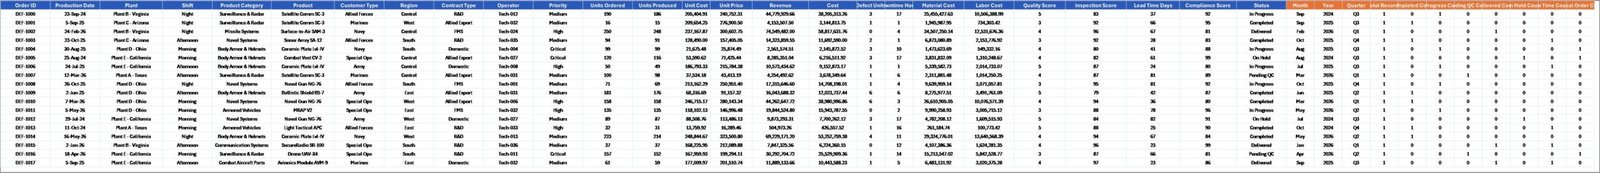
6. Data Sheet Tab
The Data Sheet is where you add or replace records in the same format. Keep the column structure consistent, then refresh the workbook to update all visuals.

Data Sheet tab
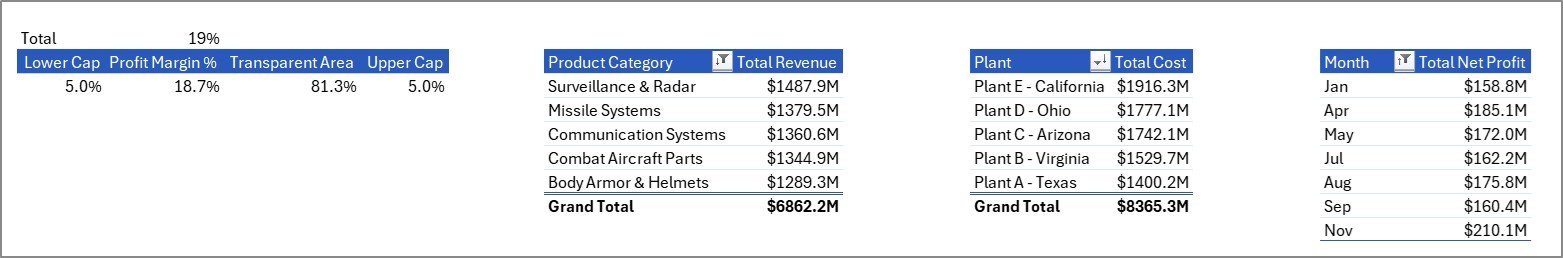
7. Support Sheet
The Support Sheet contains the pivot tables used to build the dashboard dynamically. After updating the Data Sheet, go to the Data tab in Excel and click Refresh All. You can keep this sheet hidden while sharing the dashboard.

Support sheet tab
Defense Equipment Manufacturing Dashboard in Excel vs. Google Sheets vs. Paid Manufacturing SaaS – Where This Fits
| Feature | This Excel Dashboard | Google Sheets Alternative | Paid Manufacturing SaaS |
|---|---|---|---|
| Cost | $17.99 one-time | Low cost, online dependent | Monthly or annual subscription |
| Platform | Microsoft Excel | Browser-based spreadsheet | Vendor cloud system |
| Setup time | Update data and refresh | Copy sheet and adjust formulas | Implementation project |
| Offline use | Yes | Limited | No |
| Custom fields | Fully editable workbook | Editable sheet | Depends on plan |
| Year-1 cost at 5 users | $17.99 total | Usually low | Often hundreds or thousands |
Who This Template Is For – and Who It’s Not For
This template is for defense equipment manufacturers, aerospace and defense suppliers, operations managers, quality assurance teams, production planners, contract analysts, and finance teams that need repeatable Excel reporting for production, cost, defects, downtime, revenue, and net profit.
It is not an ERP, MES, PLM, secure classified data system, or real-time shop-floor control platform. Use it for reporting and analysis after exporting or entering approved operational data.
How to Use the Defense Equipment Manufacturing Dashboard in Excel
- Download and unzip the file.
- Open the workbook in Microsoft Excel.
- Go to the Data Sheet and replace the sample data with your approved records.
- Keep the same column structure.
- Click Data, then Refresh All.
- Use slicers to review the dashboard by plant, shift, product category, region, contract type, status, and time period.
- Hide the Support Sheet before sharing the workbook with end users.
Real-World Use Cases
Arjun, Plant Manager: Arjun uses Total Cost by Plant, Total Units Produced by Year, and Avg. Lead Time by Shift to prepare weekly production reviews.
Meera, Quality Lead: Meera monitors Total Defects by Shift and Defect Rate % by Product Category to prioritize quality improvement actions.
Daniel, Contract Analyst: Daniel reviews Total Net Profit by Contract Type and Total Revenue by Priority before customer and program performance meetings.
Frequently Asked Questions
What KPIs are included?
The dashboard includes Total Revenue, Total Cost, Total Units Produced, Total Defects, and Avg. Quality Score.
Does this workbook require macros?
No. It is built with Excel tables, pivot tables, charts, and slicers.
Can I use my own plants, shifts, products, and contract types?
Yes. Replace the sample records in the Data Sheet and refresh the workbook.
Can the Support Sheet be hidden?
Yes. The Support Sheet stores pivot tables and can be hidden after setup.
Which Excel version should I use?
Use Microsoft Excel 2016 or later, including Microsoft 365, for best results.
Is this suitable for classified or export-controlled data?
The template is a reporting workbook. Only use data that your organization is authorized to store and analyze in Excel.
About the Author
Built by PK – Microsoft Certified Professional with 15+ years of Excel, Google Sheets, and Power BI experience. Founder of NextGenTemplates, reaching 300K+ subscribers across YouTube channels. Every template is hand-built and tested before release.
Explore Related Templates
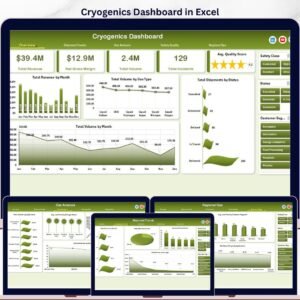
Explore more Excel Dashboard Templates and Manufacturing Excel Templates. Related products include Manufacturing Excellence Bundle, Cryogenics Dashboard in Excel, Manufacturing Production Variance Analysis Dashboard in Excel, and Quality Assurance Dashboard in Excel.
Ready to monitor defense manufacturing performance in Excel? Download the Defense Equipment Manufacturing Dashboard in Excel, update the Data Sheet, refresh the workbook, and start reviewing production, quality, cost, revenue, and operations today.
Watch the step-by-step video tutorial:


Reviews
There are no reviews yet.