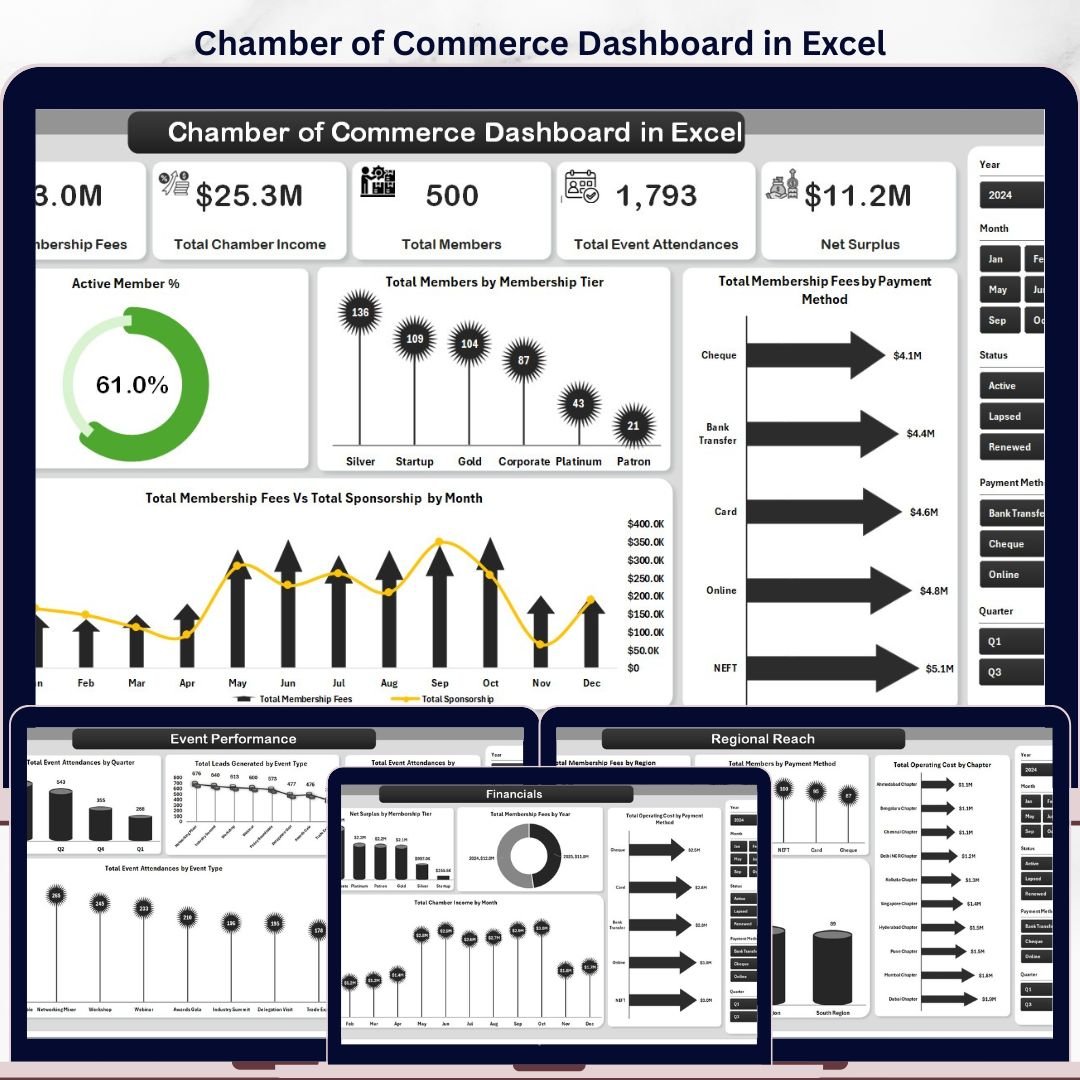
The Chamber of Commerce Dashboard in Excel tracks 5 high-level KPIs across 5 interactive pages, with 12+ pre-built charts and slicer-driven filters. Setup takes under 10 minutes — just replace the sample data in the Data sheet and click Refresh All. Every chart, KPI card, and analysis updates automatically via pivot tables.
🌍 Join 8,400+ teams in 40+ countries using NextGenTemplates to replace paid SaaS tools with one-time-purchase Excel, Google Sheets, Power BI, and HTML templates.
✅ Instant download · One-time payment · No subscription · No per-user fees · Lifetime access
🔑 Key Features of Chamber of Commerce Dashboard in Excel
🔹 5 Dedicated Analysis Pages — The Chamber of Commerce Dashboard in Excel covers Overview, Membership Mix, Event Performance, Regional Reach, and Financials in separate, focused tabs.
🔹 5 Top-Level KPI Cards — Track Total Membership Fees, Total Chamber Income, Total Members, Total Event Attendances, and Net Surplus directly on the Overview page.
🔹 12+ Pre-Built Charts — Including Active Member %, Total Members by Membership Tier, Total Membership Fees by Payment Method, Total Membership Fees vs Total Sponsorship by Month, Operating Cost by Tier, Avg. Engagement Score by Company Size, Members by Referral Source, Event Attendances by Quarter, Leads by Event Type, Fees by Region, Net Surplus by Tier, Chamber Income by Month, and more.
🔹 Interactive Slicers on Every Page — Apply filters by region, membership tier, chapter, event type, referral source, and payment method to instantly refresh the dashboard without any formulas.
🔹 Pivot-Driven Architecture — All visuals are powered by Excel pivot tables. Go to the Data tab and click Refresh All after updating your data — zero manual chart rebuilding needed.
🔹 Data Sheet for Easy Input — One structured data entry sheet with all required columns. Add your membership records row by row and the entire dashboard auto-updates.
🔹 Support Sheet for Power Users — Contains all pivot tables that drive the dashboard. Keep it hidden in production; revisit it when you need to customize a pivot layout.
🔹 Administration and Nonprofit Ready — Designed specifically for Chambers of Commerce, trade associations, business councils, and nonprofit membership organizations managing members, events, sponsors, and regional chapters.
📦 What’s Inside the Chamber of Commerce Dashboard in Excel
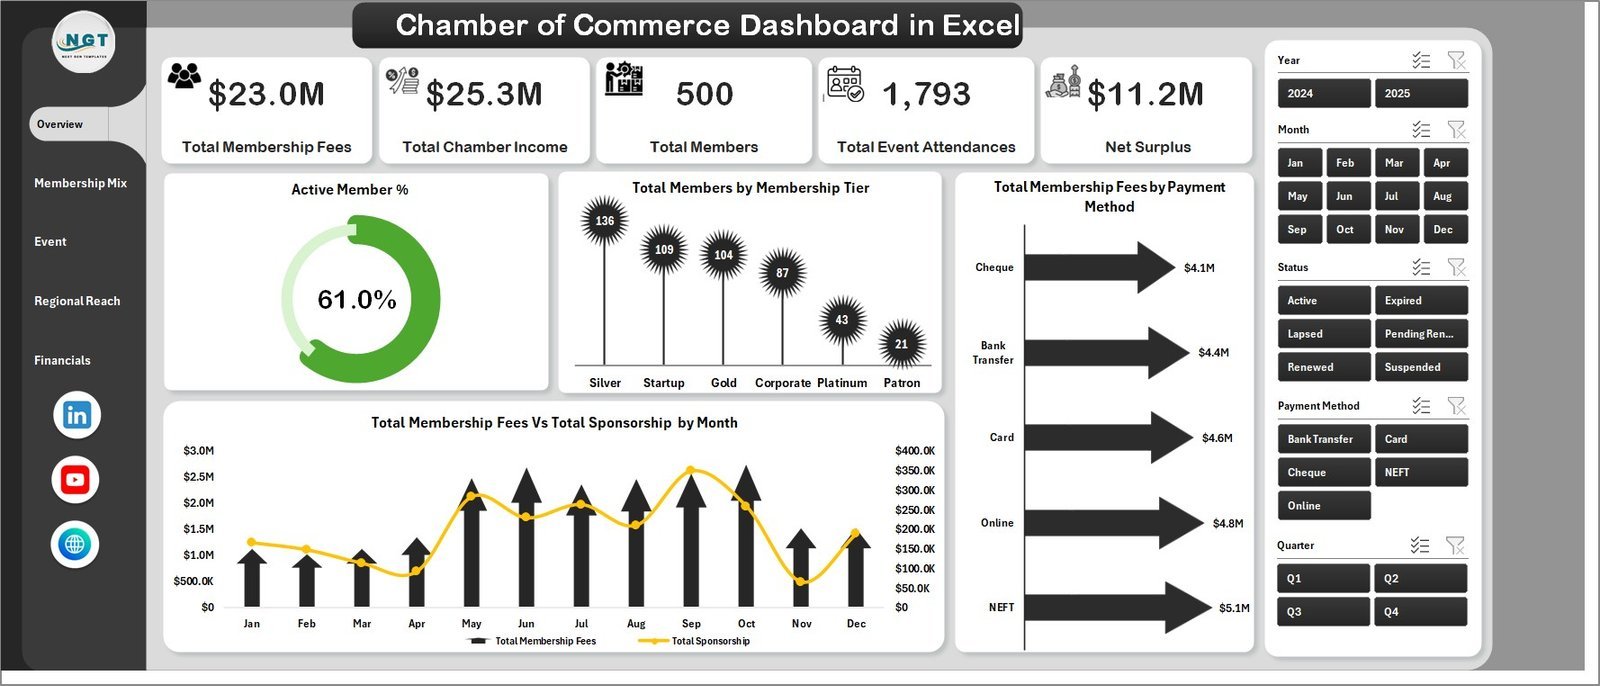
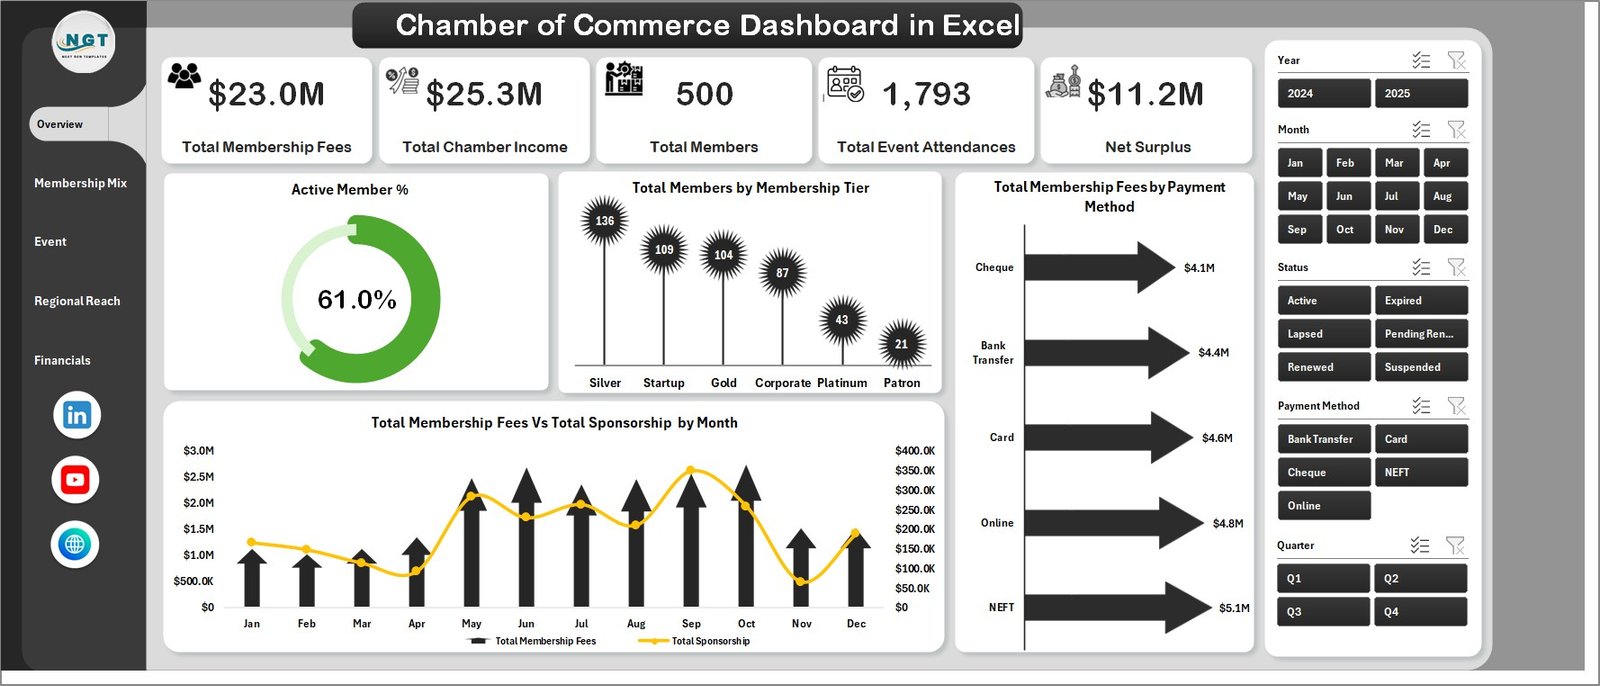
Page 1: Overview
The Overview page is the executive summary of the entire dashboard. It shows 5 KPI cards — Total Membership Fees, Total Chamber Income, Total Members, Total Event Attendances, and Net Surplus — along with 4 charts: Active Member %, Total Members by Membership Tier, Total Membership Fees by Payment Method, and Total Membership Fees vs Total Sponsorship by Month. Multiple slicers let you filter by membership tier, region, chapter, and payment method instantly.
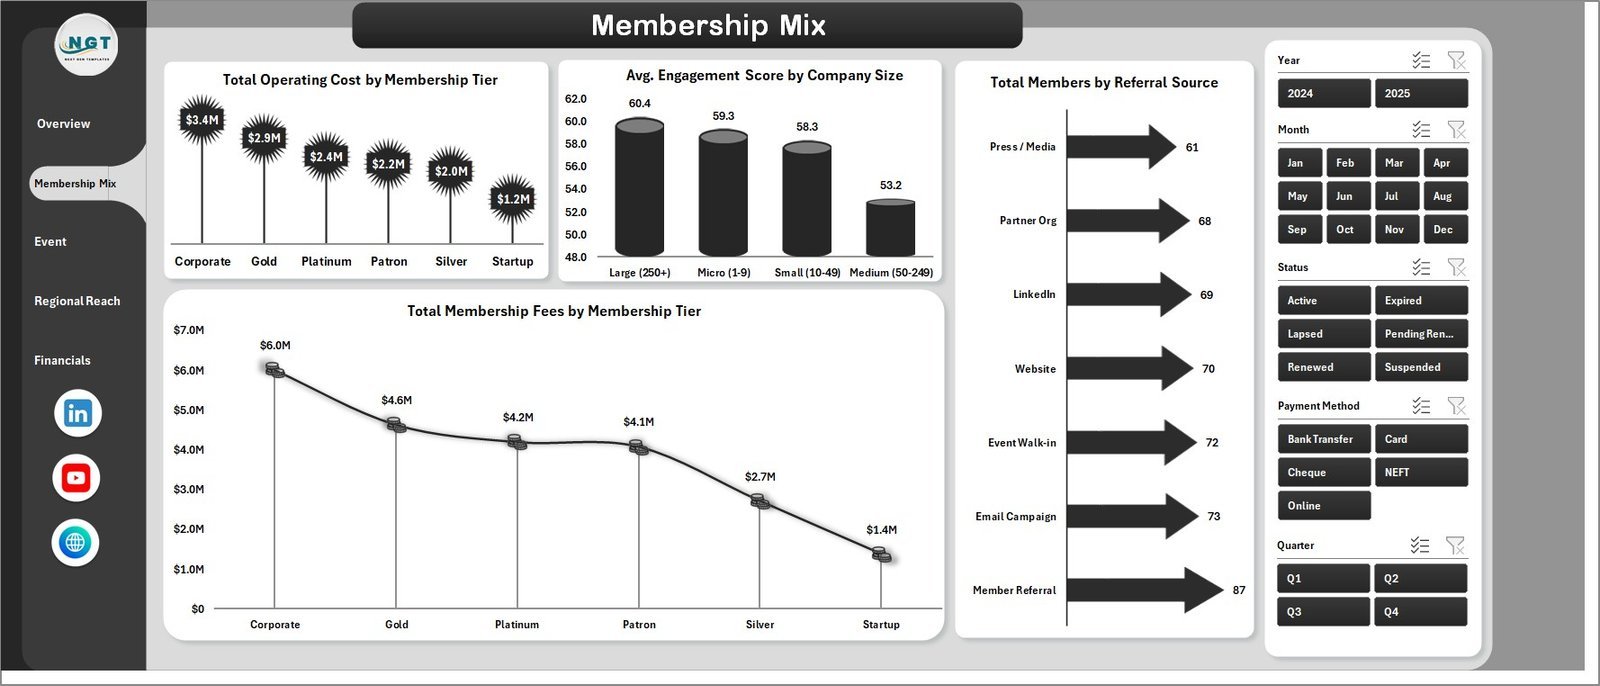
Page 2: Membership Mix
The Membership Mix page digs into how your member base is structured by analyzing Total Operating Cost by Membership Tier, Avg. Engagement Score by Company Size, Total Members by Referral Source, and Total Membership Fees by Membership Tier — giving chamber managers a clear picture of which segments drive the most value.

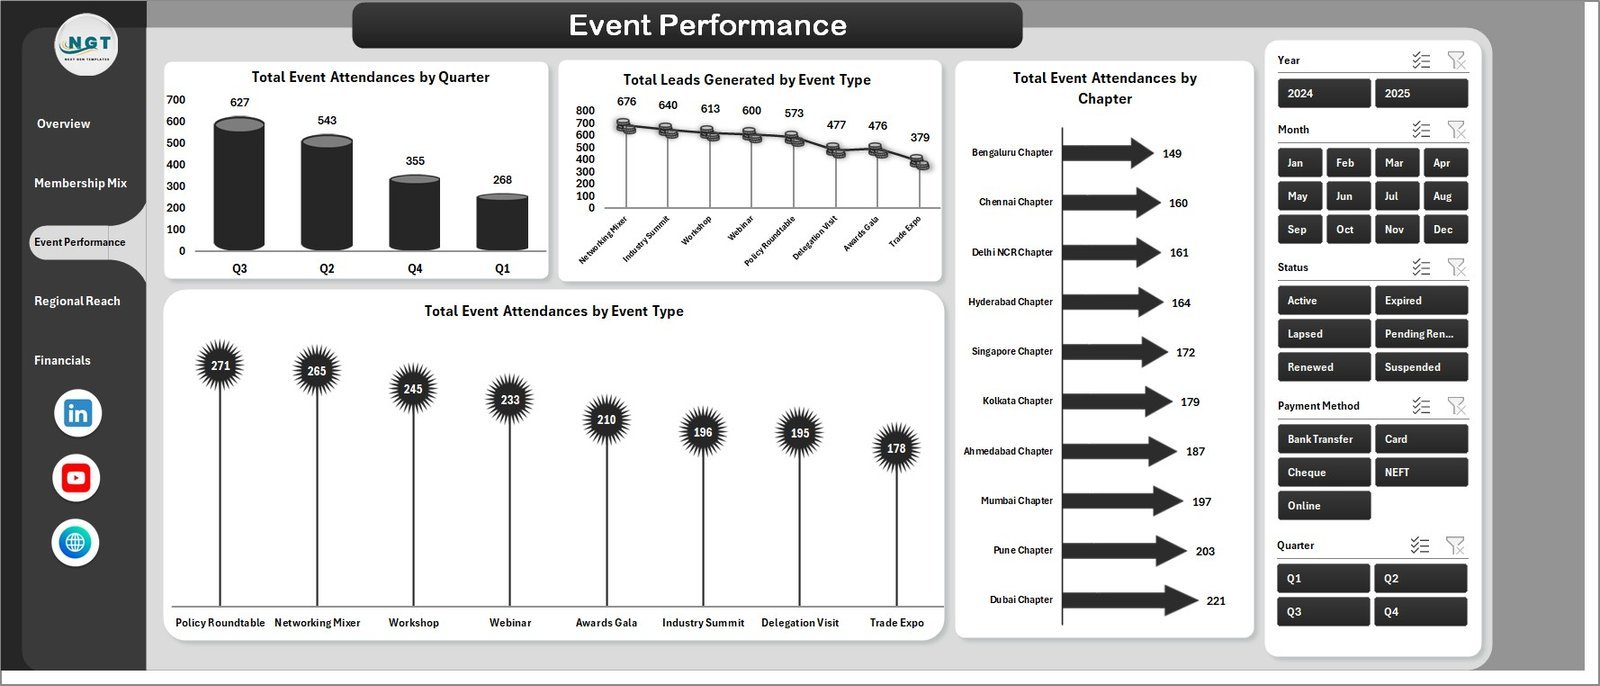
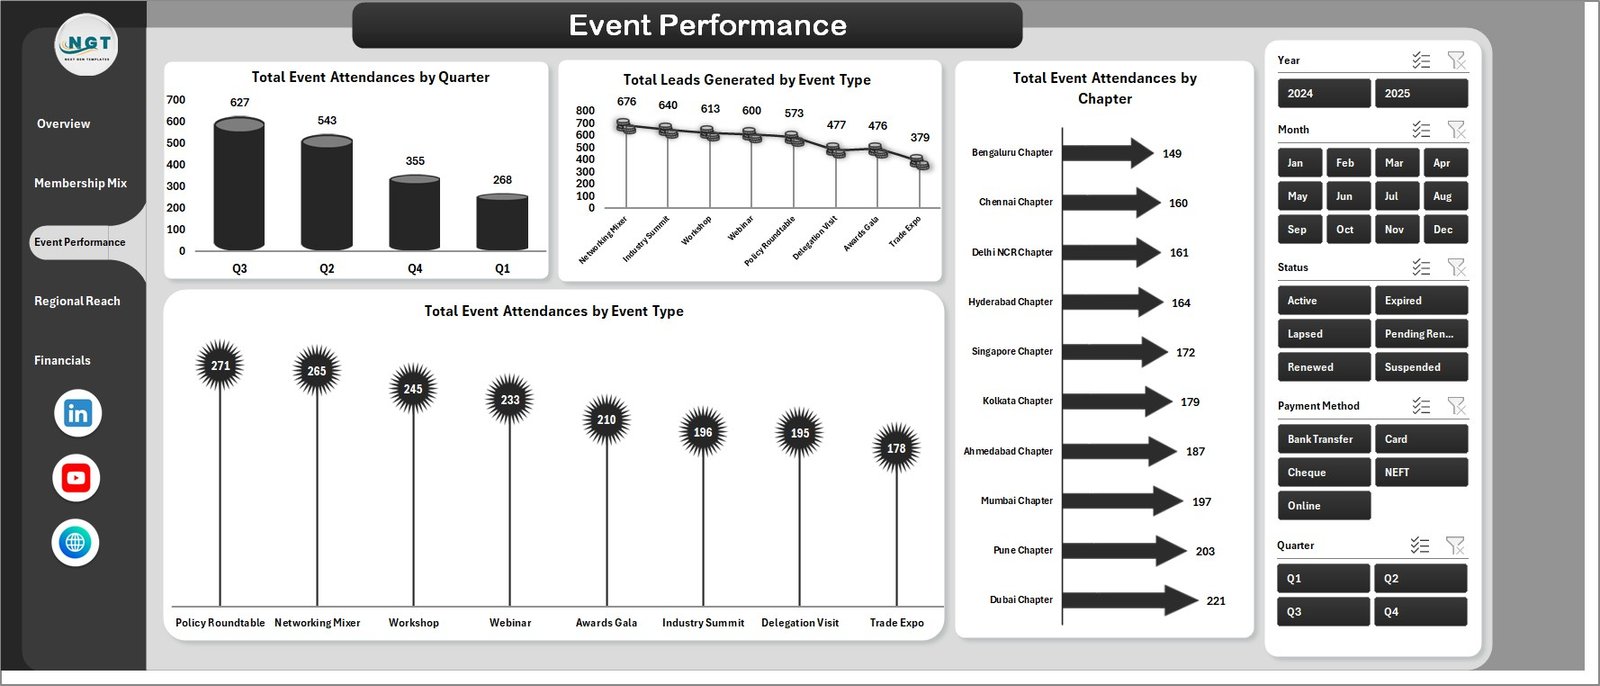
Page 3: Event Performance
The Event Performance page tracks your chamber’s event outcomes in detail. Charts include Total Event Attendances by Quarter, Total Leads Generated by Event Type, Total Event Attendances by Chapter, and Total Event Attendances by Event Type — essential for planning high-impact events and allocating chapter resources efficiently.
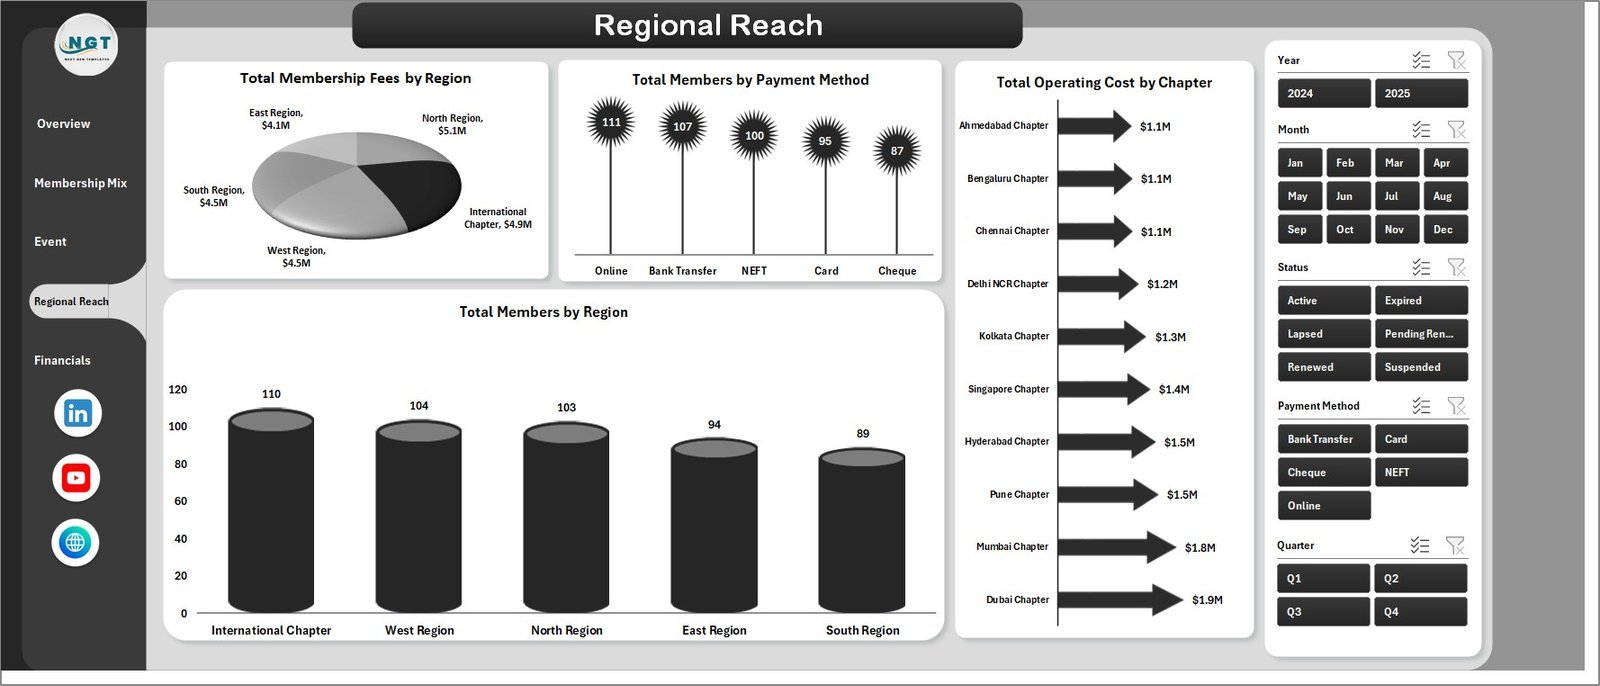
Page 4: Regional Reach
The Regional Reach page breaks down membership distribution and financial contribution by geography. Analysis includes Total Membership Fees by Region, Total Members by Payment Method, Total Operating Cost by Chapter, and Total Members by Region — giving regional directors and board members the geographic insight they need.

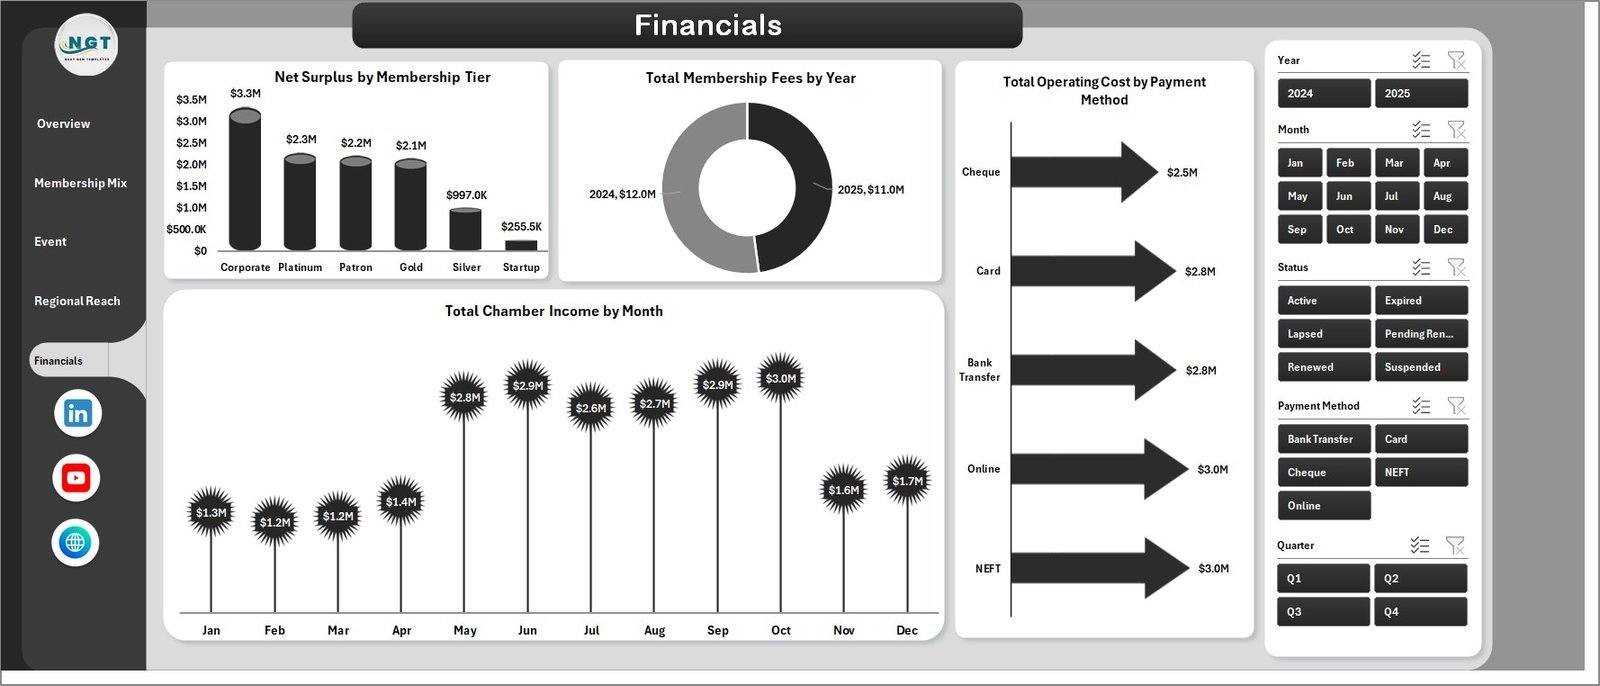
Page 5: Financials
The Financials page provides a comprehensive financial summary of your chamber’s income and cost performance. Charts cover Net Surplus by Membership Tier, Total Membership Fees by Year, Total Operating Cost by Payment Method, and Total Chamber Income by Month — all you need for board presentations and annual financial reviews.

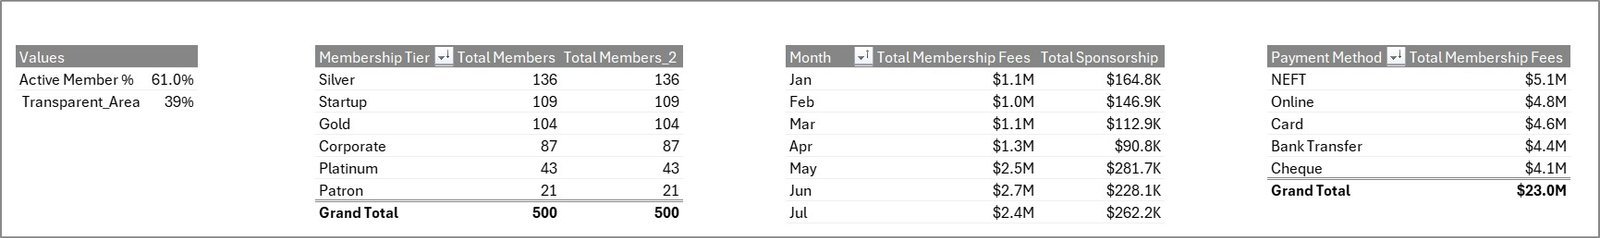
Data Sheet
The Data sheet is where you enter your membership records. Add data in the same structured column format — member details, fees, payment method, region, chapter, event attendance, and more — and the entire dashboard updates on Refresh All.

Support Sheet
The Support sheet contains all the pivot tables that power the dashboard’s charts and KPI cards dynamically. After updating data, go to the Data tab in the Excel Ribbon and click Refresh All — all pivots and charts update instantly. You can keep this sheet hidden in day-to-day use.

📊 Chamber of Commerce Dashboard in Excel vs. Google Sheets vs. Paid Association Software
| Feature | Chamber of Commerce Dashboard in Excel | Google Sheets Equivalent | Paid SaaS (GrowthZone / MemberClicks) |
|---|---|---|---|
| Cost | $17.99 one-time | Free (manual build) | $200–$600 / month |
| Platform | Microsoft Excel | Google Sheets | Cloud SaaS |
| Setup time | Under 10 minutes | Hours of setup | Days of onboarding |
| Interactive slicers | ✅ Native Excel slicers | Dropdown filters only | ✅ Dashboard filters |
| Data ownership | ✅ Your file, your data | ✅ Your spreadsheet | ❌ Vendor-controlled |
| Customizable fields | ✅ Fully customizable | ✅ Editable | Limited customization |
| Offline access | ✅ Works offline | ❌ Requires internet | ❌ Requires internet |
| Year-1 cost (5 users) | $17.99 total | $0 | $2,400–$7,200 |
| 5-page analysis | ✅ Overview, Mix, Events, Regional, Financials | Manual tabs only | ✅ Module-based |
For chambers that want pivot-driven membership analytics without paying $200+/month, the Chamber of Commerce Dashboard in Excel sits in the sweet spot.
👥 Who This Template Is For
✅ Built for:
- Chamber of Commerce managers tracking membership growth, event performance, and financials
- Trade associations and business councils with regional chapters and multiple membership tiers
- Nonprofit organizations managing annual membership fees, sponsorship income, and operating costs
- Finance and operations teams needing a one-click refreshable Excel reporting tool
- Outsourced accounting or management firms serving chamber clients
❌ NOT for:
- Organizations needing real-time automated CRM sync
- Teams requiring multi-user simultaneous editing
- Users without access to Microsoft Excel 2016 or later
⚙️ How to Use
- Download and open the file in Microsoft Excel 2016 or later.
- Navigate to the Data sheet and replace sample records with your membership data.
- Go to the Data tab and click Refresh All.
- All pivot tables update automatically, refreshing every chart and KPI card.
- Use slicers on each page to filter by region, tier, chapter, event type, or payment method.
💼 Real-World Use Cases
Maria manages operations at a regional Chamber of Commerce with 400+ members. She uses the Chamber of Commerce Dashboard in Excel to produce her monthly board report in under 30 minutes, instead of the 4-hour manual process she had before.
David is an outsourced accounting principal serving three chamber clients. He maintains one dashboard copy per client, updating the Data sheet monthly. The Financials page becomes the centrepiece of each quarterly review — without any SaaS licenses.
Priya leads business development for a state-level trade association. She uses the Membership Mix page to identify which referral source brings the highest-tier members, and the Regional Reach page to decide where to invest more event resources.
❓ Frequently Asked Questions
What KPIs does the Chamber of Commerce Dashboard in Excel track?
The Chamber of Commerce Dashboard in Excel tracks 5 KPIs: Total Membership Fees, Total Chamber Income, Total Members, Total Event Attendances, and Net Surplus — plus 12+ chart-level metrics across membership mix, event performance, regional distribution, and financials.
How does this compare to GrowthZone or MemberClicks?
The Chamber of Commerce Dashboard in Excel is a one-time $17.99 purchase vs. $200–$600/month for GrowthZone or MemberClicks. It delivers equivalent analytics for most small-to-mid-size chambers without vendor lock-in or per-user fees.
How long does setup take?
Under 10 minutes. Open the file, paste your membership data into the Data sheet in the same column format, click Refresh All, and the full 5-page dashboard is ready.
Can I customize the charts and KPIs?
Yes. The Support sheet contains all pivot tables powering the dashboard. Advanced Excel users can modify pivot layouts, add calculated fields, or restructure charts to match their reporting needs.
What version of Excel is required?
Microsoft Excel 2016 or later. The dashboard uses native pivot tables, slicers, and chart formatting — all available in Excel 2016, 2019, 2021, and Microsoft 365.
Is there a Google Sheets version?
Check the Google Sheets Dashboards collection. Also explore the full range of Excel Dashboard Templates.
👤 About the Author
Built by PK — Microsoft Certified Professional with 15+ years of Excel, Google Sheets, and Power BI experience. Founder of NextGenTemplates, reaching 300K+ subscribers across YouTube channels (@PK-AnExcelExpert, @NextGenTemplates, @NeoTechNavigators). Every template is hand-built and tested before release.
🔗 Explore Related Templates
- Chamber of Commerce KPI Dashboard in Excel — MTD/YTD KPI tracking with target vs. actual.
- Chamber of Commerce KPI Dashboard in Power BI — Power BI version for BI-stack organizations.
Also available as: Google Sheets Dashboards | Power BI Dashboards
📖 Click here to read the Detailed Blog Post
🎥 Visit our YouTube channel for step-by-step video tutorials
👉 YouTube.com/@NextGenTemplates
📅 Last updated: May 2026
Watch the step-by-step video tutorial:
YouTube


Reviews
There are no reviews yet.