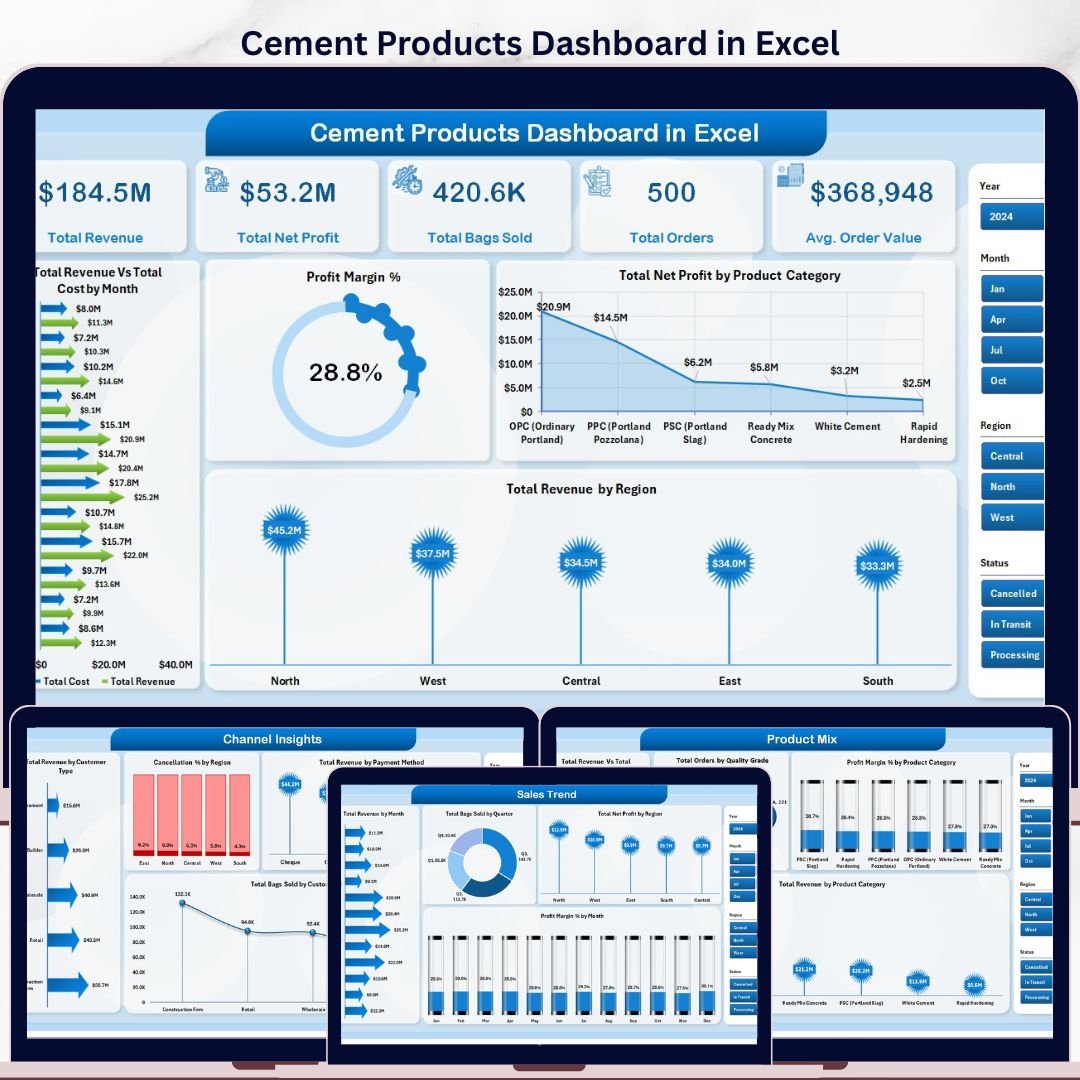

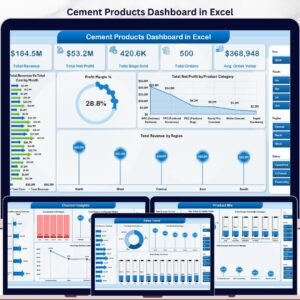
The Cement Products Dashboard in Excel tracks 5 KPI cards and 16 pre-built charts across 5 interactive analysis pages, built for cement manufacturers, distributors, and sales managers who need a clear view of revenue, profitability, product mix, and plant operations — without a $200+/month BI subscription.
🌍 Join 8,400+ teams in 40+ countries using Nextgen Templates to replace paid SaaS analytics with one-time-purchase Excel, Google Sheets, Power BI, and HTML templates.
✅ Instant download · One-time payment · No subscription · No per-user fees · Lifetime access
🔑 Key Features of the Cement Products Dashboard in Excel
📊 5-Page Interactive Dashboard — Five analysis tabs cover every angle of cement sales performance: Overview, Sales Trend, Product Mix, Channel Insights, and Operations. Each tab has its own set of charts and slicer filters so you can drill into exactly the data you need in seconds.
🎛️ Multiple Slicers for Instant Filtering — Slicers across every dashboard page let you filter by region, product category, customer type, payment method, and more. No formulas to edit — just click a slicer value and every chart on the page updates instantly.
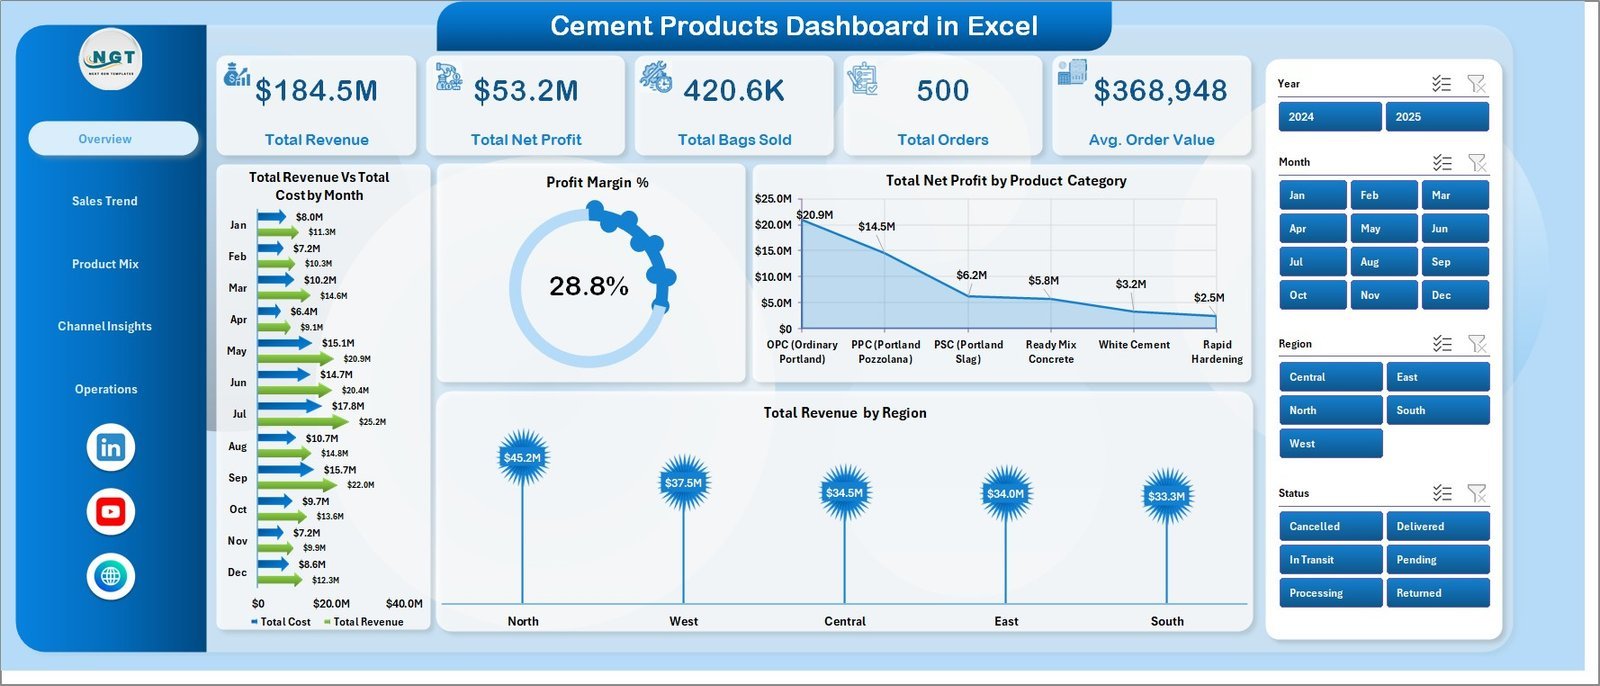
📦 Tracks 5 Core KPIs — The dashboard displays Total Revenue, Total Net Profit, Total Bags Sold, Total Orders, and Average Order Value as card metrics on the Overview page. These five numbers give any cement business a snapshot of health in under 30 seconds.
🔄 Pivot-Driven Architecture — All charts are powered by pivot tables in a dedicated Support sheet. After updating data, simply go to Data → Refresh All in the Excel Ribbon and every pivot and chart refreshes automatically.
🌍 Regional and Plant-Level Breakdown — Revenue, profit, and operational metrics are broken down by region and by plant, giving operations managers visibility into where margin is strongest and where delivery performance is lagging.
📈 Product Mix and Quality Grade Analysis — Revenue vs. Cost by product category, revenue split by category, profit margin by category, and orders by quality grade help product teams understand which cement grades drive the most value.
📦 What’s Inside the Cement Products Dashboard in Excel
Page 1: Overview
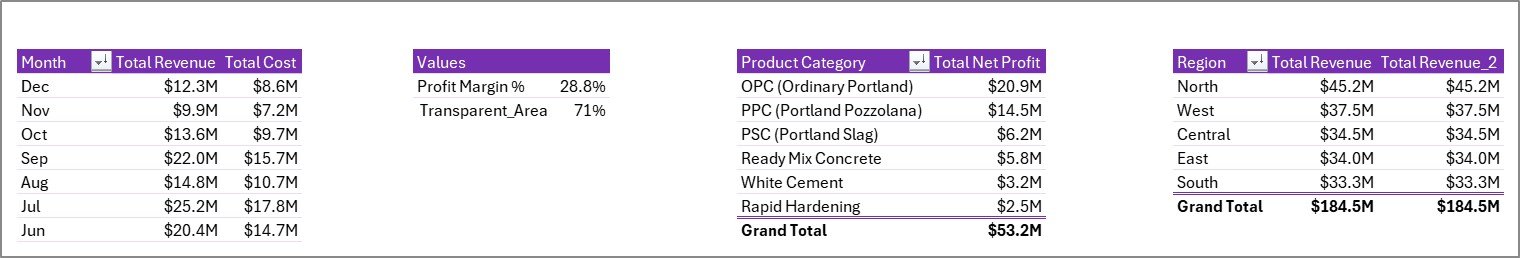
The Overview page displays 5 KPI cards (Total Revenue, Total Net Profit, Total Bags Sold, Total Orders, Avg. Order Value) and 4 charts: Total Revenue vs Total Cost by Month, Profit Margin %, Total Net Profit by Product Category, and Total Revenue by Region. Multiple slicers let you filter the entire page instantly.

Page 2: Sales Trend
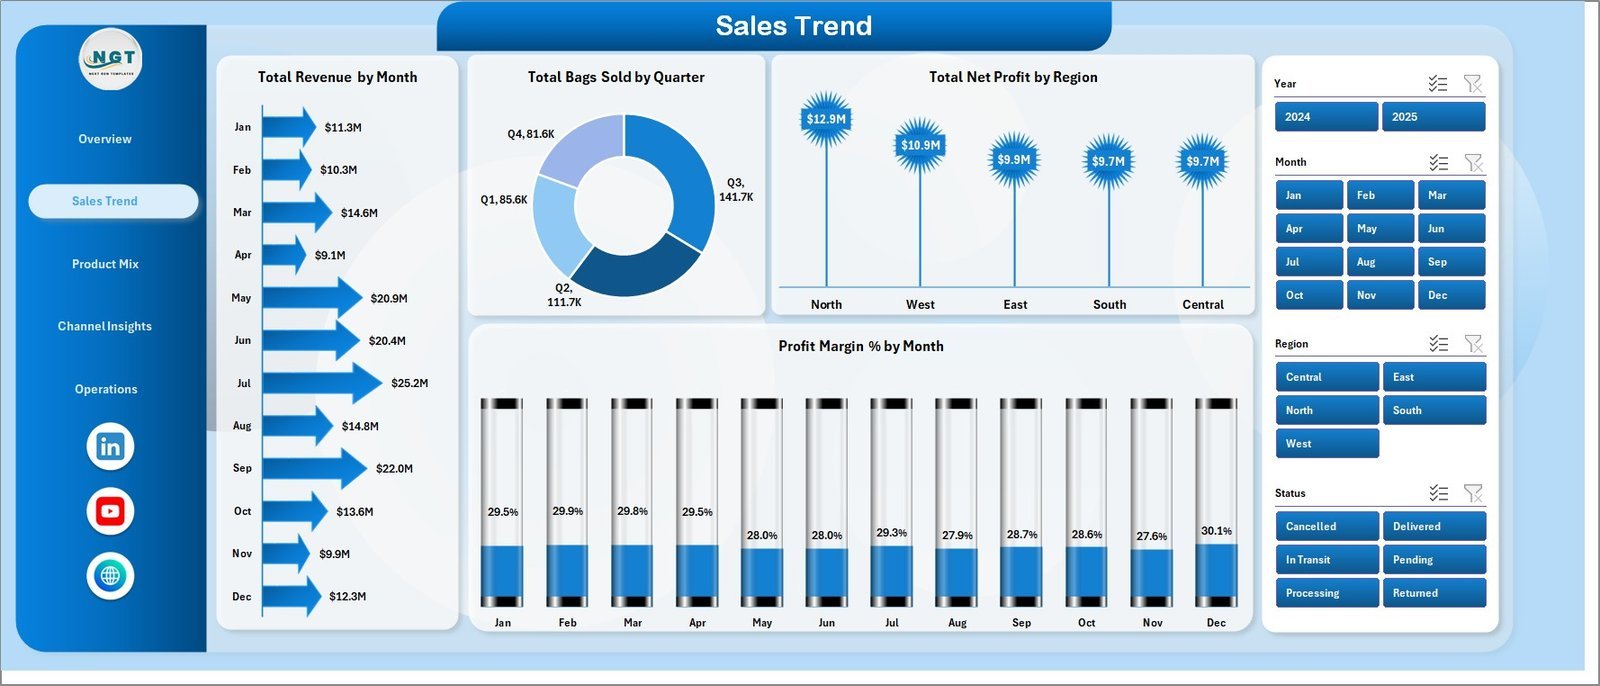
The Sales Trend page shows temporal and regional revenue performance with 4 charts: Total Revenue by Month, Total Bags Sold by Quarter, Total Net Profit by Region, and Profit Margin % by Month — ideal for spotting seasonal patterns and regional growth.

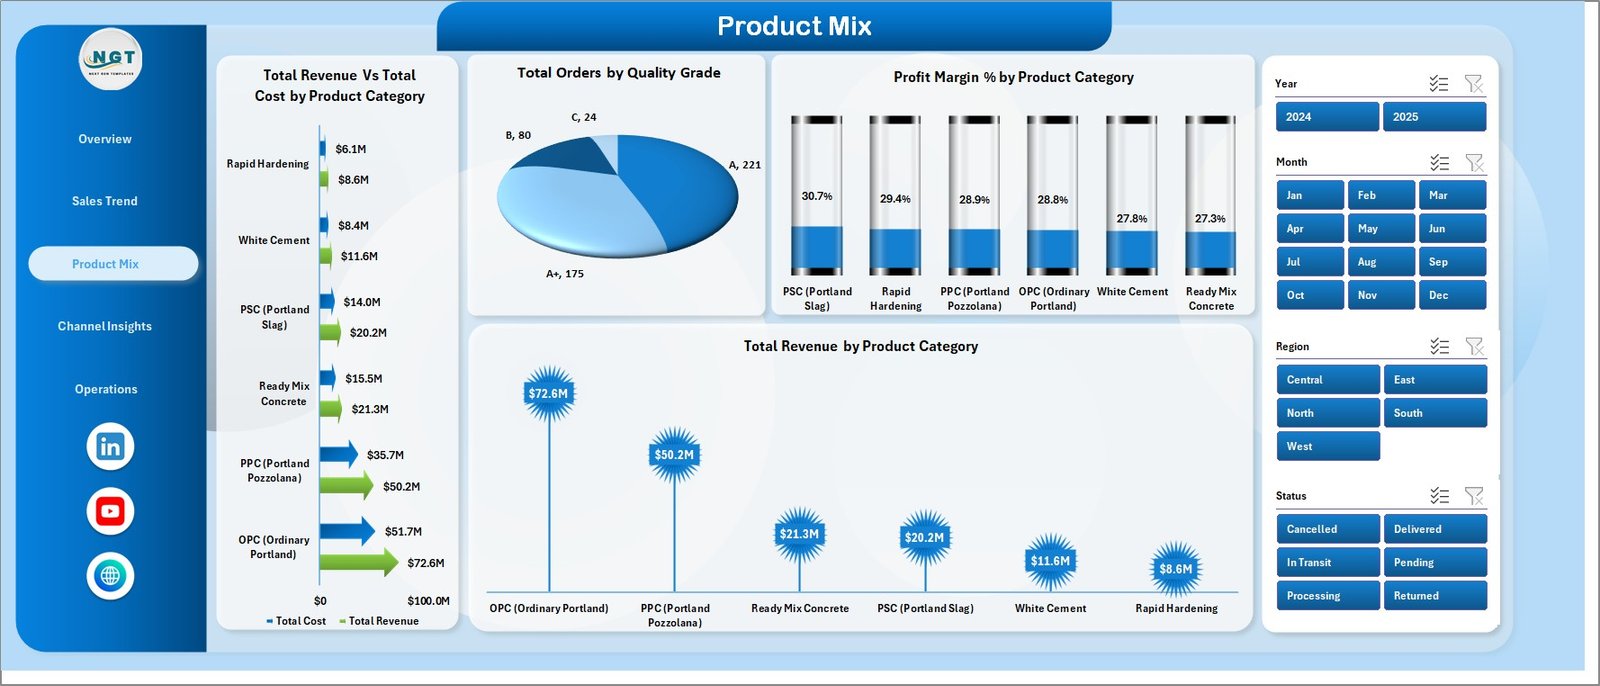
Page 3: Product Mix
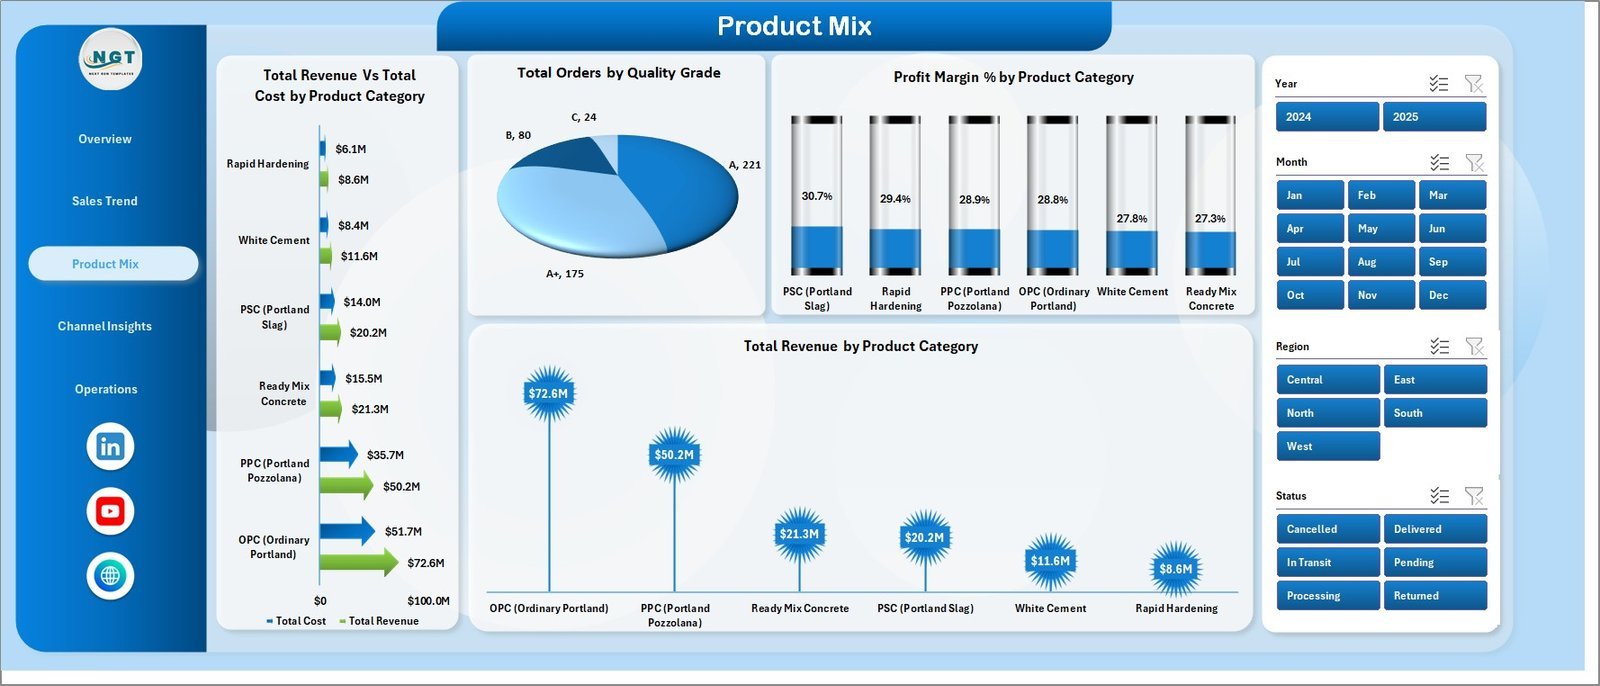
The Product Mix page breaks down performance by cement category and quality grade with 4 charts: Total Revenue vs Total Cost by Product Category, Total Orders by Quality Grade, Profit Margin % by Product Category, and Total Revenue by Product Category.
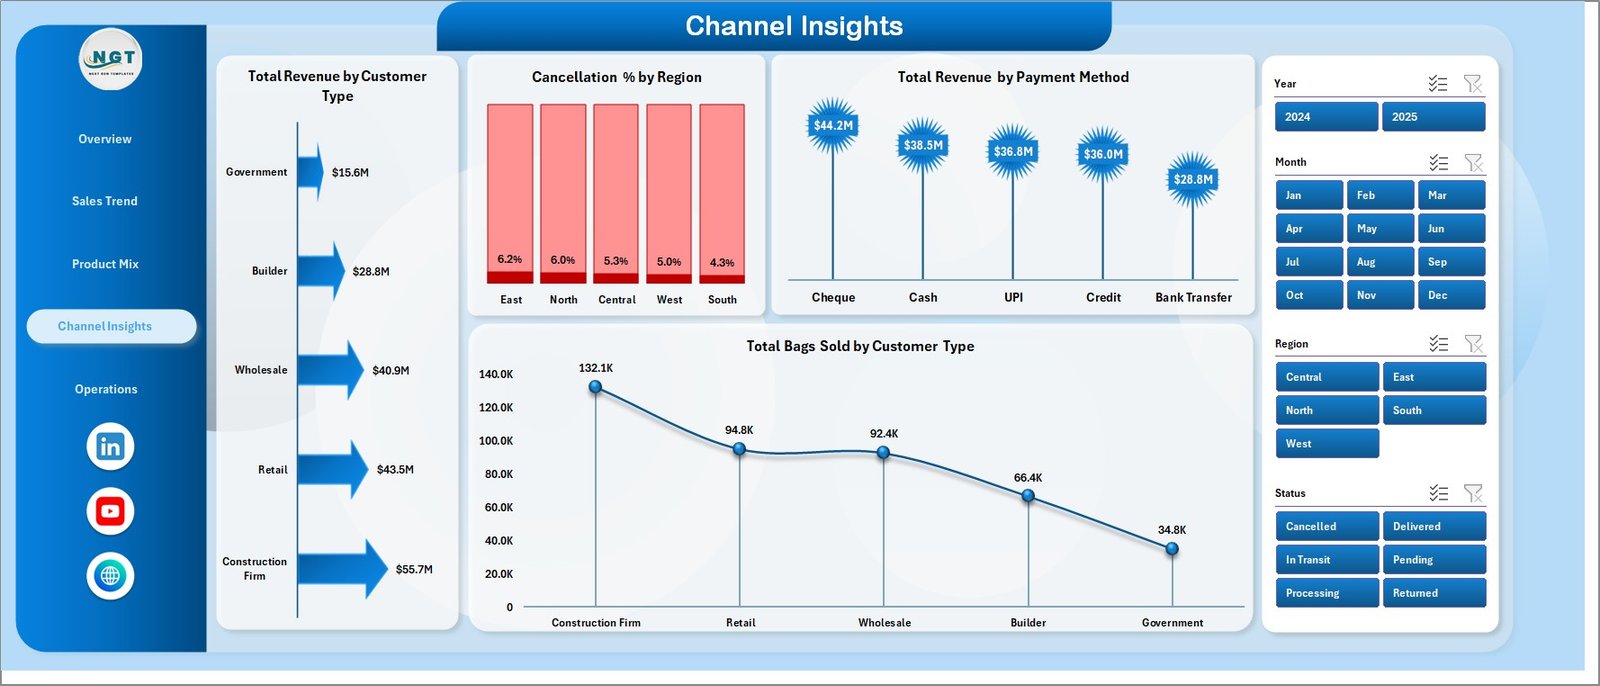
Page 4: Channel Insights
Channel Insights shows customer and payment behavior with 4 charts: Total Revenue by Customer Type, Cancellation % by Region, Total Revenue by Payment Method, and Total Bags Sold by Customer Type — critical for understanding sales channel efficiency.
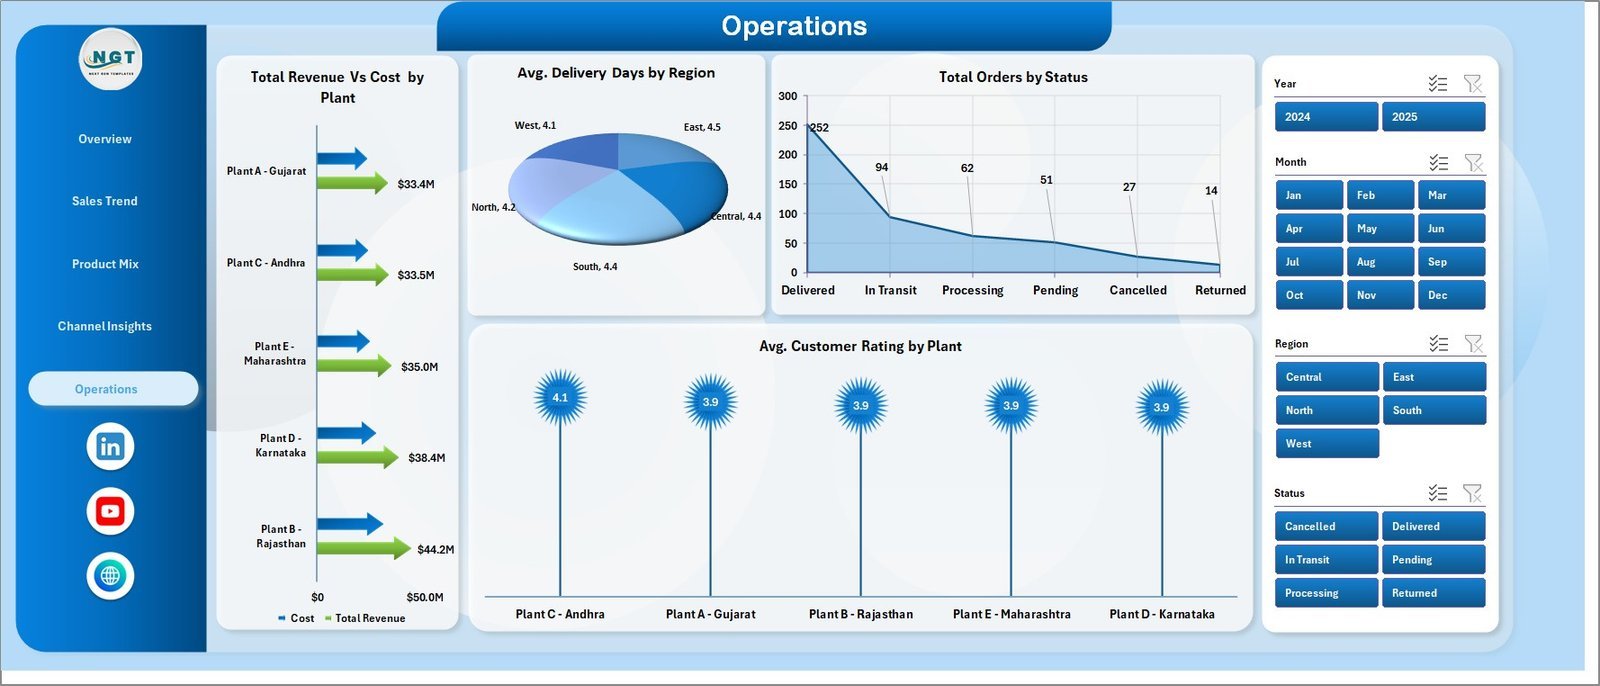
Page 5: Operations
The Operations page tracks plant and logistics performance with 4 charts: Total Revenue vs Cost by Plant, Avg. Delivery Days by Region, Total Orders by Status, and Avg. Customer Rating by Plant — giving operations managers what they need for performance reviews.

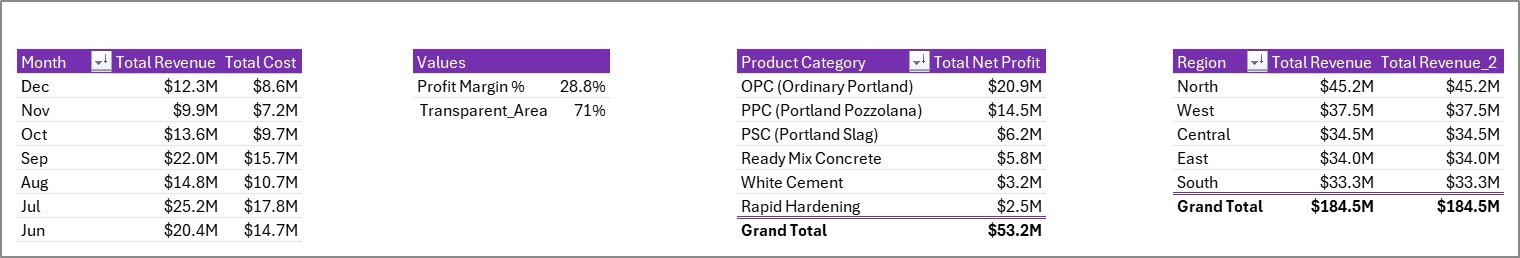
Data Sheet
The Data Sheet is the input layer — add your transactions in the same column format as the sample data. All dashboard pages read from this sheet via pivot tables, so your charts update automatically after a single Refresh All click.

Support Sheet
The Support Sheet houses all underlying pivot tables that power every chart. It can be kept hidden from end users. After updating data, use Data → Refresh All to refresh every pivot and chart across all pages instantly.
📊 Cement Products Dashboard in Excel vs. Google Sheets vs. Power BI / Tableau — Where This Fits
| Feature | Cement Products Dashboard in Excel | Google Sheets Equivalent | Power BI / Tableau |
|---|---|---|---|
| Cost | $17.99 one-time ✅ | $0 (Google account needed) | $10–$20/user/month (Power BI Pro) or $75+/user/month (Tableau) |
| Platform | Microsoft Excel (offline) ✅ | Browser-based, online only | Requires Power BI Desktop or Tableau Desktop |
| Setup time | Under 10 minutes ✅ | Under 10 minutes | Hours to days for data modeling and gateway setup |
| Works offline | Yes ✅ | No | Power BI Desktop yes; service requires internet |
| Customizable fields | Fully customizable ✅ | Yes | Yes, with DAX/calculated fields |
| No per-user fees | Yes ✅ | Yes | No — per-user licensing required |
| Pivot-driven refresh | Yes — one click ✅ | Yes (manual formula recalc) | Yes (dataset refresh) |
| Year-1 cost at 5 users | $17.99 total ✅ | $0 | $600–$4,500+ |
For cement sales teams that need offline-ready, shareable analytics without Power BI licensing costs, the Cement Products Dashboard in Excel sits in the sweet spot.
👥 Who This Template Is For — and Who It’s Not For
✅ This template is built for:
- Cement manufacturers tracking revenue, margin, and bags sold across multiple product categories
- Sales managers at cement distributors who need regional and customer-type breakdowns
- Operations managers monitoring plant performance, delivery days, and order status
- Finance teams at building materials companies building monthly performance reports
- Business analysts at SMB cement firms replacing manual spreadsheet reports
❌ This template is NOT for:
- Large enterprises needing real-time ERP integration with SAP or Oracle data feeds
- Teams requiring multi-user simultaneous editing with row-level data security
- Operations needing automated daily data ingestion from production IoT systems
⚙️ How to Use the Cement Products Dashboard in Excel
- Download and open the file in Microsoft Excel (2016 or later recommended).
- Review the Data Sheet — understand the column structure and clear the sample rows.
- Enter your cement sales data into the Data Sheet using the same column format.
- Go to the Data tab in the Excel Ribbon and click Refresh All.
- All pivot tables and charts update automatically across all 5 dashboard pages.
- Use the slicers on each page to filter by region, product category, customer type, or other dimensions.
- Hide the Support Sheet for a cleaner view when sharing the file with your team.
💼 Real-World Use Cases
Arun manages regional sales for a cement manufacturer in South India. He uses the Cement Products Dashboard to track monthly revenue by region, spot which product categories are underperforming, and build his weekly sales report for the VP — without waiting on IT for a Power BI refresh or paying $15/user/month for analytics software.
A procurement analyst at a mid-sized building materials distributor uses the Channel Insights page to track cancellation rates by region and revenue by payment method. Within the first month, she identified one region with a 34% cancellation rate — leading to a corrective action that reduced cancellations by 12% in the next quarter.
A plant operations manager at a 3-plant cement company uses the Operations page to compare Avg. Customer Rating and Avg. Delivery Days by plant. The side-by-side view made a performance gap between Plant 1 and Plant 3 visible in minutes — something that took three manually compiled reports to show before.
❓ Frequently Asked Questions
What KPIs does the Cement Products Dashboard in Excel track?
The Cement Products Dashboard in Excel tracks 5 core KPIs: Total Revenue, Total Net Profit, Total Bags Sold, Total Orders, and Average Order Value. These appear as card metrics on the Overview page and are sliced across 5 analysis tabs covering sales trends, product mix, channel behavior, and plant operations.
Does this dashboard work without Power BI or any add-ins?
Yes — the Cement Products Dashboard in Excel runs entirely on native Excel pivot tables, slicers, and charts. No Power BI, no add-ins, no macros required. It works offline and is compatible with Excel 2016, 2019, 2021, and Microsoft 365.
How long does setup take?
Setup takes under 10 minutes. Open the file, clear the sample data in the Data Sheet, enter your own transactions in the same format, and click Refresh All. All 5 dashboard pages and 16 charts update instantly.
Can I add more product categories or regions?
Yes — the dashboard is fully customizable. Add new rows to the Data Sheet with your own categories, regions, or plants, then click Refresh All. The pivot tables will pick up the new values automatically.
How is this different from a Power BI cement dashboard?
The Cement Products Dashboard in Excel is a one-time $17.99 purchase with no per-user licensing and no cloud connectivity requirement. Power BI Pro costs $10/user/month ($600/year for 5 users) and requires a Power BI Gateway for on-premises data. For teams already working in Excel, this template is faster to deploy and significantly cheaper.
Can I share this file with my team?
Yes — you can share the Excel file via OneDrive, SharePoint, or email. For simultaneous co-editing, save to OneDrive and open in Excel for the web (Microsoft 365). For a single user at a time, desktop Excel works perfectly.
👤 About the Author
Built by PK — Microsoft Certified Professional with 15+ years of Excel, Google Sheets, and Power BI experience. Founder of NextGenTemplates, reaching 300K+ subscribers across YouTube channels
(@PK-AnExcelExpert,
@NextGenTemplates,
@NeoTechNavigators).
Every template is hand-built and tested before release.
🔗 Explore Related Templates
- 3D Printing Manufacturing KPI Dashboard in Excel — Multi-page KPI dashboard for additive manufacturing operations
- Adhesives and Sealants KPI Dashboard in Excel — Specialty chemicals and manufacturing KPIs
- Prosthetics Manufacturing KPI Dashboard in Excel — Manufacturing performance for healthcare products
- Excel Dashboard Templates — Full catalog of Excel dashboards across 50+ industries
- Manufacturing Templates — All manufacturing dashboards and trackers
📖 Click here to read the Detailed Blog Post
🎥 Visit our YouTube channel for step-by-step video tutorials
👉 YouTube.com/@NextGenTemplates
📅 Last updated: May 2026
Watch the step-by-step video tutorial:
YouTube


Reviews
There are no reviews yet.