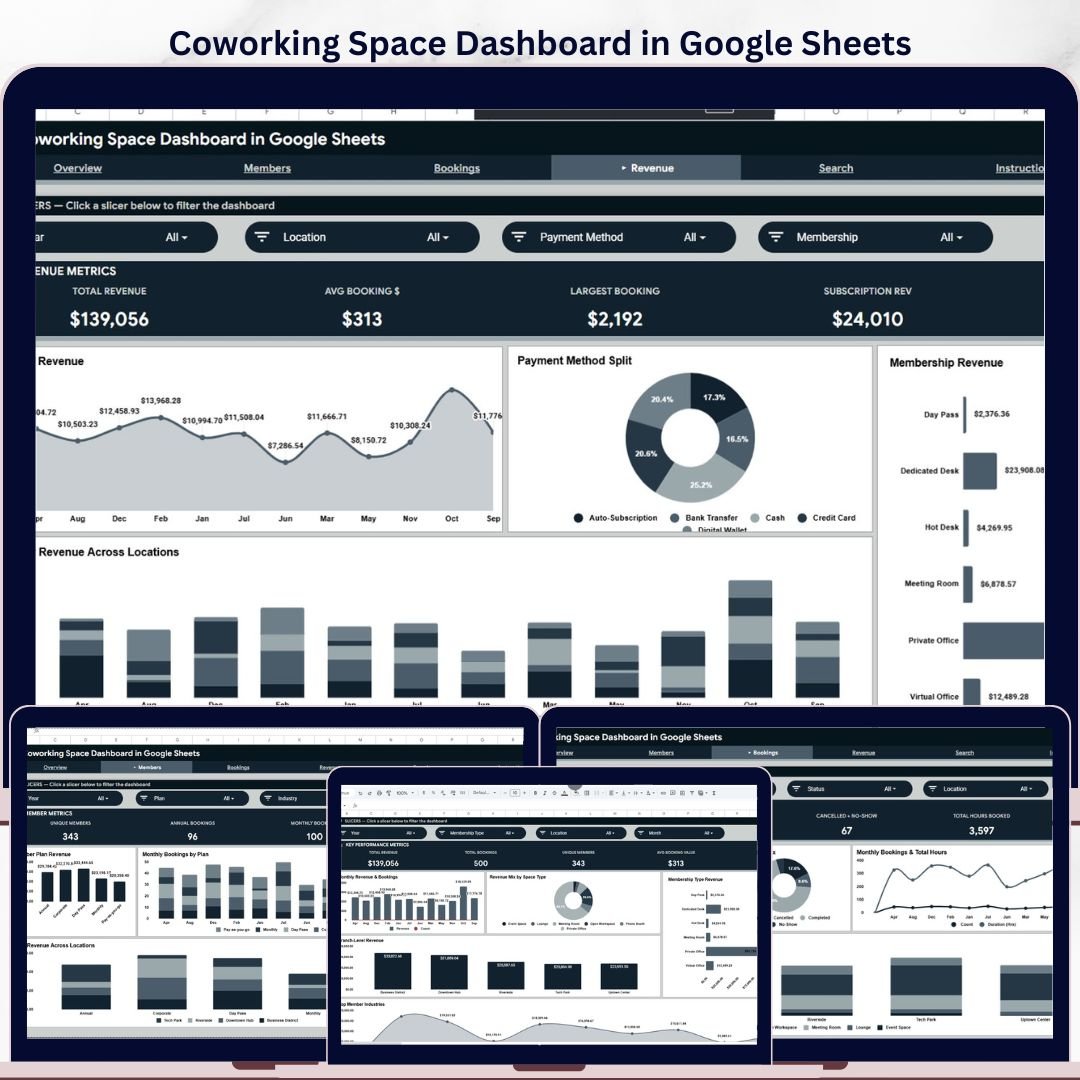

Coworking Space Dashboard in Google Sheets helps coworking operators turn booking, member, revenue, and location data into a clean management view. Instead of rebuilding charts every month, you get 6 sheet tabs, 4 KPI cards, and 17 ready-made analysis charts in one editable Google Sheets template. For a one-time $9.99 purchase, it gives small and mid-sized coworking teams a practical alternative to recurring software dashboards that can cost $49 to $299 per month. NextGenTemplates is used by 8,400+ teams in 40+ countries, and this file is fully editable with no subscription and no vendor lock-in.
Key Features of Coworking Space Dashboard in Google Sheets
- 6 Google Sheets tabs – Overview, Members, Bookings, Revenue, Search, and Data.
- 4 KPI cards – Total Revenue, Total Bookings, Unique Members, and Avg Booking Value.
- 17 analysis charts covering revenue, plans, industries, locations, space types, booking status, and payment methods.
- Interactive slicers so managers can filter the dashboard quickly without editing formulas.
- Search sheet to review one coworking booking record at a time in a clean lookup view.
- Structured data sheet for entering booking ID, date, member, plan, location, industry, revenue, duration, payment method, and status.
- Cloud-based collaboration through Google Sheets sharing and permissions.
- No code required – update the data and the dashboard visuals refresh from the connected sheet structure.
What’s Inside the Coworking Space Dashboard in Google Sheets
1. Overview Page
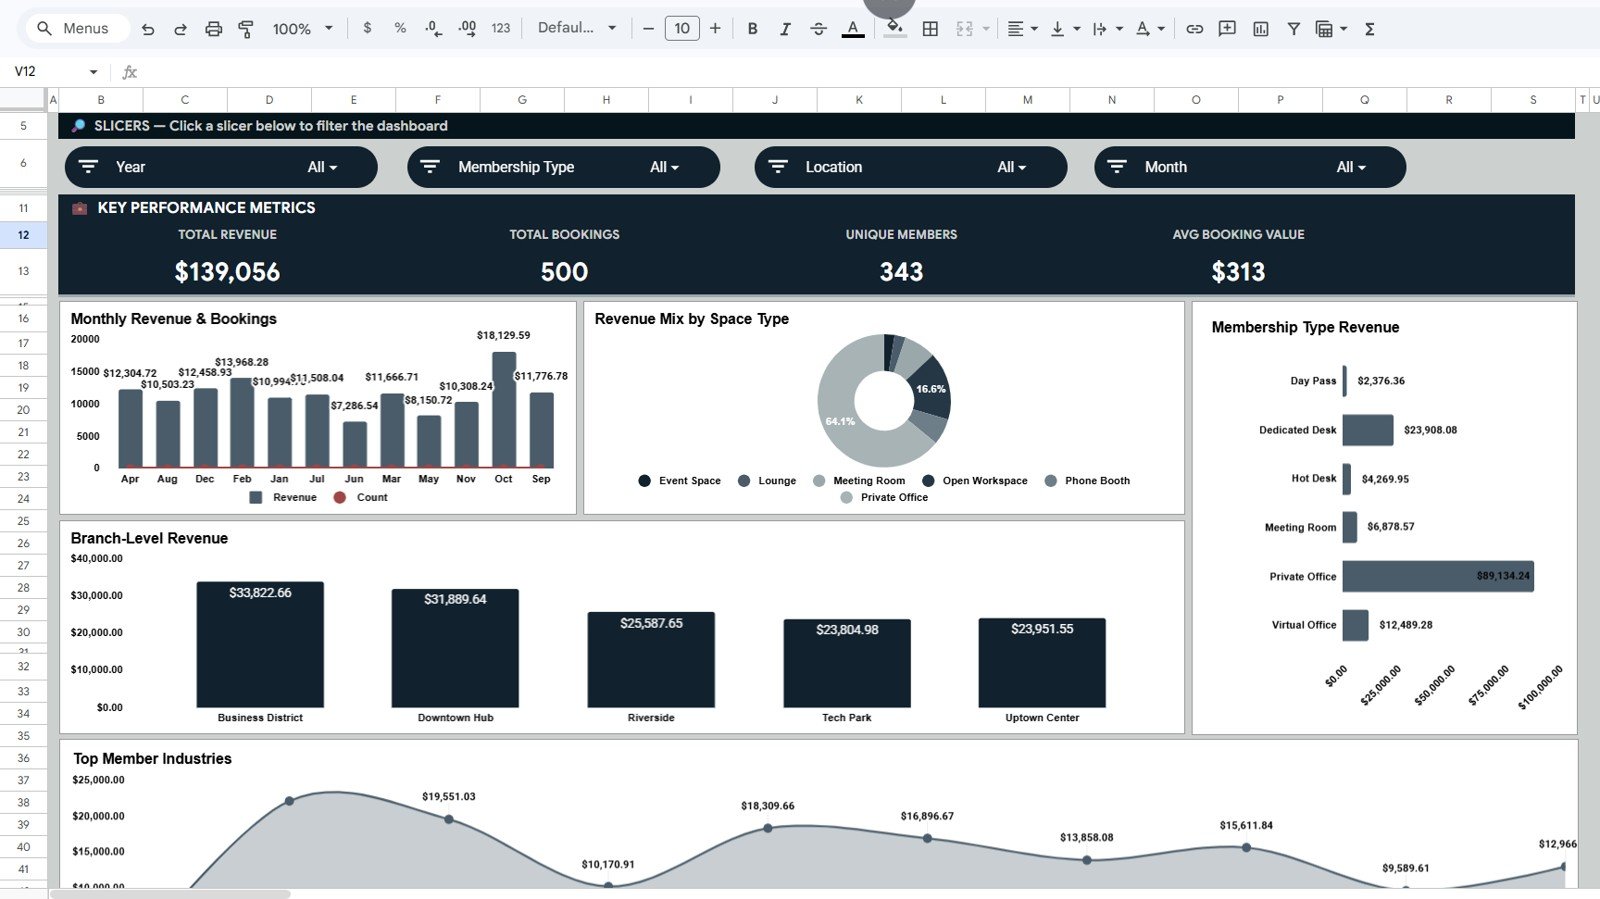
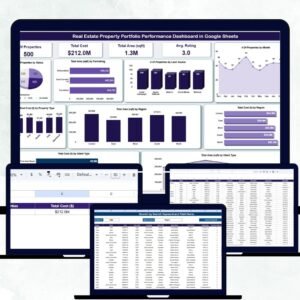
The Overview page is the executive summary for coworking performance. It shows Total Revenue, Total Bookings, Unique Members, and Avg Booking Value at the top so the team can read business health in seconds.
Revenue and Bookings by Month: This chart compares monthly revenue with booking volume. Use it to find seasonality, growth months, and periods where bookings rise without matching revenue growth.
Revenue by Space Type: This chart shows which spaces generate the most income, such as private offices, meeting rooms, hot desks, or event areas. It helps you identify premium space categories and underperforming inventory.
Revenue by Membership Type: This chart breaks down revenue by membership category. It makes it easier to see whether day passes, flex plans, dedicated desks, or enterprise plans are carrying the business.
Revenue by Location: This chart compares revenue across coworking locations or branches. Use it to spot high-performing sites and locations that may need pricing, marketing, or occupancy support.
Revenue by Industry: This chart shows revenue contribution by member industry. It helps you understand which member segments are most valuable for sales targeting and community programming.
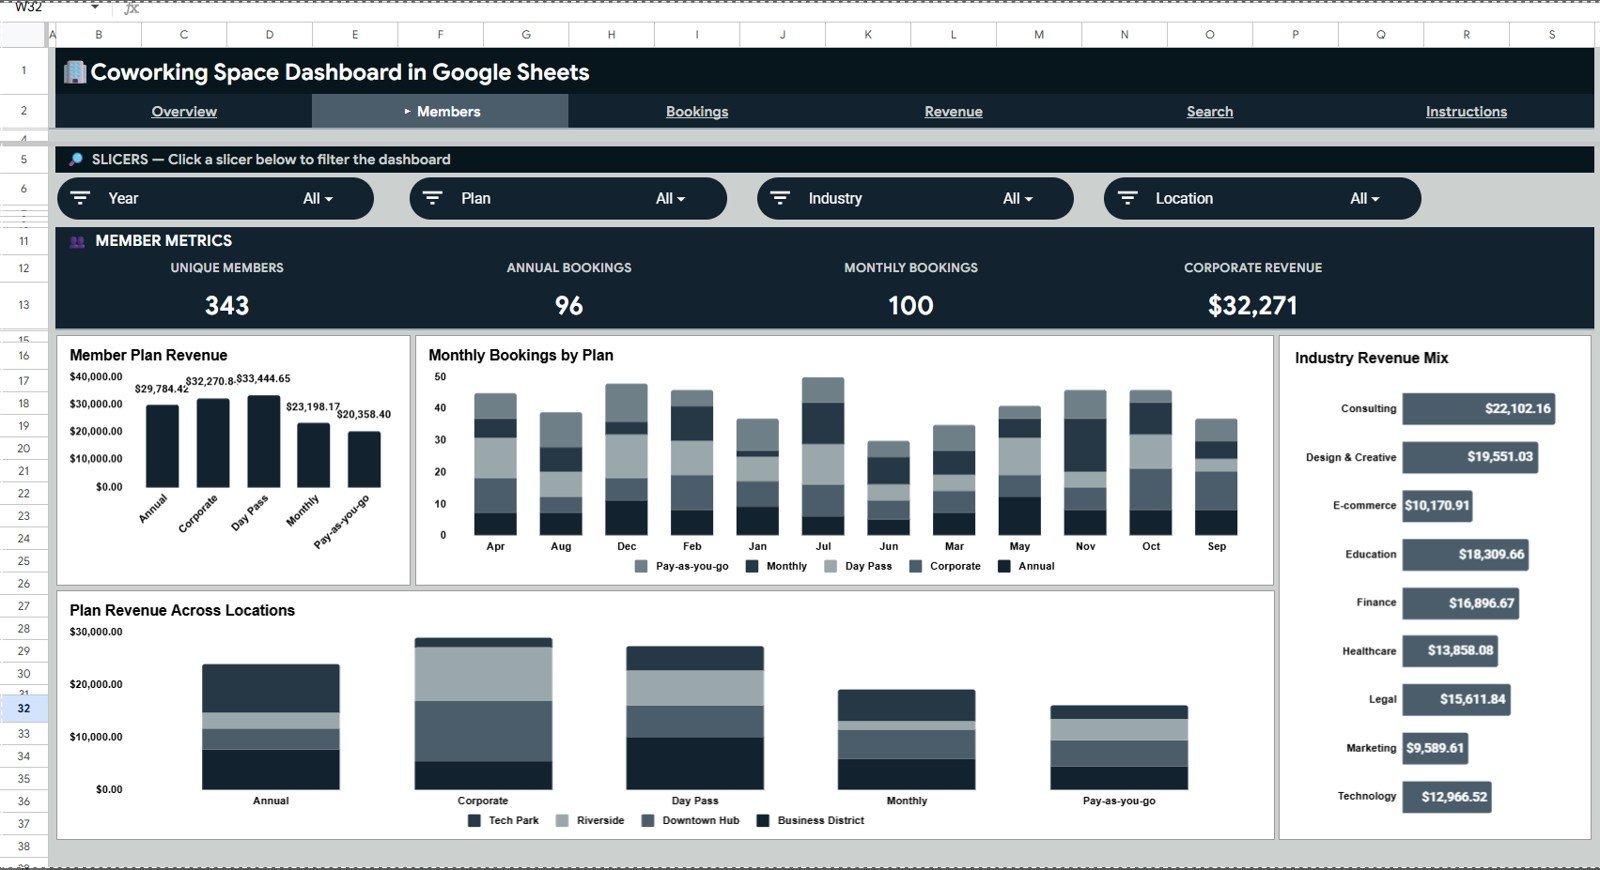
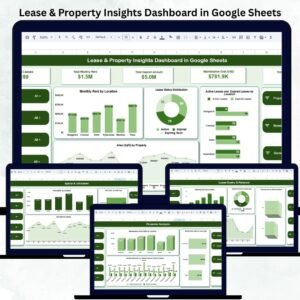
2. Members Sheet Tab
The Members page helps you understand how different member plans, industries, and locations contribute to revenue and booking activity.
Revenue by Member Plan: This chart ranks each member plan by revenue contribution. It helps owners decide which plans deserve promotion, restructuring, or pricing review.
Monthly Bookings by Plan: This chart shows how booking activity changes by plan across months. It is useful for comparing casual users against recurring members and identifying plan-level demand patterns.
Revenue by Industry: This chart connects revenue to the industries your members belong to. It can guide niche marketing campaigns for tech teams, consultants, creators, agencies, or professional services.
Plan Revenue by Location: This chart compares member plan revenue across locations. It helps reveal whether one branch depends on day passes while another performs better with recurring memberships.

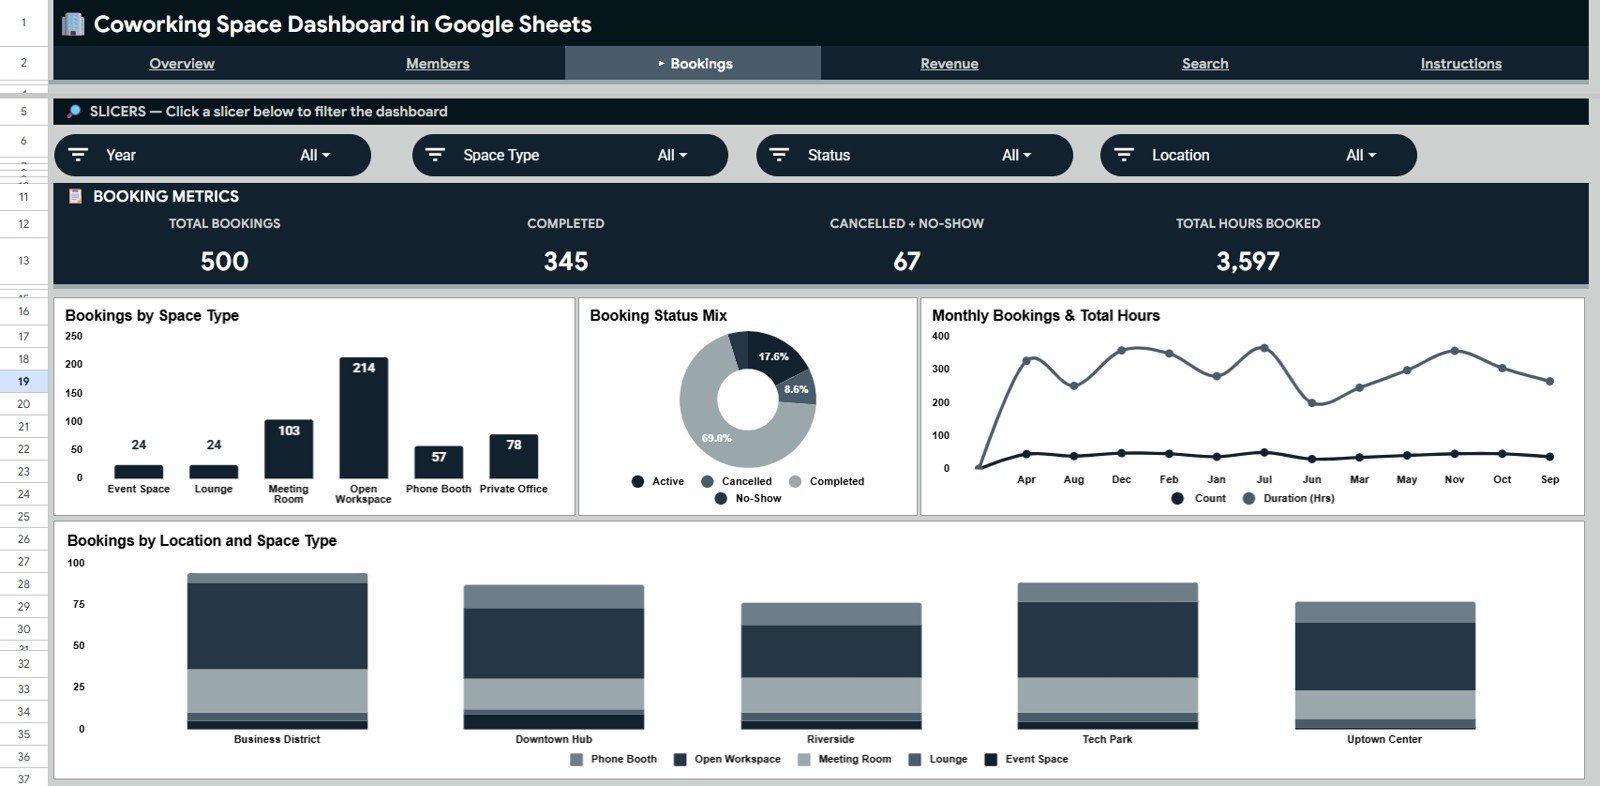
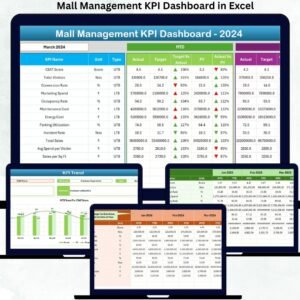
3. Bookings Sheet Tab
The Bookings page focuses on how coworking spaces are reserved, used, and completed over time.
Bookings by Space Type: This chart shows which space types receive the most reservations. It helps operations teams balance capacity, layout decisions, and room availability.
Bookings by Status: This chart separates completed, confirmed, cancelled, pending, or other booking statuses. It gives managers an immediate view of booking quality and process leakage.
Bookings and Total Hours by Month: This chart compares booking count with total booked hours. It helps reveal whether demand is coming from many short bookings or fewer long-duration reservations.
Bookings by Location and Space Type: This chart shows space demand by branch and space category. It helps identify which locations need more meeting rooms, desks, or private offices.

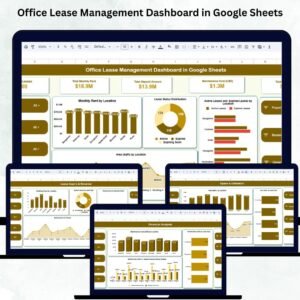
4. Revenue Sheet Tab
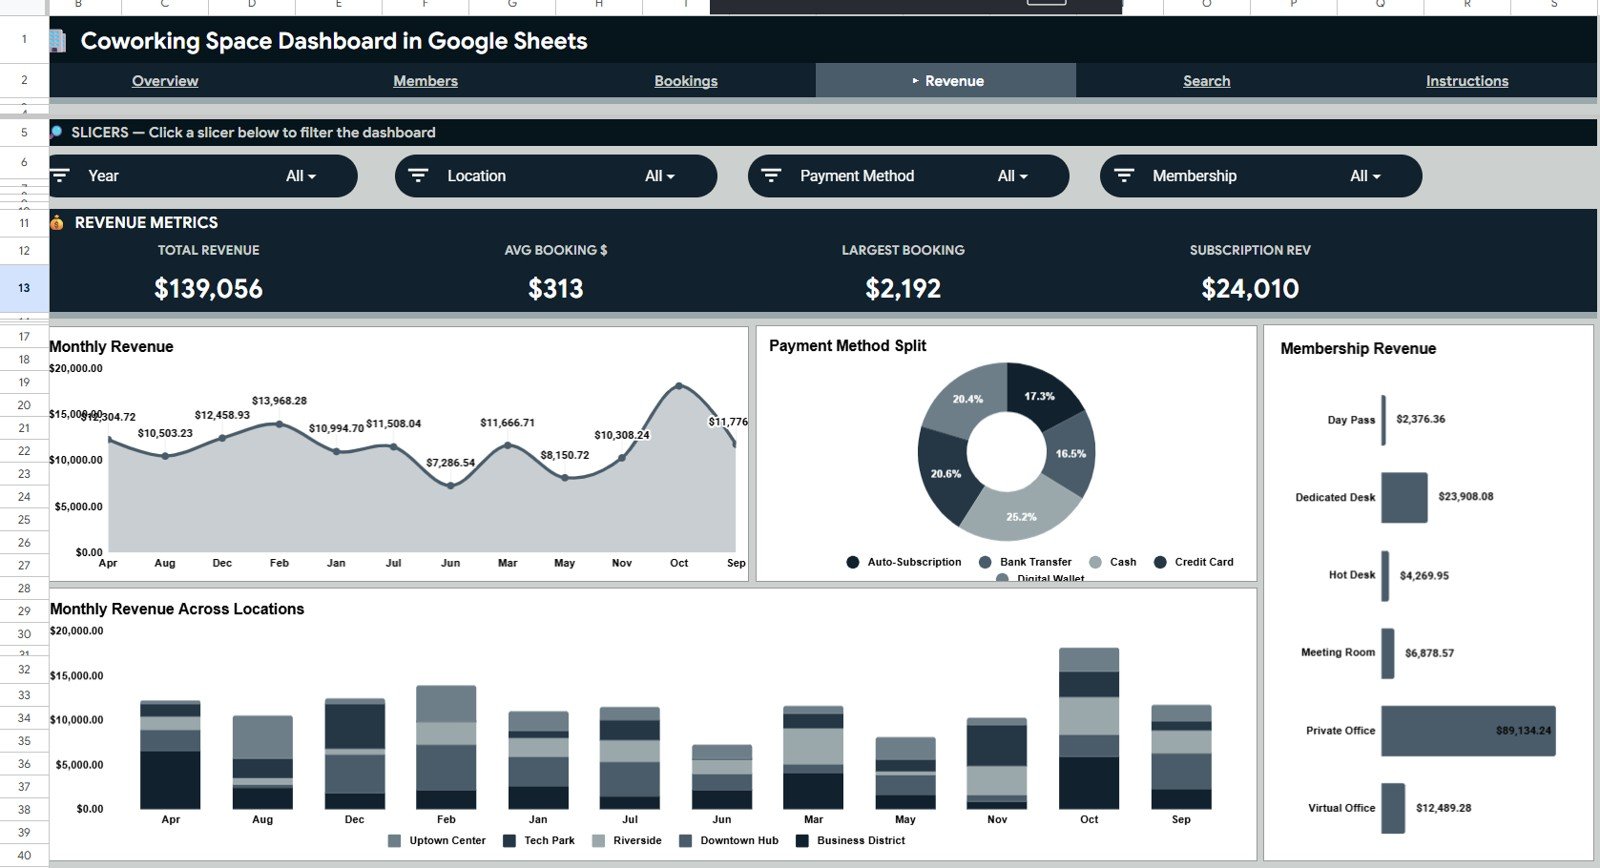
The Revenue page gives a focused financial view for recurring reporting, branch reviews, and pricing decisions.
Revenue by Month: This chart tracks monthly revenue movement. It helps managers compare current performance against previous months and plan future capacity or promotions.
Revenue by Payment Method: This chart shows how revenue is collected across payment methods. It helps finance teams understand customer payment behavior and reconcile collection channels.
Revenue by Membership Type: This chart compares how membership categories contribute to revenue. It supports pricing decisions for flex, dedicated, corporate, virtual, and day-pass plans.
Revenue by Location and Month: This chart combines branch-level and monthly analysis. It helps identify whether a revenue dip is company-wide or limited to one location.
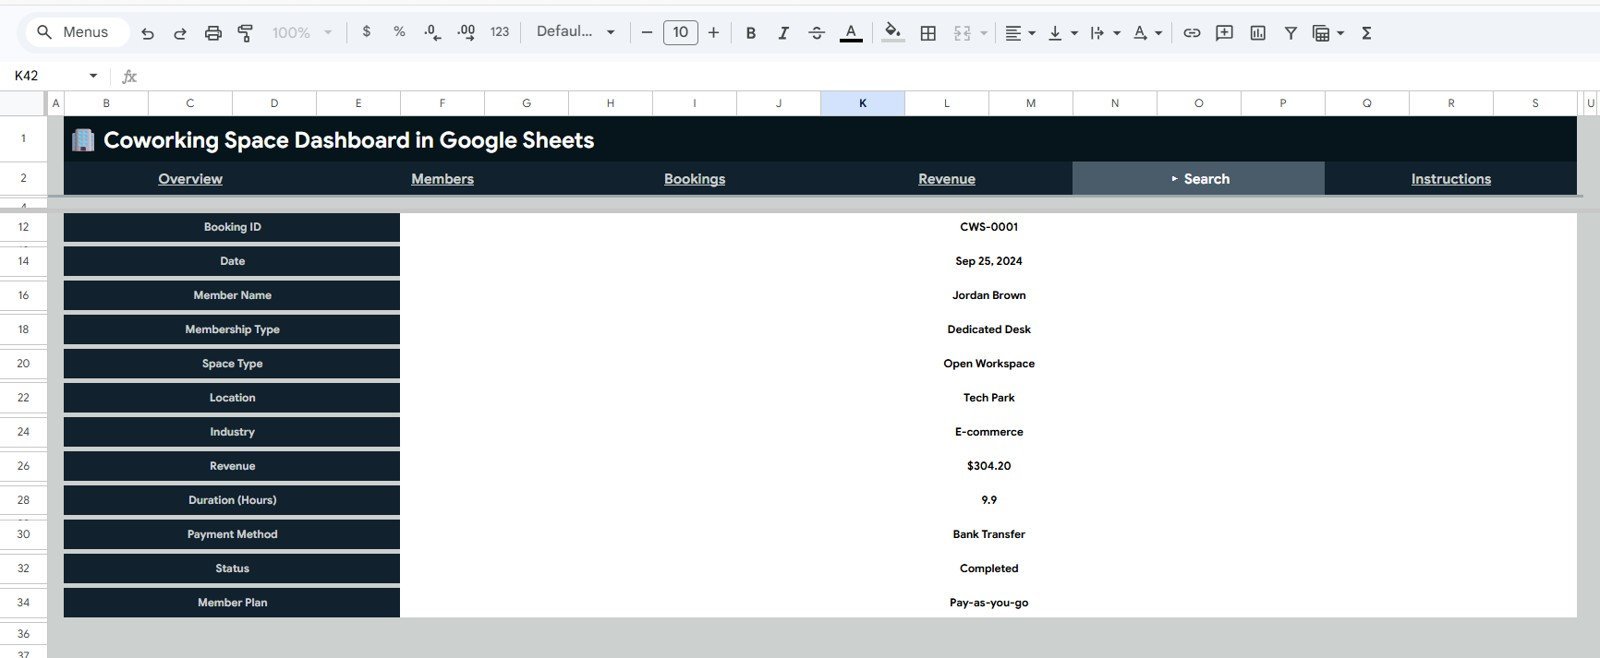
5. Search Sheet Tab
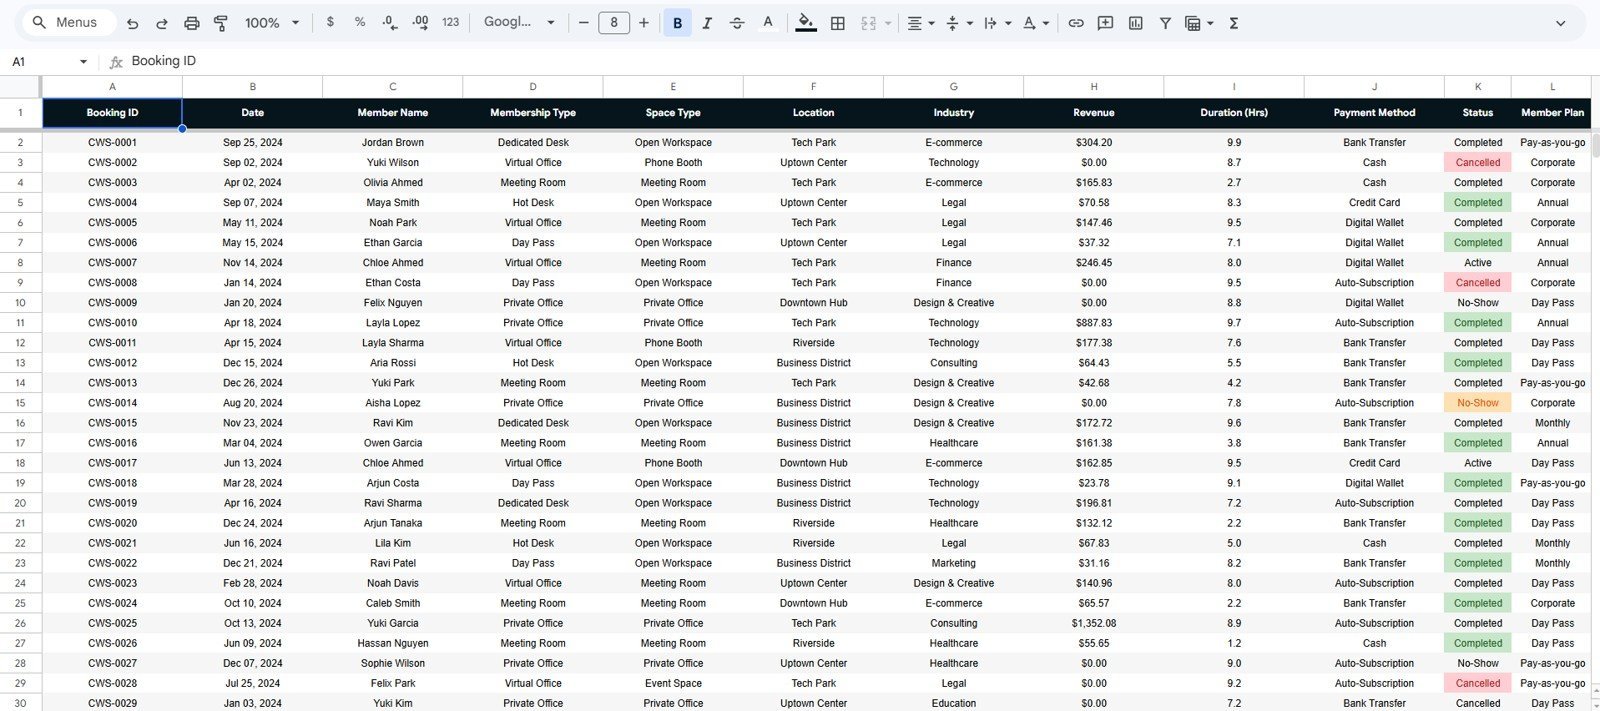
The Search sheet helps users search and review one coworking space booking record at a time. It shows the booking ID, date, member name, membership type, space type, location, industry, revenue, duration, payment method, status, and member plan in a clean lookup view.

6. Data Sheet Tab
The Data sheet is where you add records in the same column format as the sample data. Keeping the column structure consistent allows the dashboard pages, charts, lookup view, and slicers to continue working cleanly.

Coworking Space Dashboard in Google Sheets vs. Excel vs. Paid Coworking Software – Where This Fits
| Feature | This Google Sheets Dashboard | Excel Dashboard | Paid Coworking SaaS |
|---|---|---|---|
| Cost | $9.99 one-time | One-time template or manual build | Usually monthly subscription |
| Platform | Google Sheets in the browser | Excel desktop or Microsoft 365 | Vendor-hosted app |
| Setup time | Under 10 minutes with sample structure | Fast if already built | Often needs onboarding |
| Real-time team collaboration | Yes, through Google Sheets | Limited unless using OneDrive | Usually yes |
| Mobile access | Yes, through the Google Sheets app | Limited for editing | Usually yes |
| Customizable fields | Fully editable | Fully editable | Often restricted by plan |
| Share with link | Yes | File-sharing workflow | Usually user accounts required |
| Year-1 cost at 5 users | $9.99 total | Template cost plus setup time | Can run into hundreds or thousands |
| Coworking booking lookup | Built-in Search sheet | Needs manual setup | Usually available |
| Ownership of data | Your Google Drive | Your local or cloud file | Vendor-hosted |
Who This Template Is For – and Who It’s Not For
This template is for coworking founders, shared office managers, community managers, operations analysts, and small real estate teams that need a simple booking and revenue dashboard without a large SaaS budget.
This template is not for teams that need automated door access control, live payment gateway sync, customer-facing booking portals, row-level permissions, or enterprise integrations out of the box. It is a reporting dashboard, not a full coworking management system.
How to Use the Coworking Space Dashboard in Google Sheets
- Open the PDF guide included with your purchase and click the Google Sheets copy link.
- Create your editable copy in Google Drive.
- Go to the Data Sheet tab and replace the sample rows with your booking records.
- Keep the same column order for booking ID, date, member, membership type, space type, location, industry, revenue, duration, payment method, status, and plan.
- Use slicers on the dashboard pages to filter by location, plan, industry, space type, or status.
- Use the Search sheet to review one booking record in detail.
Real-World Use Cases
Maya, a coworking founder with two locations, uses the Overview and Revenue pages every Monday to compare location revenue and understand whether flex desks or private offices are driving growth.
Arjun, a community manager, uses the Members page to see which industries and member plans generate the most revenue, then plans events and outreach around the strongest segments.
Sofia, an operations analyst, uses the Bookings page to compare total hours and booking count by month so she can recommend space layout changes before peak demand periods.
Frequently Asked Questions
Is the Coworking Space Dashboard in Google Sheets ready to use?
Yes. The template includes sample structure, dashboard pages, charts, slicers, a Search sheet, and a Data sheet. Replace the sample data with your own records.
Do I need advanced Google Sheets knowledge?
No. The dashboard is designed for normal spreadsheet users. You mainly update the Data sheet and use filters or slicers to explore the dashboard.
Can I add more locations or member plans?
Yes. Add the new location, membership type, or member plan in the Data sheet rows and keep the same column structure.
Can multiple team members use the file?
Yes. Because this is built in Google Sheets, you can share the file with view or edit access depending on your team workflow.
Does this replace coworking booking software?
No. It is best used as a reporting and analytics layer. You can export data from your booking system and paste it into the Data sheet for analysis.
What happens if I change the data?
The dashboard views are designed to update from the structured data table. Keep the same field names and format for the cleanest results.
About the Author
Built by PK – Microsoft Certified Professional with 15+ years of Excel, Google Sheets, and Power BI experience. Founder of NextGenTemplates, reaching 300K+ subscribers across YouTube channels. Every template is hand-built and tested before release.
Explore Related Templates
- Space Utilization Dashboard in Google Sheets – a broader space and facility usage dashboard.
- Property Management Dashboard in Google Sheets – useful for rental, rent, occupancy, and maintenance reporting.
- Event Management Analysis Dashboard in Google Sheets – helpful for venues and event booking analysis.
- Real Estate Investment Trusts KPI Dashboard in Excel – a real estate finance KPI companion.
Browse more Google Sheets templates and Google Sheets dashboard templates on NextGenTemplates.
Ready to track bookings, members, revenue, and locations in one clean Google Sheets dashboard? Add the Coworking Space Dashboard in Google Sheets to your toolkit today.
Last updated: May 19, 2026


Reviews
There are no reviews yet.